Produced by The COMET® Program
Detecting a Tsunami
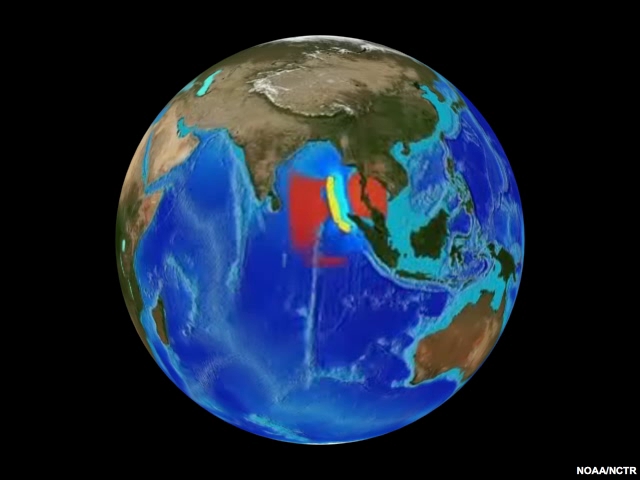
Simulation of the Indian Ocean tsunami of 2004 generated by a 9.1 earthquake.
Seismic data can help determine the possibility of a tsunami. But how do we know if a tsunami is really occurring?
Question
If a tsunami is moving through the open ocean, far from any coasts, will anybody know? (Choose the best answer.)
The correct answer is a).
Oceans are huge, and it is not easy to detect a tsunami moving across such a large area, but tsunami scientists have come up with ways to detect tsunamis even thousands of kilometers from any coast.
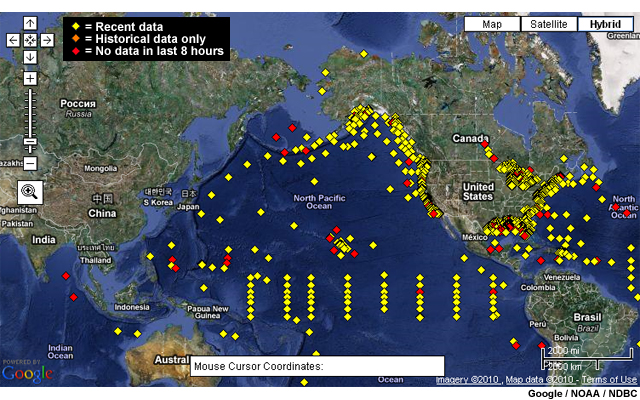
Sea level gauges in open ocean and near ocean and lake coasts
The solution relies on technology, including instruments in the open ocean, near coasts, and aboard satellites.
Near Shore: Sea Level Gauges
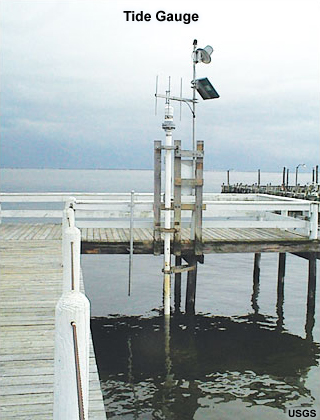
As a wave gets closer to shore, it can be measured by sea level gauges at the coast. You might have seen such a gauge at the end of a pier. They provide information about sea level for ships, fisherman, beachgoers, and others. These gauges will also measure an incoming tsunami.
Sea level gauges record changes due to tides, weather, and other effects. Tides occur based on the positions of Earth and its Moon. Near a coast, high tides occur an average of 12 hours and 25 minutes apart. Tides appear as long-period (and low frequency) changes in sea level.
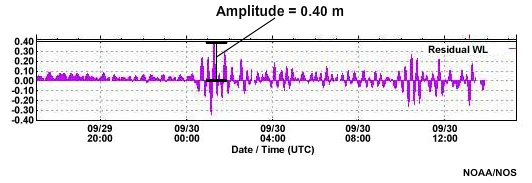
In this graph, the expected tide levels relative to mean sea level are indicated by the solid blue line. The actual deviations (or differences) from mean sea level are shown in red, yellow, and green. The differences between the observations and the expected tide levels can be seen in purple, in the bottom plot.
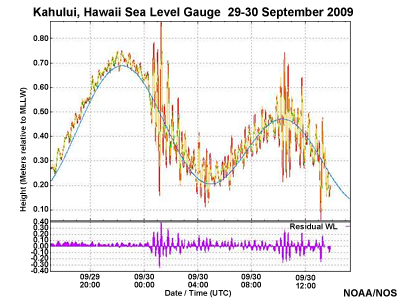
These observations are from Kahului, Hawaii, 6 hr 12 min after the M8.3 earthquake southwest of American Samoa on 29 September 2009.
Using the data shown here, can you find the highest observed tsunami wave height at Kahului? Hint: The bottom plot will be most useful for finding this value. Don't forget to account for the differences both above and below the expected tide level to get the full peak-to-trough wave height.
Question
Based on the data in the graph, what is the highest observed tsunami wave height at Kahului? (Choose the best answer.)
Hint: The bottom plot will be the most useful for finding this value. Don't forget to account for differences both above and below the expected tide level to get the full peak-to-trough wave height.
The correct answer is d).
The highest observed wave height at Kahului was 0.75 meters, which is the maximum peak-to-trough difference based on the sea level height residual shown by the purple line.
Note that the amplitude of the wave is the maximum difference between the measured sea level and the expected average sea level given by the 0.00 line on the plot. In this case, the tsunami amplitude is about 0.40 meters. Amplitude is the value most often reported in the Tsunami Warning Center products and is typically one-half the total peak-to-trough tsunami height.
In Open Ocean: Pressure
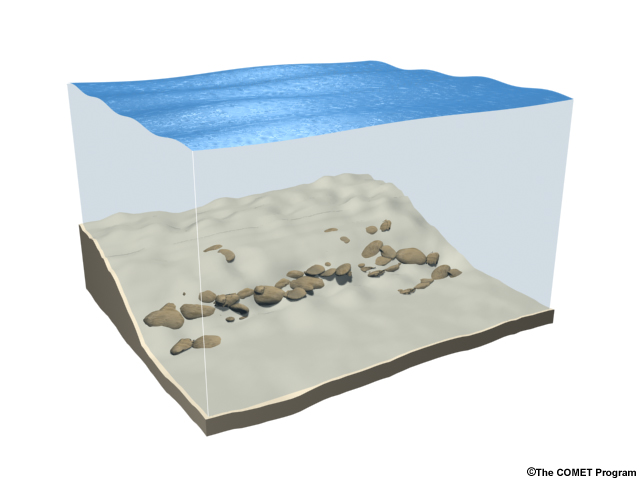
Let's look at how tsunamis are detected in the open ocean. Discovering if a tsunami happened and how big it is means looking for changes in sea level. These changes show up as differences in water pressure measured from the ocean floor.
Question
What is pressure? (Choose the best answer.)
The correct answer is b).
Pressure is a force, or weight, that an entity (in this case, water) exerts on a unit of area.
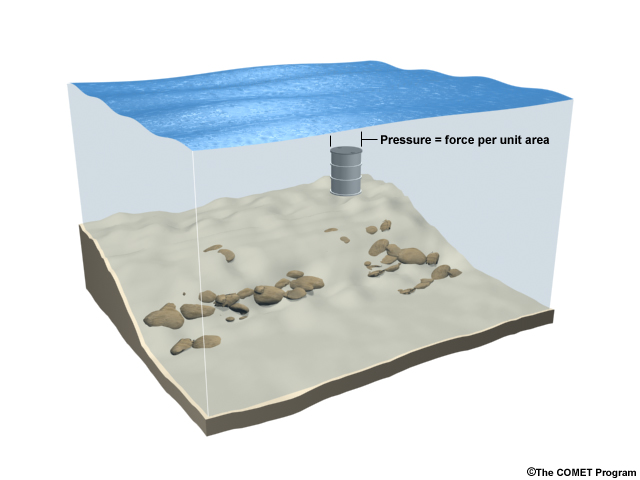
Steel drum in shallow ocean water.
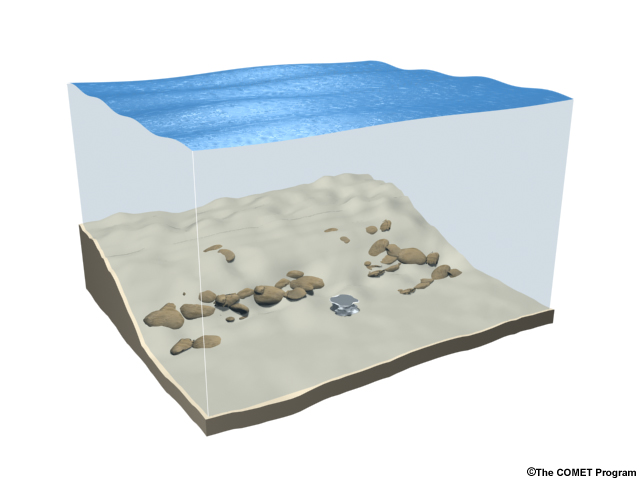
Steel drum crushed by the force of water pressure in deep water.
In the ocean, as depth increases, there is more water between the ocean floor and the surface, and the pressure becomes greater.
If we dive toward the bottom of a pool, we'll have water pressure pressing in on us, and our whole bodies will able to detect that force. The deeper we go, the more water pressure we'll experience. If we could dive down deep into ocean, at 4000 meters deep, the pressure would be about 400 atm—equivalent to the weight of 400 of Earth's atmospheres.
Question
Water pressure increases about 1 atm per every 10 m of depth. Based on that information, what is the water pressure 2960 m below the ocean surface? (Choose the best answer.)
The correct answer is c).
2,960 m x 1 atm/10 m = 296.0, or 296 atm.
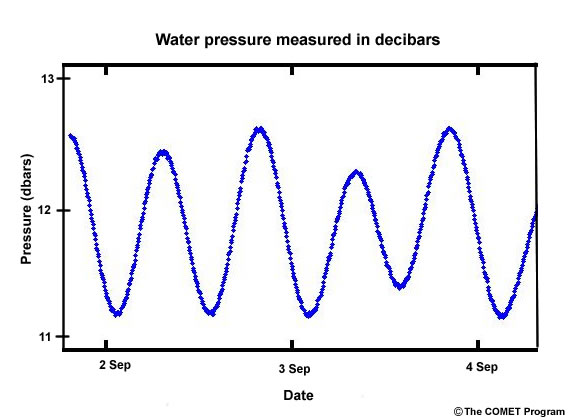
Oceanographers often use a unit called decibars for expressing ocean pressure. In SI (International System of Units, or System International) notation, the prefix "deci" means one-tenth, so one decibar is one-tenth of a bar.
Oceanographers like to use decibars because one decibar corresponds to approximately 1 meter of water depth, allowing for quick approximation of sea level heights.
DART Buoys
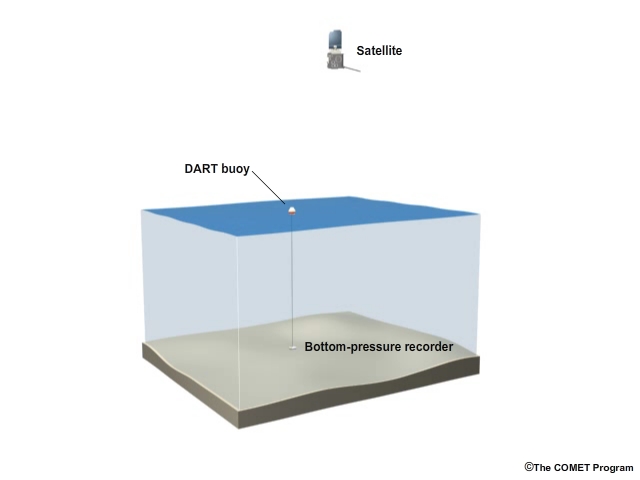
Instruments called bottom-pressure recorders (or BPRs) measure water pressure in the ocean and are part of the Deep-Ocean Assessment and Reporting of Tsunamis system, or DART for short. A buoy floating on the ocean's surface holds communications equipment that transmits the BPR measurements to the Tsunami Warning Centers.
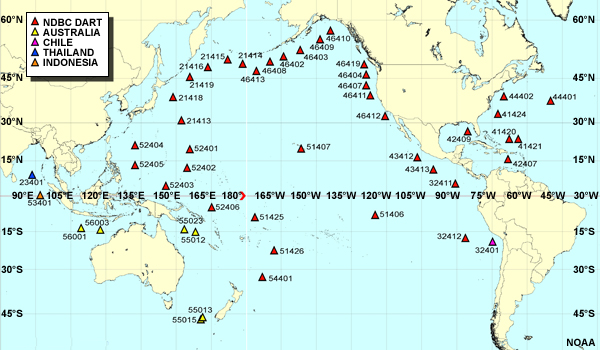
These DART stations are located in oceans around the world, mainly off the coastlines that are most vulnerable to a tsunami.
DART stations record and transmit pressure based on the water depth, which will change depending on tides, waves generated by weather, or a tsunami traveling over the sensor.
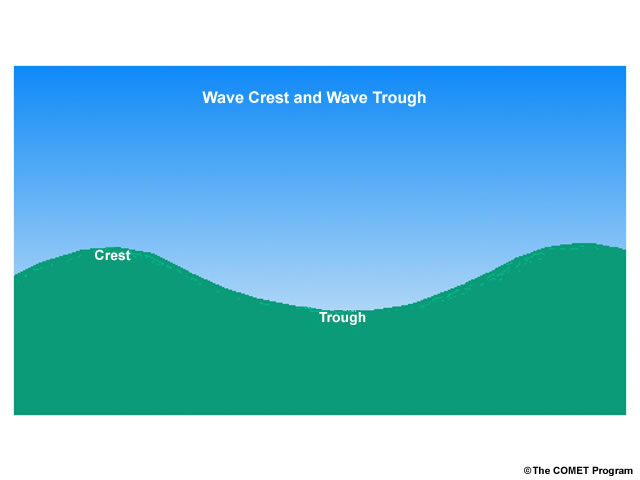
Remember that a tsunami is a wave, having a crest and trough. What do you think will happen to the BPR as a tsunami wave passes over it?
Question
If the crest of a wave passes overhead, a bottom-pressure recorder will: (Choose the best answer.)
The correct answer is a).
Question
If the trough of a wave passes overhead, a bottom-pressure recorder will: (Choose the best answer.)
The correct answer is b).
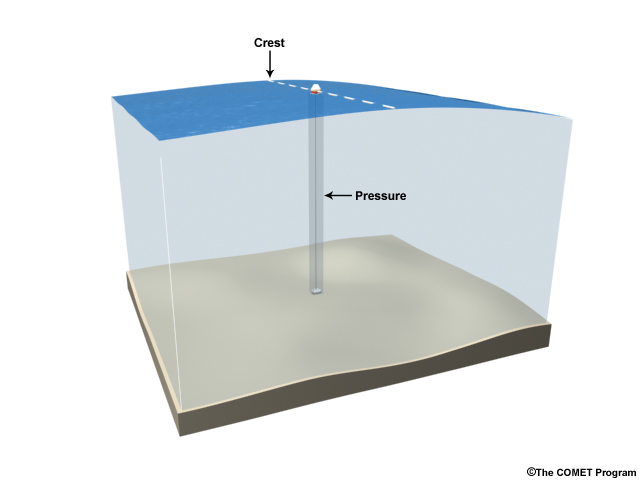
As the wave crest moves over the sensor, the pressure (or weight) of the water increases.
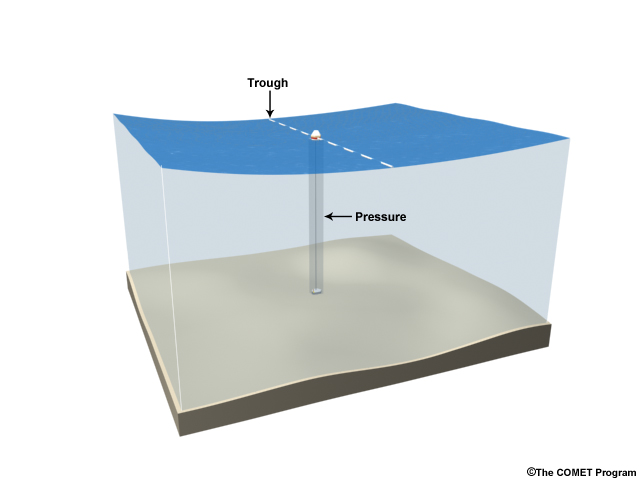
As the wave trough moves over the sensor, the pressure (or weight) of the water decreases. For a tsunami, these wave effects can be easily observable, leaving little doubt that dangerous waves are headed toward the coast.
Sea Level Height
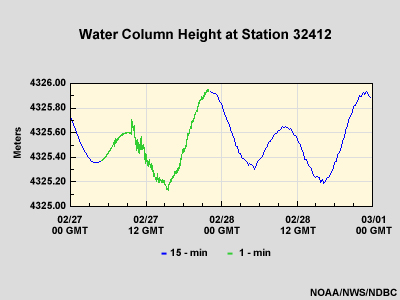
When a tsunami is happening, DART instruments transit one-minute values of sea level height to the warning centers. The scientists use these values to determine the height of the tsunami waves.
Question
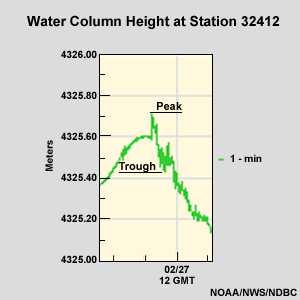
What is the approximate tsunami wave height as shown in the figure? Remember that the tsunami wave height occurs on top of the water level changes caused by tides, which are represented by the large curve shown in green. The peak and trough of the tsunami wave are marked to aid you. (Choose the best answer.)
The correct answer is b.
The estimated wave height is 4325.75 meters – 4325.45 meters = 0.30 meters.
Satellite Instruments

The Jason-1 altimeter overflight path is overlaid on a tsunami wave height image.
There's nothing like a birds-eye view of what's happening over the oceans far from any land, and that's where satellite data can help. This image shows the path of the Jason-1 altimeter, an instrument that measures sea surface height from space. It overflew the region about two hours after the earthquake that caused the 2004 Indian Ocean tsunami. The colors correspond to wave height variations caused by the tsunami.
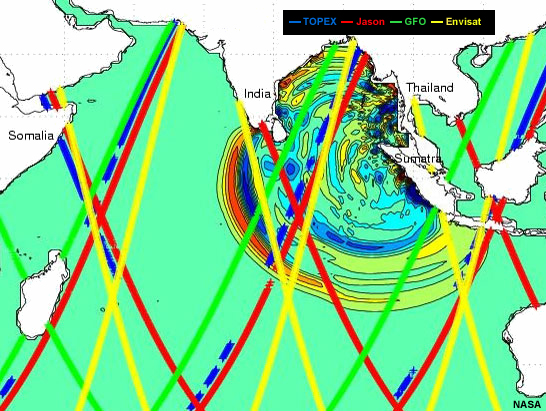
Orbits of four altimeter-carrying satellites (TOPEX, Jason, GFO, and Envisat) as they passed over the Indian Ocean. The tsunami wave heights are illustrated by the color-coded concentric circles.
Notice how wide the waves are, indicated by the size of the yellow and yellow-green circles indicating tsunami waves.
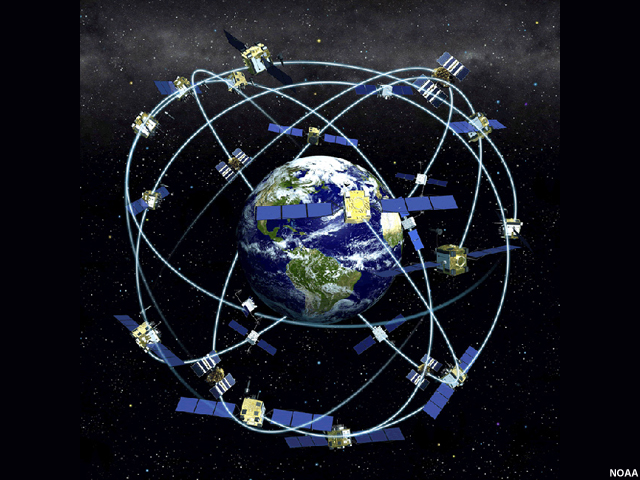
A few satellites in orbit around Earth currently carry altimeters, providing lots of sea level and other types of measurements.
But an orbiting satellite can't see all parts of the globe at all times, and it can also take a long time to download and process the data. These issues mean that it's not yet possible to use satellite instruments to measure tsunamis in real time. Still, the data they provide can be used to help scientists improve forecast models of tsunamis, and it's exciting to think about the information that future satellite missions could provide.
Summary
Wave heights can be measured by sea level gauges near coasts. These gauges are numerous and routinely provide sea level data for boaters, beachgoers, and others who rely on the information.
In the open ocean, tsunamis can be detected by instruments that measure changes in water pressure.
Pressure is the force, or weight, that an entity (in this case, water) exerts on a unit of area. As water depth increases, pressure increases.
Oceanographers frequently use the unit “decibars” when talking about water pressure, because 1 decibar corresponds to about 1 meter of water depth.
Instruments called bottom-pressure recorders (BPRs) measure water pressure as part of the Deep-Ocean Assessment and Reporting of Tsunamis (DART) system.
DART instruments are strategically placed in oceans around the world and transmit water pressure measurements to the Tsunami Warning Centers. Scientists use the changes in water pressure to determine the height of the tsunami waves.
Satellite altimeters can also measure sea level heights, but cannot always provide information right as a tsunami is occurring.
Click here to return to the 30 Minutes Page.