Produced by The COMET® Program
Detecting a Seismic Event
Scientists at a Tsunami Warning Center are called Watchstanders, but that doesn't mean they continually watch the world's oceans for evidence of tsunamis. Instead, their job requires first watching measurements of seismic energy, which is the energy released when rock suddenly breaks or moves within the earth.
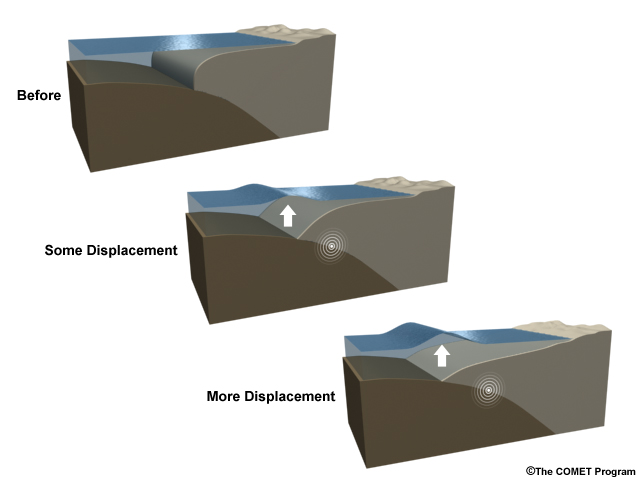
These seismic events, including earthquakes and landslides, are what trigger tsunamis by lifting and moving large amounts of water. Knowing when an earthquake occurs is straightforward based on seismic measurements, but deciding if a particular seismic event could have triggered a tsunami takes a little more detective work.
Seismic Energy
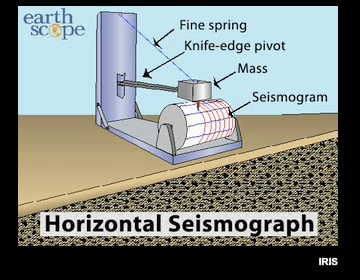
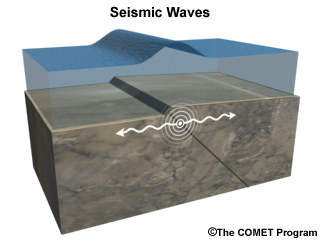
Energy from a seismic event will show up as rapid, higher-than-normal oscillations on a seismometer.
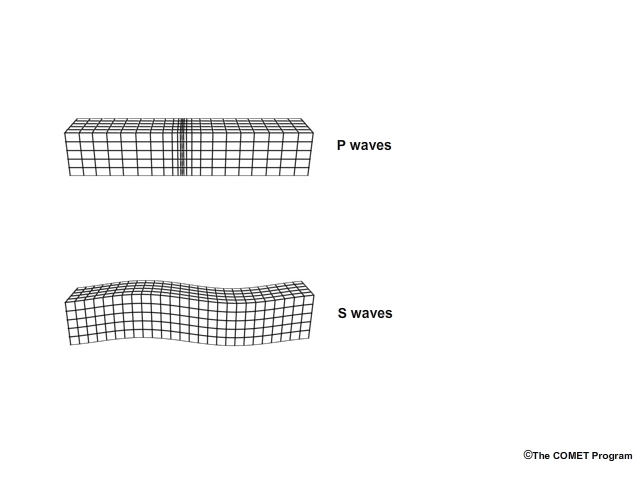
"Body" waves travel through the body or inner part of Earth and include Primary or P waves and Secondary or S waves. Surface waves travel along Earth's surface like ripples across a pond.
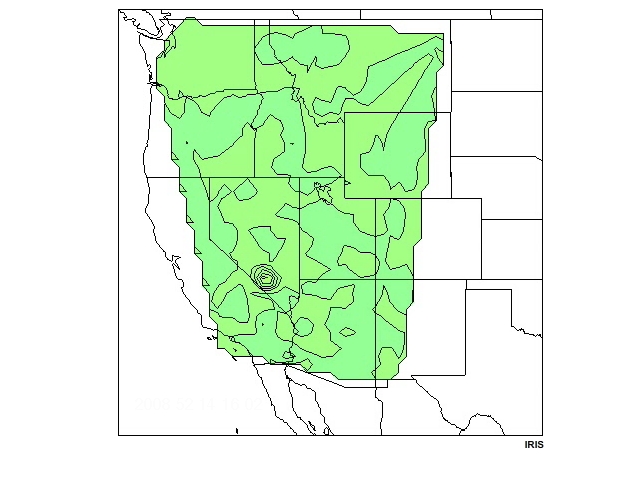
Surface waves from an earthquake in northeastern Nevada, U.S.A.
Seismometer Data
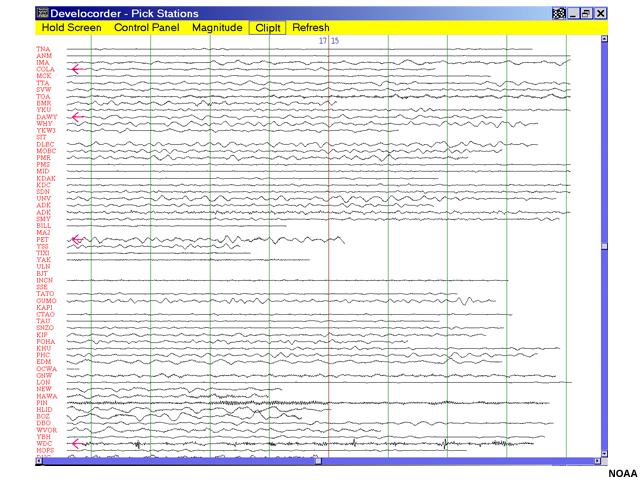
Seismic data being monitored by one of NOAA's Tsunami Warning Centers. Each line represents data for one station.
Seismic data from all over the world come to the Warning Center continuously.
When one or more seismometers record a signal from a strong seismic event, an alarm is triggered and the Watchstanders get to work analyzing the event to see if it could have generated a tsunami.
Question
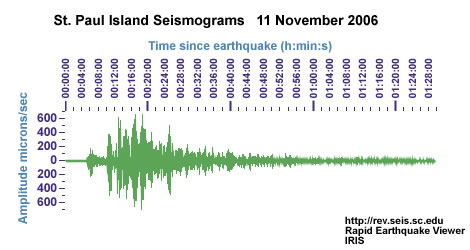
Use the seismogram measurements shown above from St. Paul Island in Alaska. Can you identify the earthquake shown on this seismograph? Pick the time you think the earthquake was first recorded on the seismometer. (Choose the best answer.)
The correct answer is b).
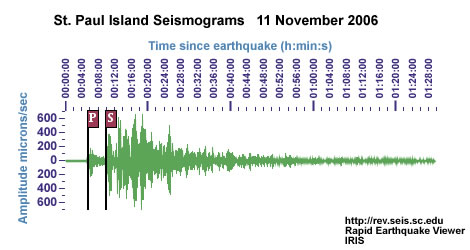
The first waves are the Primary, or P, waves. On this trace, they appear smaller than the Secondary, S, waves, which arrive at about 10 minutes after the quake. The waves continue to ripple through the earth and show up on the seismograph as smaller and smaller peaks.
P and S Waves
As you saw in the exercise, the first waves to show up on a seismograph are the Primary, or P, waves. The Secondary, or S, waves follow.
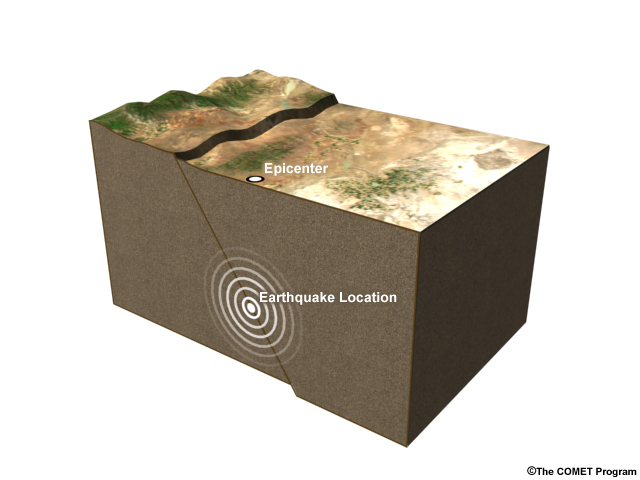
The difference between the P-wave arrival time and the S-wave arrival time provides an estimate of the seismometer's distance from the earthquake epicenter, or the location at the surface above the earthquake.
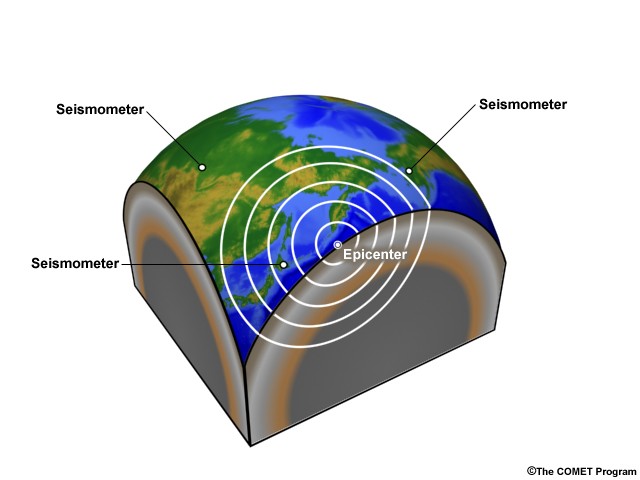
Once earthquake data are recorded at three seismometer locations, the P-wave and S-wave arrival information can help locate the earthquake epicenter. Complete the next exercise to see why three seismometer locations are needed.
Exercise
Question 1
Question
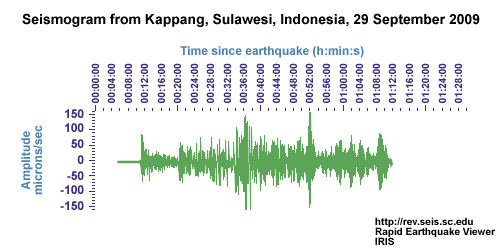
Exercise: As seismic waves are observed at different locations, the wave arrival times provide information about a station's distance from the earthquake.
In this seismogram from Kappang, Indonesia, can you identify the Primary (P) and Secondary (S) wave arrival times? Estimate the arrival times to within the nearest one minute. Remember, the P-wave arrives first.
Please enter your answer in format minutes:seconds (mm:ss):
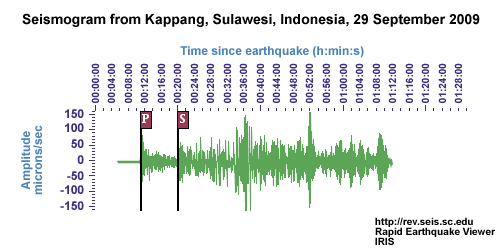
Kappang P-wave arrival ~11:00
Kappang S-wave arrival ~20:00
Question 2
Question
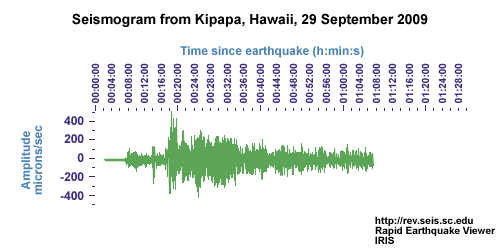
Here's a seismogram from Kipapa, Hawaii. Identify the P-wave and S-wave arrival times on the plot and fill in the blanks below. Estimate the arrival times to within the nearest one minute.
Please enter your answer in format minutes:seconds (mm:ss):

Kipapa P-wave arrival 8:00
Kipapa S-wave arrival 14:00
Depending on how you viewed the graph, you may have chosen either 7:00 and 13:00 or 8:00 and 14:00 as your answers. In reality, the arrival times were 7:30 and 13:30. To simplify going forward, we will use the 8:00 and 14:00 times.
Question 3
Question
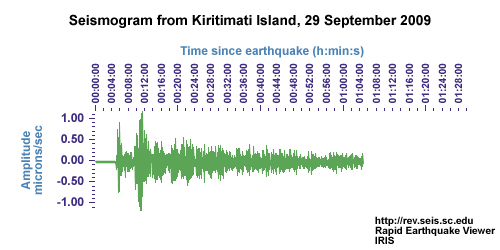
One more location will give us enough information so that we can then locate the earthquake. Use this seismogram to identify the P-wave and S-wave arrival times at Kiritimati Island. Estimate the arrival times to within the nearest one minute.
Please enter your answer in format minutes:seconds (mm:ss):
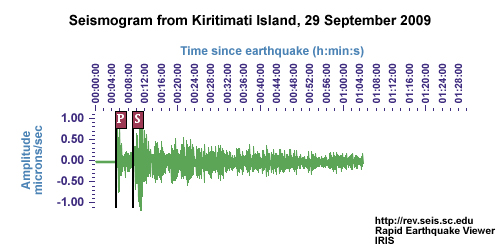
Kiritimati P-wave arrival ~5:00
Kiritimati S-wave arrival ~9:00
Question 4
Question
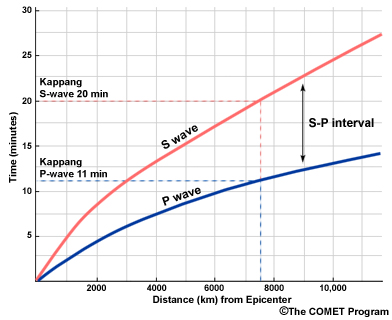
Now, let's translate the seismic wave arrival times to distances. Here are the wave arrival times, which mark the time needed for each wave to travel from the quake location to the seismograph. The quake occurred at 06:48:11 local time on 29 September. Using the plot of arrival time versus distance, find the distance of each seismogram location from the earthquake epicenter. The arrival times and corresponding distance are marked for Kappang for you to use as an example.
Enter your distance estimates for each location.
Kappang P-wave arrival 11:00
Kappang S-wave arrival 20:00
Distance ~7500 km
Kipapa P-wave arrival 8:00
Kipapa S-wave arrival 14:00
The actual distance computed for this event was 4358 km. If you found an answer in the range 4000 to 4500 km, you did very well at reading the graph, which provides an approximate distance. We will use ~4300 km as the answer going forward.
Distance ~4300 km
Kiritimati P-wave arrival 5:00
Kiritimati S-wave arrival 9:00
Distance ~2500 km
Question 5
Question
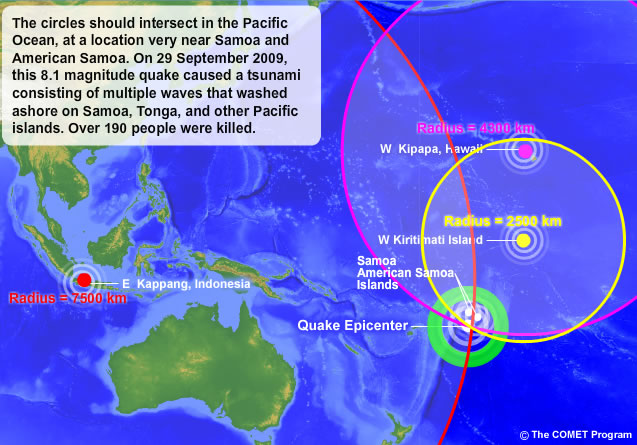
Once we know the distances, we can use the locations of the seismic stations to estimate the epicenter of the earthquake.
For each location, move the center of the circle whose radius matches the value you found in the time-distance plot to its appropriate seismic station.
Kappang 7500km
Kipapa 4300km
Kiritimati 2500km
When you have moved all the circles to their appropriate locations, click "Done".
Earthquake Magnitude
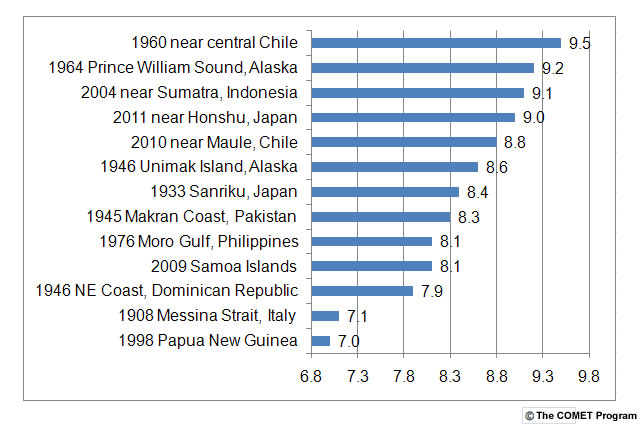
Magnitude numbers are indicated along the bottom scale of the graph. These recent significant earthquakes that triggered tsunamis were all magnitude 7.0 or greater.
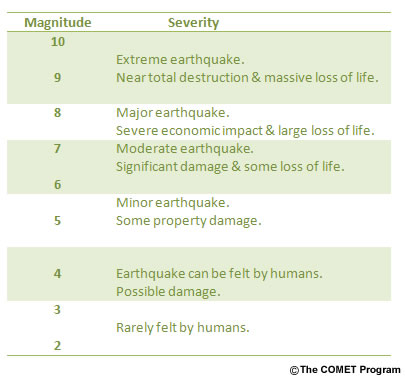
At the Tsunami Warning Centers, computer systems enable Watchstanders to find the earthquake location very quickly. The Watchstanders also need to know how large the earthquake was before they can decide if it could have generated a tsunami. A large earthquake generates more movement of the earth and therefore has a higher magnitude. Watchstanders worry a lot about earthquakes with a magnitude of 7.0 or higher, because if these bigger quakes occur beneath the sea, they are more likely to have large rupture areas and lift more sea water, causing a tsunami.
At the Warning Center, Watchstanders use different scales to estimate magnitude, including a value called moment magnitude. Moment magnitude estimates the amount of energy released by an earthquake, which has a direct relationship to how much the earth moves.
The energy released also corresponds to a quake's destructive power, so big magnitude numbers are worthy of concern.
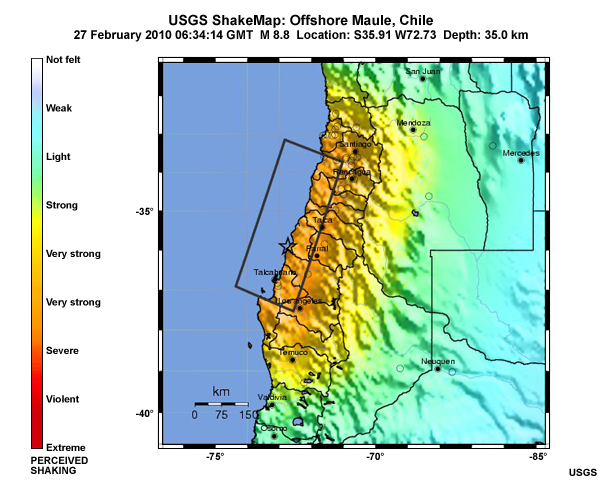
The quake occurring near Chile in February 2010, which launched a tsunami across the Pacific Ocean, had a magnitude of 8.8.
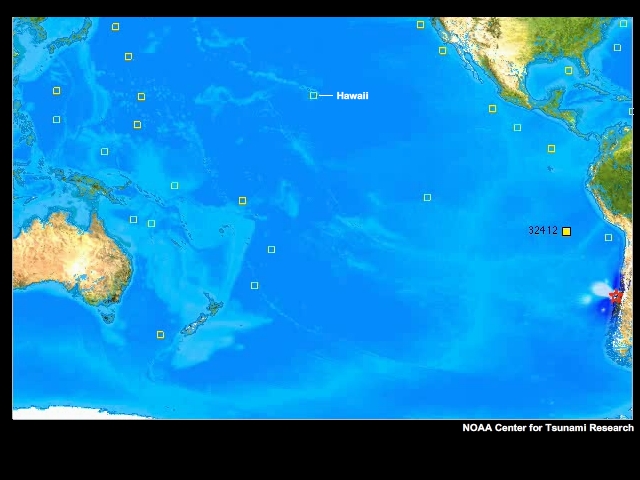
A computer model animation of the 2010 Chile tsunami.
Interpreting Tsunami Potential
A Watchstander's job is challenging because not all big quakes will cause a tsunami. The Watchstanders keep looking at the seismic data to try to find out the type of earthquake that occurred, precisely where it occurred, and how big the rupture area was.
Piecing all this information together, they can decide whether a large amount of water could have been displaced and if a tsunami is possible. If it is, the next step will be getting Tsunami Warnings out to people who need them.
Question
Why do you think it is so difficult to determine if an earthquake generated a tsunami? (Choose all that apply.)
The correct answers are all the above.
The Watchstanders need to decide if an earthquake could have caused a tsunami even before any ocean data are available. That is why they look so closely at the seismic data to try to determine earthquake size and location. Even then, they might not know everything about the earthquake, such as the size of the rupture area and how far it extended under the ocean.
Summary
Scientists at a Tsunami Warning Center are called Watchstanders.
Watchstanders monitor measurements of seismic energy, which is released when rock breaks or moves, such as in an earthquake or landslide.
Seismic energy includes Primary “P” and Secondary “S” waves that travel through Earth’s interior, as well as surface waves. Travel times of the different waves can help pinpoint the earthquake location.
An earthquake’s size is expressed as a magnitude. Generally, earthquakes with magnitudes of 7.0 or higher have the greatest tsunami potential.
Large quakes result from more movement of the earth, which can in turn displace larger amounts of water.
Whether a given quake causes a tsunami depends on several factors, including the size of the rupture area and its location under the sea.
Click here to return to the 0 Minutes Page.