1 African Easterly Jet
1.1 AEJ Description
The heating of the West African land mass during the Northern Hemisphere summer creates much hotter and dryer conditions in central West Africa than immediately south in the ITCZ.
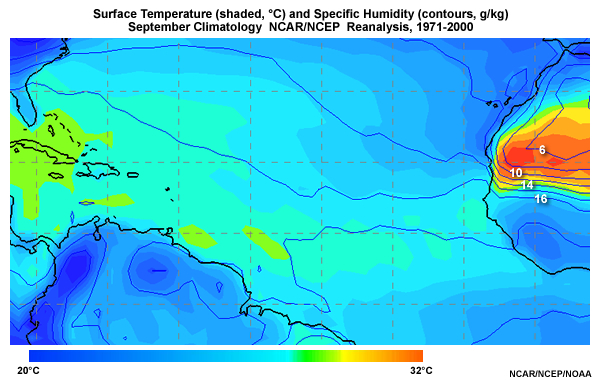
A jet develops due to the significant surface temperature and moisture gradient from the Gulf of Guinea to the Sahara.
From August to September, the mature phase of the West African Monsoon, the African Easterly Jet reaches maximum mean wind speeds of approximately 13 m/s. The jet maximizes at a height of about 4 km (or 650 hPa) and typically around 11°N latitude.
1.2 African Easterly Waves
The jet exhibits both barotropic instability from vorticity gradients, and baroclinic instability from temperature gradients, both of which are important initial energy sources for the disturbances in the jet known as African easterly waves.
As these waves continue to propagate westward, some of the mesoscale storm systems associated with these tropical waves develop into tropical storms and hurricanes as they move into the tropical Atlantic.
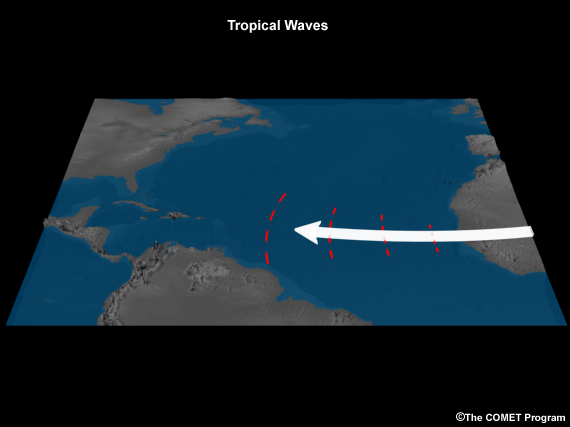
The African easterly waves propagate through a region of cyclonic shear associated with the jet and located on its southern flank (shown with red and orange shading), which increases the likelihood of cyclogenesis.
1.3 Cyclonic-Shear/Low Vertical Shear Overlap
During average years, a cyclonic-shear zone is typically well-defined between 8°-15°N, and overlaps the region of low vertical wind shear.
The overlap increases in September during the climatological peak of Atlantic tropical cyclone activity.
1.4 When AEJ is Bad for Tropical Cyclones
In some years, the position and strength of the AEJ is not conducive to topical cyclogenesis in the eastern Atlantic.
With a more southerly AEJ, the primary region of cyclonic vorticity is located to south of 10°N, where tropical cyclogenesis is less likely due to the greater proximity to the equator, where coriolis force (a necessary condition for cyclogenesis) is zero.
When the jet is weaker than normal and relatively diffuse over the eastern tropical North Atlantic, a smaller region of cyclonic vorticity develops.
When this occurs, very little overlap is seen between the area of weak cyclonic vorticity and the region of low vertical wind shear.
1.5 When the AEJ is Good for Tropical Cyclones
On the other hand, when the African easterly jet is well-defined and located north of normal, tropical cyclogenesis in the eastern Atlantic is more likely.
With a well defined AEJ, a strong gradient in zonal wind is present just south of the jet core, creating large areas of cyclonic relative vorticity between 10°-15°N.
In addition, because the jet is farther north, there is extensive overlap of the regions of large cyclonic relative vorticity and low vertical wind shear to the south of the AEJ.
This more favorable location and horizontal structure of the African easterly jet, together with the enhanced overlap of relative vorticity and low vertical wind shear, increases tropical cyclogenesis and hurricane development within the easterly waves.
1.6 References
The Structure and Properties of African Wave Disturbances as Observed During Phase III of GATE Richard J. Reed, Donald C. Norquist, and Ernest E. Recker Monthly Weather Review Volume 105, Issue 3 (March 1977) pp. 317–333
Climate Prediction Center, NCEP/NWS/NOAA, retrieved 2007: Climate Assessment for 1997. [Available online at http://www.cpc.noaa.gov/products/assessments/assess_97.]
Section 2: Loop Current
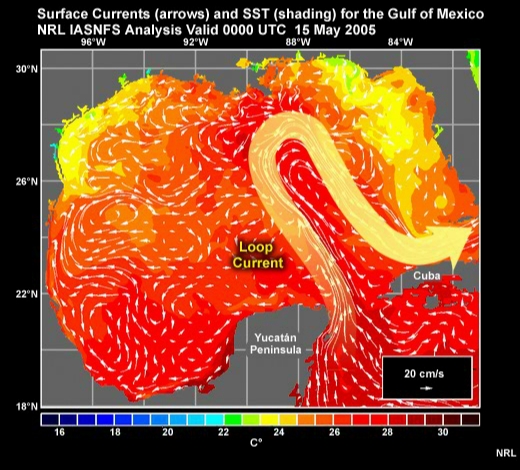
2.1 Loop Current
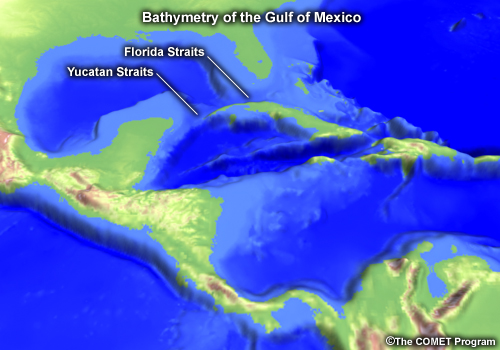
The Loop Current is a warm ocean current in the Gulf of Mexico. It enters the Gulf from the south between Cuba and the Yucatán peninsula and exits to the east through the Florida Straits, where it joins with the Gulf Stream.

2.2 Influence of Bathymetry
The location of the Loop Current is strongly controlled by the bathymetry of the Gulf of Mexico. As we can see in this graphic, the deep, warm water of the Loop Current enters and exits the Gulf through the deep notches of the Florida and Yucatan straits.
2.3 Loop Current Ring
The Loop Current follows a variable path. At one extreme, it flows almost directly from the Yucatan Straits along the north coast of Cuba to the Florida Straits. At the other extreme, the Loop Current flows as far north as the Mississippi Delta before looping clockwise back to the south.
The Loop Current returns to its more direct configuration by slowly pinching off its northward extension to form a large, warm-core, clockwise-rotating ring, or eddy. This current ring then drifts west at speeds of 2-5 km per day.
This animation shows the formation of a current ring over a period of several weeks, followed by its slow westward drift.
2.4 Loop Current and Ocean Heat Content
In the Gulf of Mexico, the deepest areas of warm water (those with high values of Ocean Heat Content) are associated with the Loop Current and its warm-core rings.
Section 3 Meridional Overturning Circulation
3.1 Deep-Ocean Currents
Currents in the deep open ocean are driven primarily by differences in density. Temperature and salinity determine the density of sea water. Because temperature varies more than salinity, temperature more strongly controls density.
These images show north-south oriented vertical cross sections of temperature and salinity in the Atlantic Ocean. Note that the deep water originates at high latitudes. This occurs in response to intense cooling.
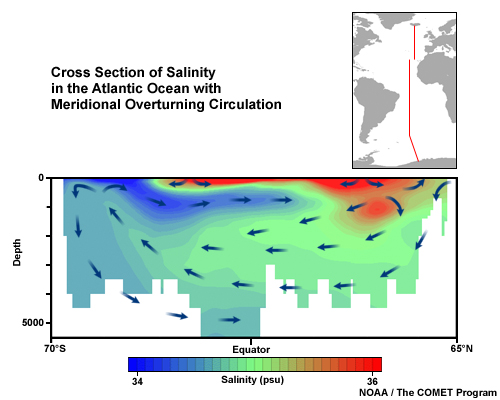
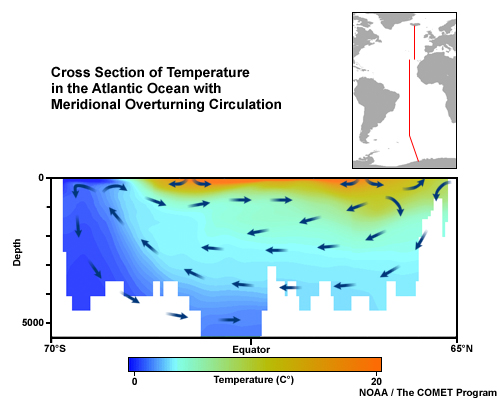
Seawater cools and sinks in the Arctic Ocean. This deep, cold water from the Arctic then flows south around Greenland and sinks into the North Atlantic, forming North Atlantic Deep Water. This process initiates Meridional Overturning Circulation (MOC).
3.2 Meridional Overturning Circulation (MOC)
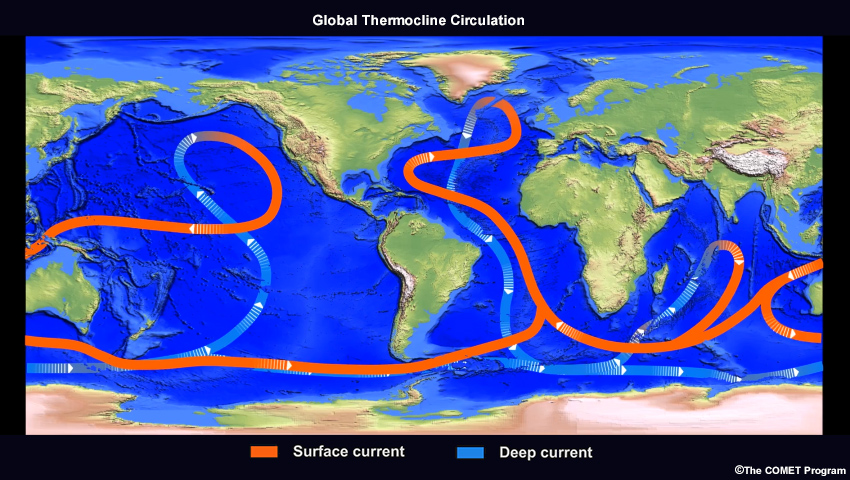
As this animation shows, Meridional Overturning Circulation moves through all the world's ocean basins.
As we see here, deep water forms in the North Atlantic, rather than the North Pacific. North Atlantic Deep Water is denser than North Pacific Deep Water because shallow bathymetry in the Bering Sea blocks any deep Arctic water from flowing south into the Pacific basin.
As a result, the strength of the MOC depends on the rate of formation of North Atlantic Deep Water.
Click to view the animation.
3.3 MOC and Hurricane Activity – SST
In general, oceanic and atmospheric conditions in the Atlantic Ocean are borderline for tropical cyclone development. Consequently, if on an ocean/climate scale, SSTs increase slightly and wind shear decreases slightly, more storms will occur, on average.
As it turns out, a stronger MOC leads to both higher SSTs and lower wind shear and hence, promotes more tropical cyclones in the Atlantic.
Let’s first look at SSTs. As this time series demonstrates, a stronger MOC correlates with higher SSTs, and vice versa. This occurs because a stronger MOC means stronger surface currents bringing warm water (and higher SSTs) from low to high latitudes.
Also note that the strength of the MOC oscillates: approximately 50 years of stronger MOC followed by approximately 50 years of weaker MOC. This is thought to contribute to a similar periodicity in tropical cyclones.

3.4 MOC and Hurricane Activity – Wind Shear
The second reason that a stronger MOC promotes more tropical cyclones regards wind shear. When the MOC is strong, the mid-latitude upper-level westerlies are weaker, resulting in lower vertical wind shear over the tropical Atlantic. Why should that be so?
As this graphic shows, the tropics receive the greatest amount of solar insolation per year, with more energy coming in from space than is radiated back out. Oceanic and atmospheric circulation moves this surplus of energy from the tropics to the colder parts of the globe.
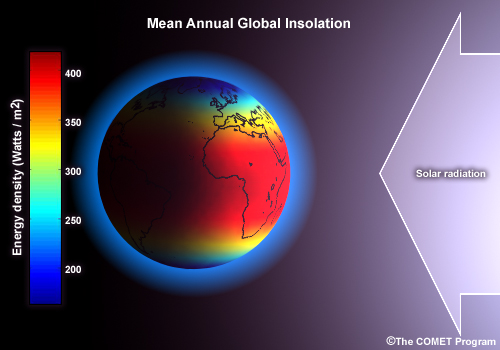
Currents in the Atlantic Ocean transport between 1/4 and 1/3 of the northern-hemisphere heat flux. Thus, when the MOC is stronger, the ocean transports more heat and the atmosphere consequently transports less heat than normal.
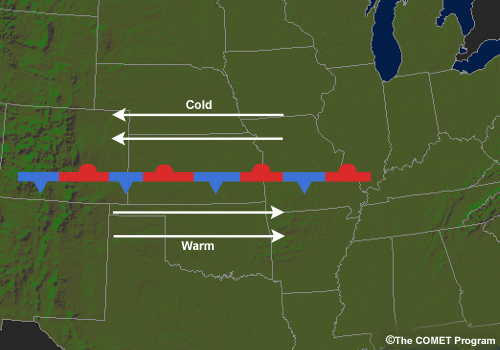
In the atmosphere, mid-latitude cyclones are the primary heat transport mechanism. In this animation showing the life cycle of a typical mid-latitude cyclone, southerly winds ahead of the cyclone move warm air north, and northerly winds behind the cyclone move cold air south.
These mid-latitude cyclones also help drive the mid-latitude upper-level westerlies. If the mid-latitude cyclones are weaker than normal, then these westerlies are also weaker. Thus, a stronger MOC leads to weaker mid-latitude cyclones, and hence, weaker mid-latitude upper-level westerlies. This decreases wind shear in the tropics, which provides a more favorable environment for the development of tropical cyclones.
3.5 References
Latif, M., E. Roeckner, M. Botzet, M. Esch, H. Haak, S. Hagemann, J. Jungclaus, S. Legutke, S. Marsland, U. Mikolajewicz, and J. Mitchell, 2004: Reconstructing, Monitoring, and Predicting Multidecadal-Scale Changes in the North Atlantic Thermohaline Circulation with Sea Surface Temperature. J. Climate, 17, 1605–1614.
Section 4: Ocean Heat Content
4.1 Basic Ocean Mixing
Tropical cyclones most often develop when sea surface temperatures (SSTs) are at least 26°C. A continuous supply of warm water is one of several critical factors that enable hurricanes to intensify.
The strong winds associated with hurricanes cause mixing of the upper ocean.
If the water below the surface is significantly cooler, mixing of the upper ocean may drop the surface temperature. This, in turn, may limit the hurricane's ability to strengthen, and may even cause it to weaken.

Click to view the animation.
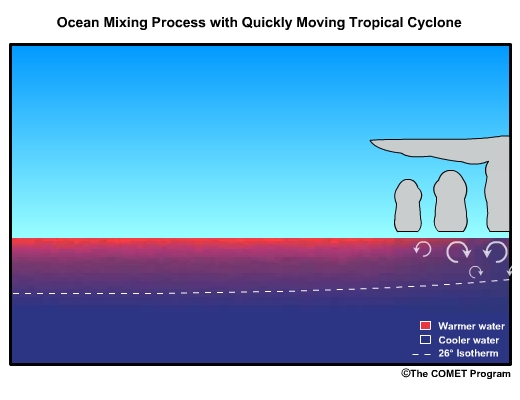
4.2 Ocean Mixing with Quickly Moving Storm
When a hurricane is traveling quickly over a region of warm SSTs, intensity might be maintained despite mixing if the hurricane moves on before the cooler water can affect it.
Click to view the animation.
4.3 Ocean Mixing with Deep Warm Water
Slower moving hurricanes may still intensify despite mixing of the upper ocean. If the water being mixed from below is warm enough, then after mixing the surface water can remain warmer. This allows the hurricane intensity to increase, assuming other atmospheric conditions also support strengthening.
Therefore, in order to determine the likelihood that a tropical cyclone will intensify, we must know both the sea surface temperature as well as the depth of the warm water.

Click to view the animation.
4.4 Vertical Cross-section of Temperature
Here we see a vertical cross-section of temperature along the equator.
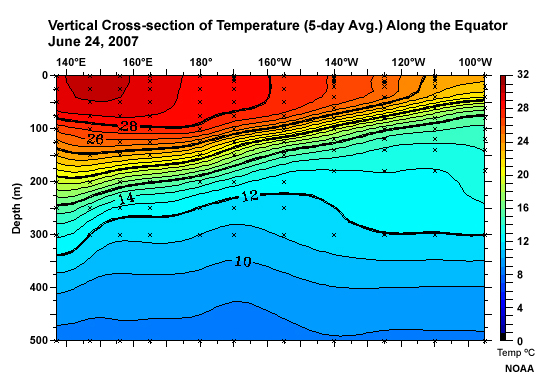
A tropical cyclone traversing the Pacific Ocean, from east to west, will first encounter SSTs warmer than 26ºC in the middle of the Pacific, at around 130ºW. A tropical cyclone, in the absence of strong wind shear, will intensify due to this warm water. The storm will extract energy from the water below.
If the storm is stationary, eventually, the heat of the surface layer will be depleted. A storm that is stationary over the western Pacific will be able to draw more heat from the water than a storm over the eastern Pacific as there is a greater depth of warm water.
4.5 Temperature-Depth Profile
We can use a temperature-depth profile to envision how the ocean heat content may be calculated.

The ocean heat content is proportional to the area bounded by the 26ºC line on the left and the temperature profile on the right (where the ocean temperature exceeds 26ºC).
4.6 Calculating Ocean Heat Content
To determine the ocean heat content, we first calculate the shaded area in the graph. To do this we integrate the temperature above 26ºC (T – 26) from the surface (z=0) down to the water depth where the ocean temperature falls below 26ºC, which we call Z26.
We then multiply that by the density (ρ) and specific heat (Cp) of seawater to arrive at the ocean heat content (QH). The units of ocean heat content are energy per area, commonly given in kiloJoules per centimeter squared (kJ/cm2).
![]()
4.7 Data Examples
This image shows sea surface temperatures on August 10th, 2005.
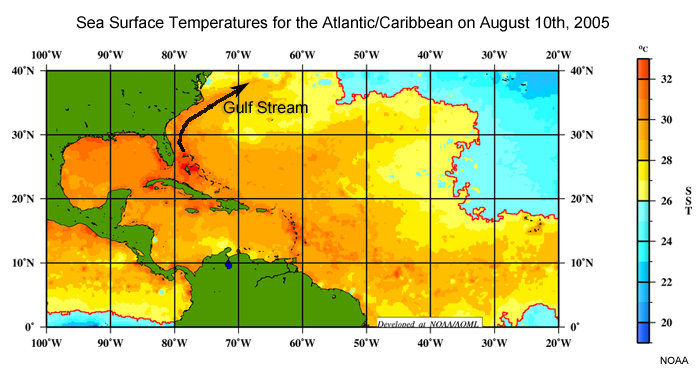
Sea surface temperatures above 26ºC (shown in orange and red) cover most of the western Atlantic south of 35N. (1) We can see the Gulf Stream current. Note the highest sea surface temperatures are in the Gulf of Mexico, Bahamas and south of Cuba.
This image shows the depth of the 26ºC isotherm on August 10th, 2005.
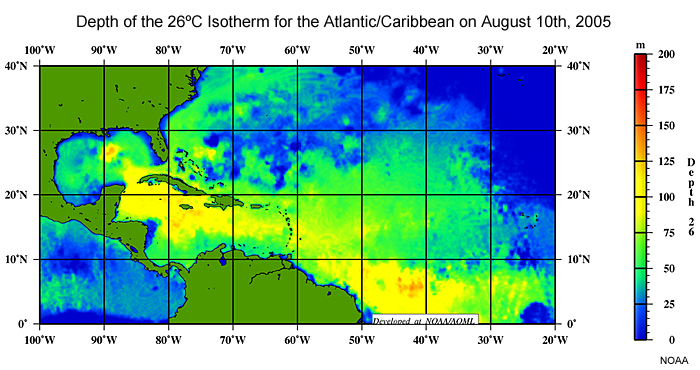
Note the warm water is deepest in the Caribbean, and off the coast of South America. Warm water is shallower in the western Atlantic and along the east coast of the U.S. In the Gulf of Mexico, the 26ºC isotherm is generally not as deep, with the exception of areas associated with the loop current northwest of Cuba and a loop current eddy south of New Orleans. This eddy was shed by the Loop Current, and played an important role in the intensification of Hurricane Katrina.
This image depicts ocean heat content, or OHC.
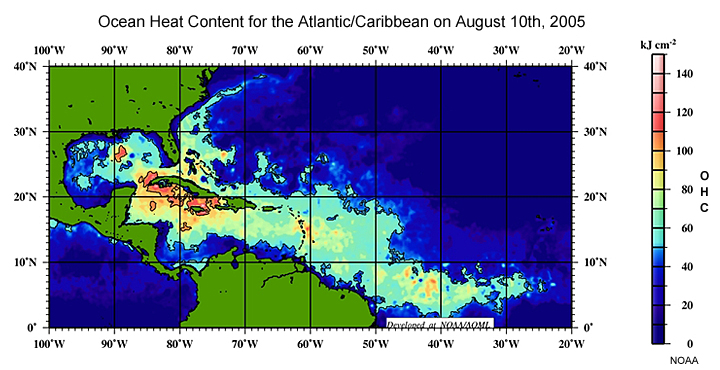
OHC, being the integral of warm water over depth, is highest where sea surface temperatures are high and the 26ºC isotherm is deep. The highest values of OHC are to the south of Cuba – where the depth of the 26ºC isotherm was greatest and sea surface temperatures are very warm.
Although sea surface temperatures in the Gulf of Mexico are high, the OHC values are not as high as values south of Cuba due to the shallowness of the warm water in the Gulf of Mexico. The exception is the eddy to the south of New Orleans, which has a greater depth of warm water, and thus, a higher value of OHC.
Section 5: Saharan Air Layer
5.1 Introduction
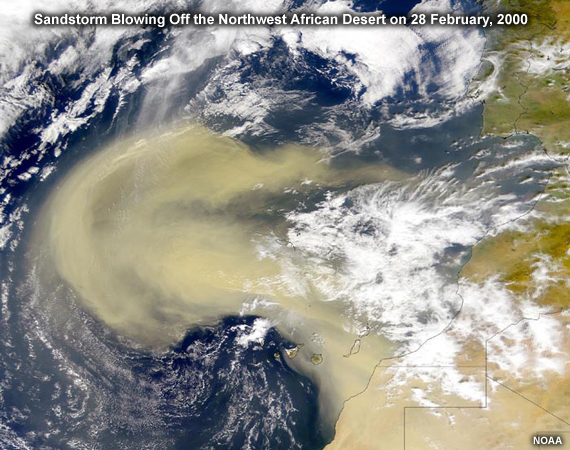
The Saharan Air Layer (or SAL) is a mass of very dry, dusty air which most commonly forms over the Sahara Desert during the late spring, summer, and early fall and usually moves west out over the tropical Atlantic Ocean.
The SAL can cover an area the size of the continental U.S. and has been tracked as far west as the Caribbean Sea and Central America.
This image shows a winter dust storm moving west from Africa. While this dust storm is farther north than the SAL is during the summer, the picture shows the impact dust can have on the atmosphere.
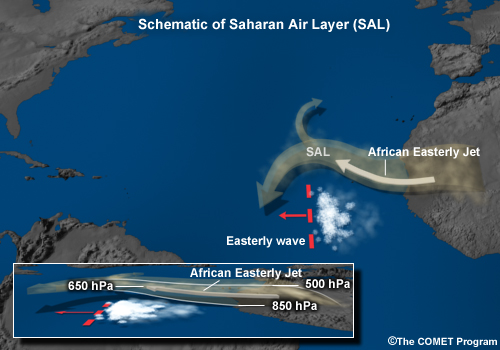
5.2 Structure
Here we see a conceptual model of the SAL. The SAL usually lies between 5,000-20,000 ft (1500-6000 m) or 850 mb/hPa – 500 mb/hPa in the atmosphere and is associated with large amounts of mineral dust.
With regard to tropical cyclones, the most important features are the dry air (~50% less moisture than typical tropical air), and strong winds (~25-55 mph or ~10-25 m/s).
The strong winds on the southern side of the SAL are related to the "African Easterly Jet", or AEJ. AEJ wind speeds maximize at about the 650 mb/hPa level.
5.3 Saharan Air Layer Experiment
Here we see data collected from dropsondes released from the NOAA G-IV high altitude jet aircraft, in association with the first-ever Saharan Air Layer Experiment (SALEX). The dropsonde locations are shown along with the flight path for the experiment. The underlying satellite image shows total precipitable water, with low values in purple and high values in orange.
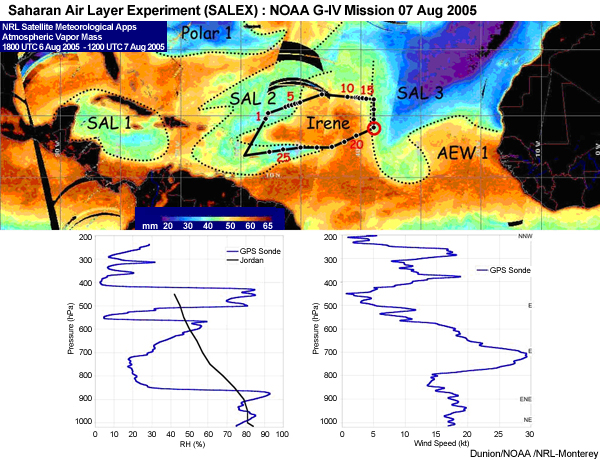
The two vertical profiles show data collected by dropsonde #19 of this SALEX flight. On the left is the plot of relative humidity. Note the significant dry layer of air extending from about 850 mb/hPa up to 600 mb/hPa, with the minimum in relative humidity between 700 and 800 mb/hPa. On the right is a plot of wind speed and direction. Note that in the layer of air in which relative humidity values are lowest, wind speeds are greatest. This area of maximum wind speeds is the African Easterly Jet. Thus, the AEJ and the SAL can be connected.
Additonal Info: http://www.aoml.noaa.gov/hrd/Storm_pages/irene2005/20050807N1.html
5.4 Sounding Studies
A 1958 study by Jordan calculated the average tropical moisture profile. In this early work, Jordan averaged his soundings, making no distinction between SAL and non-SAL air masses. Later studies have indicated the importance of differentiating between these two air masses.
Here we see composite moisture profiles for SAL and non-SAL environments based on data from the 1998 and 20002 Atlantic hurricane seasons.
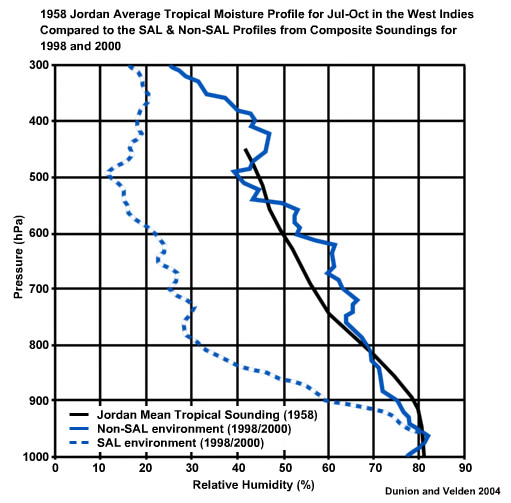
The SAL sounding is significantly drier than the Jordan sounding, while the moist, non-SAL tropical sounding was moister than Jordan, (most notably between 750 and 550 mb/hPa), a bi-modal moisture distribution of moisture is indicated by the data.
5.5 Effects on Tropical Cyclones
Tropical cyclones and other tropical disturbances need mid-level moist air to sustain convection. If the environmental air is dry, then evaporative cooling caused by entrainment of dry air accelerates downdrafts and causes convection to collapse.

Studies show that the SAL weakens tropical cyclones and other tropical disturbances. The dry air of the SAL inhibits updrafts in the storm, while its strong winds increase the vertical wind shear.
Thus the SAL can disrupt the ability of tropical disturbances to concentrate active convection near the center of circulation.
Winds within the SAL at 650 700 hPa are approximately 10-15 knots stronger than the winds at 850 hPa. This difference results in a low level vertical wind shear that, like dry air, inhibits deep convection. As for the dust, it is not yet clear how dust affects tropical cyclone intensity, though some studies suggest it may also impede intensification by warming, and thus stabilizing the SAL layer.
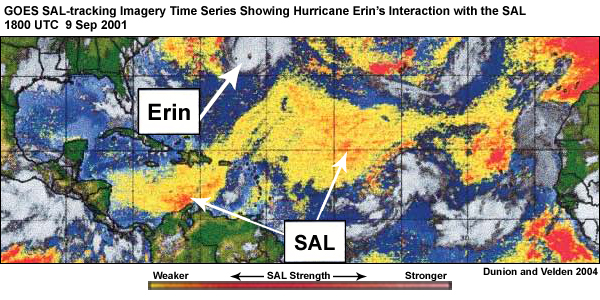
5.6 Hurricane Erin Example
The lifecycle of Hurricane Erin illustrates the impact of the SAL on hurricane intensification.
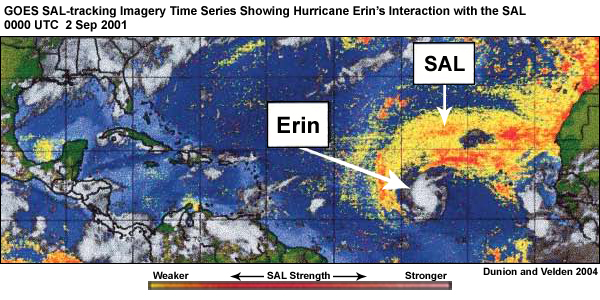
Erin remains weak while it is enveloped by the SAL. Dry air and enhanced vertical wind shear in the SAL kept the tropical cyclone weak and disorganized.
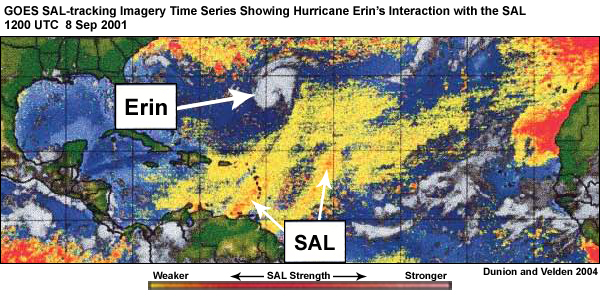
Erin strengthened rapidly after escaping the SAL on September 8th and reached major hurricane status just one day later.
5.7 References
Dunion, J.P., and C.S. Velden, 2004: The impact of the Saharan Air Layer on Atlantic tropical
cyclone activity. Bull. Amer. Meteor. Soc., vol. 85 no. 3, 353-365.
The Large-Scale Movement of Saharan Air Outbreaks over the Northern Equatorial Atlantic, Toby N. Carlson and Joseph M. Prospero, Journal of Applied Meteorology, Volume 11, Issue 2 (March 1972) pp. 283–297
SALEX Mission Summary: Retrieved 12/06.08 from http://www.aoml.noaa.gov/hrd/Storm_pages/irene2005/20050807N1.html
Section 6
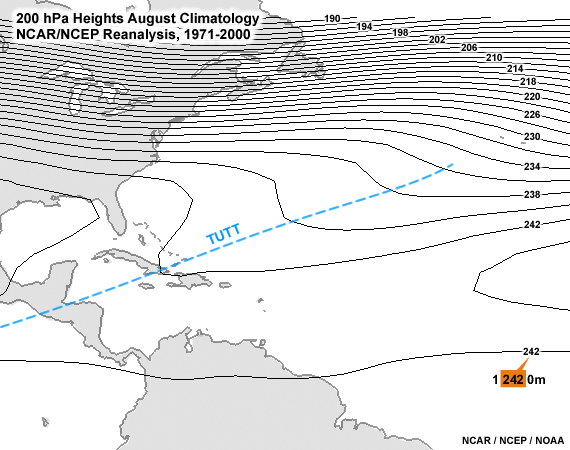
6.1 TUTT Definition and Structure
A Tropical Upper Tropospheric Trough, or TUTT, is an upper atmospheric trough that enhances convection in the tropics. It is semi-permanent summertime feature of the North Atlantic, South Atlantic, North Pacific and South Pacific. A TUTT provides mechanisms that can suppress or support tropical cyclone formation, depending on its location in relationship to the surface circulation.
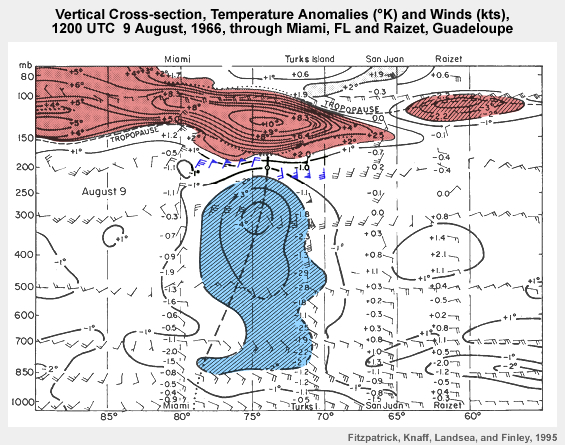
The TUTT is a three-dimensional feature. The height of greatest vorticity and height of the air that is coldest relative to areas around it are not the same. The vorticity maximum is located approximately at 200 mb, while the cold temperature maximum of the TUTT exists at roughly 300 hPa.
6.2 TUTT and Tropical Cyclone Suppression
TUTTs are important for tropical cyclone development and intensification because they can create large amounts of vertical wind shear over tropical cyclones, which can prevent tropical cyclones from forming or inhibit their strengthening when they do form.
To the south of the TUTT, upper level winds are westerly. To the north, the winds are north-easterly. Westerly flow at 200 hPa superimposed over surface easterly tradewind flow will give high wind shear. Therefore, wind shear south of a TUTT axis is usually larger than on the north side of the TUTT.
A tropical disturbance in a deep tropospheric easterly flow (north side of the TUTT) has a greater likelihood for development and intensification, since there is relatively low wind shear. In this way, the location of the TUTT influences the locations where wind shear impacts tropical cyclone formation.
6.3 TUTT and Tropical Cyclone Enhancement
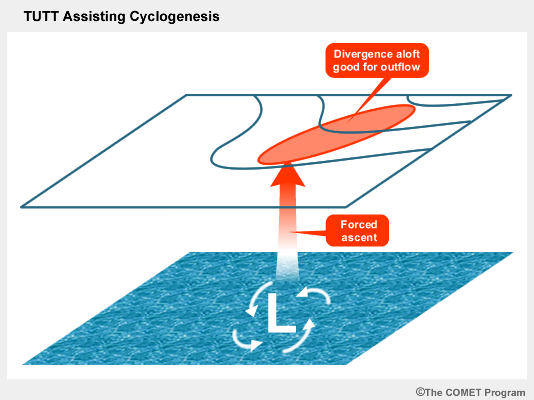
However, there are also suggestions that TUTTs can also promote tropical cyclogenesis and intensification by providing additional forced ascent near the storm center and/or by allowing for an efficient outflow channel in the upper troposphere. In fact, on occasion, a TUTT itself can become cut-off and over time develop into a warm-core tropical cyclone.
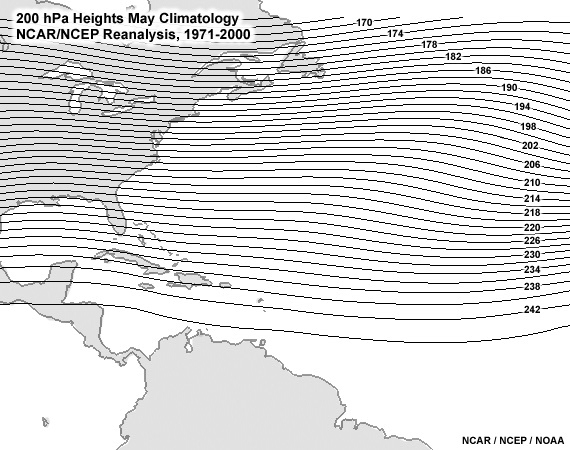
6.4 TUTT Climatology
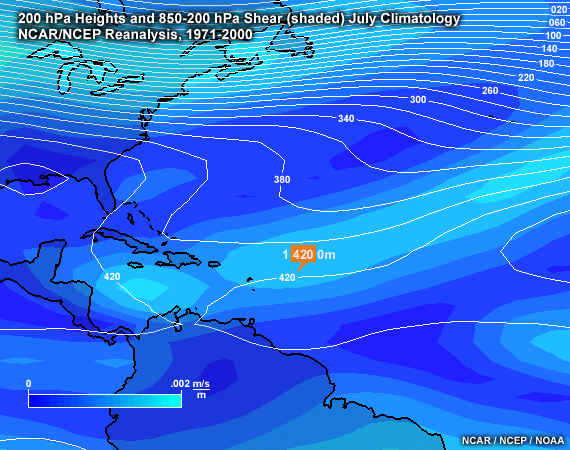
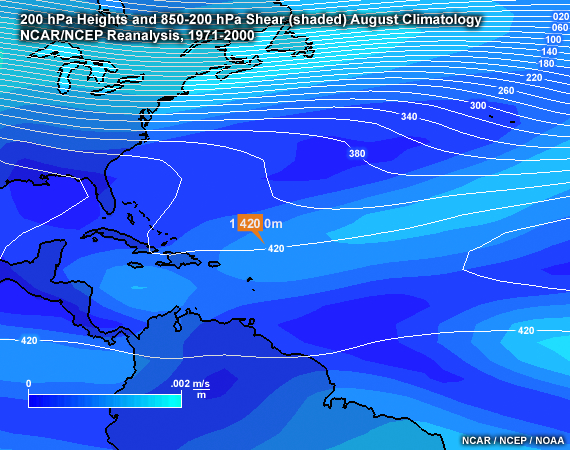
In the North Atlantic, the TUTT first develops in June, strengthens in July and August, and dissipates in September and October. In August, the trough is centered at about 250 hPa, and is positioned from about 35N in the eastern Atlantic to 20N over Cuba.
6.5 References
Fitzpatrick, P. J., J. A. Knaff, C. W. Landsea, S, V. Finley, 1995: Documentation of a Systematic Bias in the Aviation Model's Forecast of the Atlantic Tropical Upper Tropospheric Trough: Implications for Tropical Cyclone Forecasting. Wea. Forecasting, 10, 434-446, (1995)
Contributors
COMET Sponsors
The COMET® Program is sponsored by NOAA National Weather Service (NWS), with additional funding by:
- Air Force Weather (AFW)
- Australian Bureau of Meteorology (BoM)
- European Organisation for the Exploitation of Meteorological Satellites (EUMETSAT)
- Meteorological Service of Canada (MSC)
- National Environmental Education Foundation (NEEF)
- National Polar-orbiting Operational Environmental Satellite System (NPOESS)
- NOAA National Environmental Satellite, Data and Information Service (NESDIS)
- Naval Meteorology and Oceanography Command (NMOC)
Project Contributors
Principal Science Advisors
- Dr. Brian Etherton — University of North Carolina, Charlotte
- Dr. Jeff Weber — Unidata/UCAR
Project Lead/Instructional Design
- Patrick Parrish — UCAR/COMET
Instructional Design
- Dr. Alan Bol — UCAR/COMET
- Lon Goldstein — UCAR/COMET
Graphics/Interface Design
- Steve Deyo — UCAR/COMET
- Brannan McGill — UCAR/COMET
Multimedia Authoring
- Dan Riter — UCAR/COMET
Audio Editing/Production
- Seth Lamos— UCAR/COMET
Audio Narration
- Dr. Greg Byrd — UCAR/COMET
- Hildy Kane — UCAR/COMET
COMET HTML Integration Team 2021
- Tim Alberta — Project Manager
- Dolores Kiessling — Project Lead
- Steve Deyo — Graphic Artist
- Ariana Kiessling — Web Developer
- Gary Pacheco — Lead Web Developer
- David Russi — Translations
- Tyler Winstead — Web Developer
COMET Staff, December 2008
Director
- Dr. Timothy Spangler
Deputy Director
- Dr. Joe Lamos
Administration
- Elizabeth Lessard, Administration and Business Manager
- Lorrie Alberta
- Michelle Harrison
- Hildy Kane
Hardware/Software Support and Programming
- Tim Alberta, Group Manager
- Bob Bubon
- James Hamm
- Ken Kim
- Mark Mulholland
- Wade Pentz, Student
- Jay Shollenberger, Student
- Malte Winkler
Instructional Designers
- Dr. Patrick Parrish, Senior Project Manager
- Dr. Alan Bol
- Lon Goldstein
- Bryan Guarente
- Dr. Vickie Johnson
- Tsvetomir Ross-Lazarov
- Marianne Weingroff
Media Production Group
- Bruce Muller, Group Manager
- Steve Deyo
- Seth Lamos
- Brannan McGill
- Dan Riter
- Carl Whitehurst
Meteorologists/Scientists
- Dr. Greg Byrd, Senior Project Manager
- Wendy Schreiber-Abshire, Senior Project Manager
- Dr. William Bua
- Patrick Dills
- Dr. Stephen Jascourt
- Matthew Kelsch
- Dolores Kiessling
- Dr. Arlene Laing
- Dr. Elizabeth Mulvihill Page
- Amy Stevermer
- Warren Rodie
- Dr. Doug Wesley
Science Writer
- Jennifer Frazer
Spanish Translations
- David Russi
NOAA/National Weather Service - Forecast Decision Training Branch
- Anthony Mostek, Branch Chief
- Dr. Richard Koehler, Hydrology Training Lead
- Brian Motta, IFPS Training
- Dr. Robert Rozumalski, SOO Science and Training Resource (SOO/STRC) Coordinator
- Ross Van Til, Meteorologist
- Shannon White, AWIPS Training
Meteorological Service of Canada Visiting Meteorologists
- Phil Chadwick
- Jim Murtha