Overview of AHI and the Lesson
NOTE: This short lesson is meant to be taken after going through COMET’s GOES-R ABI: Next Generation Satellite Imaging lesson since it provides context and important background information. This is not intended to be a complete or comprehensive lesson!
A new era in environmental satellites began in October 2014 when Japan’s Himawari-8 attained geostationary orbit. The satellite hosts a 16-channel Advanced Himawari Imager (AHI), which provides a preview of the future geostationary imagers to be launched by the United States, China, Korea, and EUMETSAT from 2016 to around 2019.
All of these imagers will have 16 channels, except for China’s Advanced Geostationary Radiation Imager (AGRI), which will have 14. Most of the imagers will provide true color imaging capability, except for the U.S.’ Advanced Baseline Imager (ABI) and China’s AGRI.
The AHI on Himawari images the Earth five times faster than the current MTSAT-2 and GOES 13-15 imagers. It has three times the spectral coverage and a four-fold improvement in spatial resolution.
This brief lesson provides an overview of the AHI on Himawari and highlights its differences from the U.S. GOES-R ABI. The lesson covers the following:
- The improved capabilities in spectral coverage, spatial resolution, and imaging interval of the AHI over the predecessor MTSAT-2 imager
- The differences in spectral coverage and scan strategy between AHI and GOES-R ABI, and the impact on products
- How AHI data and products will benefit forecasters in the Alaska region, Pacific Region, and CONUS (Contiguous United States)
AHI Channels
The table shows the AHI channels and their central wavelengths, spatial resolution at satellite subpoint, and sample uses. Click the tab to compare them to the ABI channels.
| Himawari AHI Channels: Summary of Wavelengths, Resolutions, and Sample Uses | ||||
| Channels | Central Wavelength (µm) | Nominal Subsat. IGFOV / Resolution (km) | Sample Uses | |
|---|---|---|---|---|
| Vis | 1 | 0.47 | 1 | Daytime aerosols over land, coastal water mapping |
| 2 | 0.51 | 1 | Water/ocean color, including detection of algal blooms; enables true color imagery when combined with blue and red channels (Vis channels 1 and 3) | |
| 3 | 0.64 | 0.5 | Daytime cloud, fog, insolation, winds | |
| Near-IR | 4 | 0.86 | 1 | Daytime vegetation, burn scars, aerosols over water, winds |
| 5 | 1.6 | 2 | Daytime cloud-top phase and particle size, snow | |
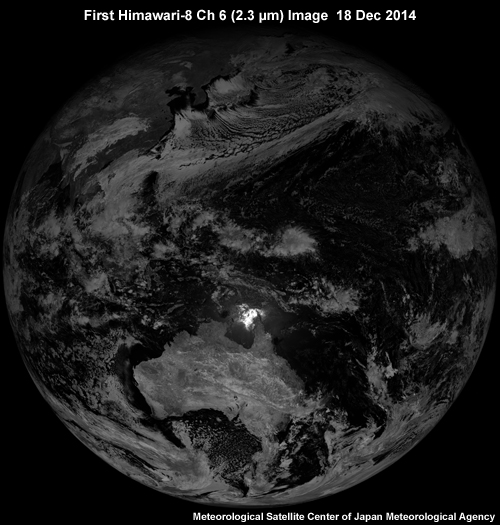
| 6 | 2.3 | 2 | Daytime land/cloud properties, particle size, vegetation, snow | |
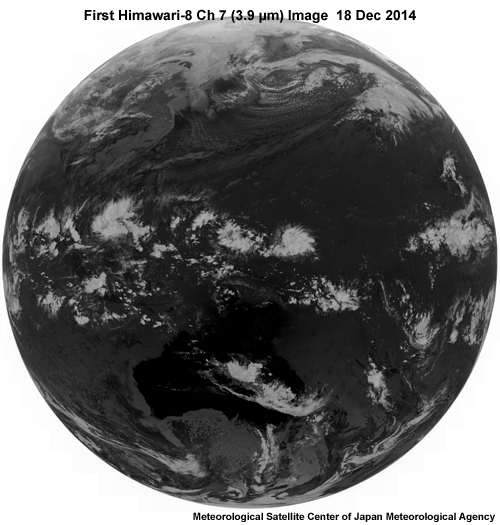
| SW IR | 7 | 3.9 | 2 | Surface and cloud, fog at night, fire, winds |
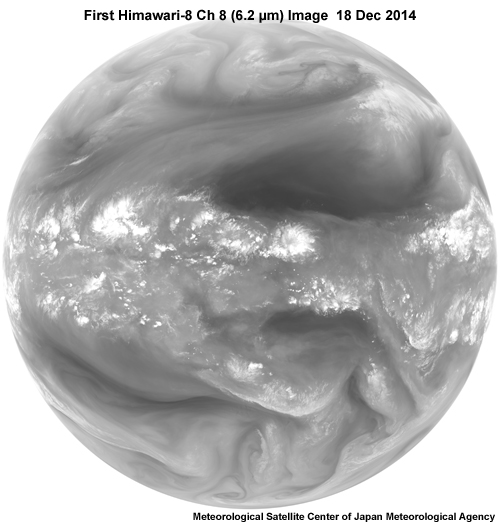
| IR (WV) | 8 | 6.2 | 2 | High-level atmospheric water vapor, winds, rainfall |
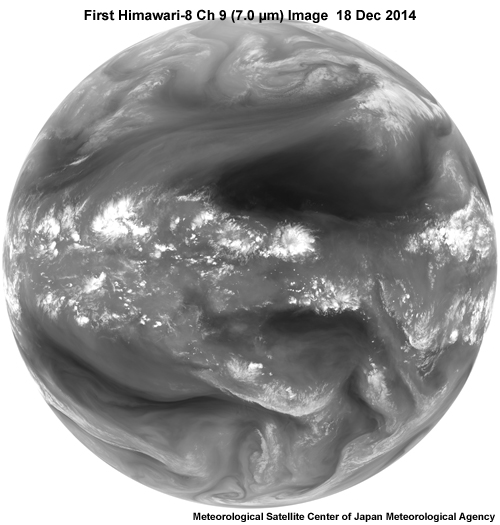
| 9 | 6.9 | 2 | Mid-level atmospheric water vapor, winds, rainfall | |
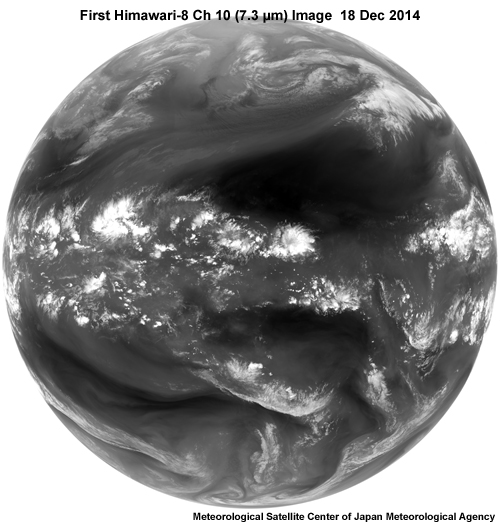
| 10 | 7.3 | 2 | Lower-level water vapor, winds, SO2 | |
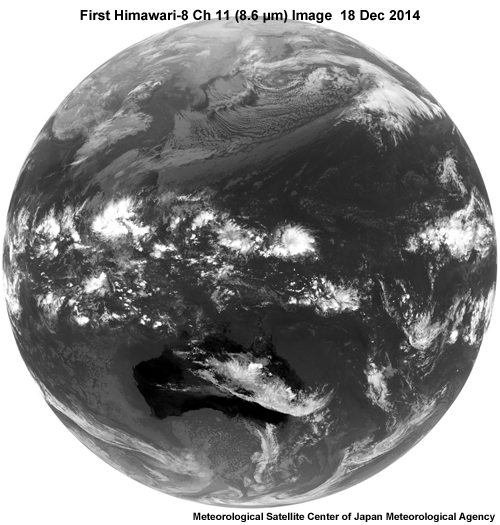
| LW IR | 11 | 8.6 | 2 | Total water for stability, cloud phase, dust, SO2, rainfall |
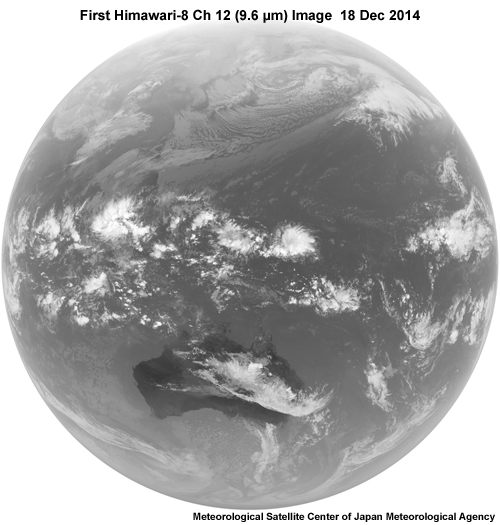
| 12 | 9.6 | 2 | Total column ozone, turbulence, winds | |
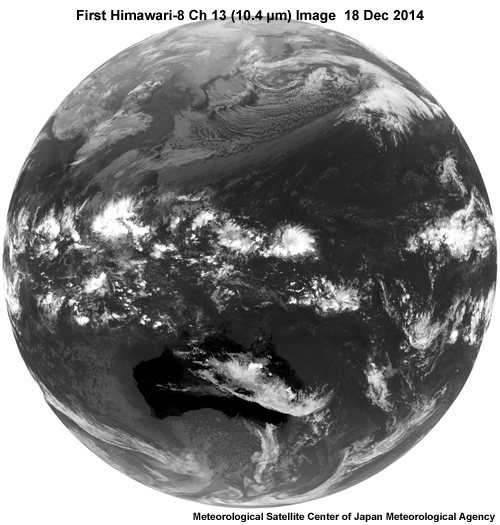
| 13 | 10.4 | 2 | Surface and cloud | |
| 14 | 11.2 | 2 | Imagery, sea surface temperature (SST), clouds, rainfall | |
| 15 | 12.4 | 2 | Total column water vapor, ash, SST | |
| 16 | 13.3 | 2 | Air temperature, cloud heights and amounts | |
| SW: Shortwave LW: Longwave WV: Water vapor IGFOV: Instantaneous Geometric Field Of View | ||||
| GOES-R ABI Channels: Summary of Wavelengths, Resolutions, and Sample Uses | ||||
| Channels | Central Wavelength (µm) | Nominal Subsat. IGFOV / Resolution (km) | Samples Uses | |
|---|---|---|---|---|
| Vis | 1 | 0.47 | 1 | Daytime aerosols over land, coastal water mapping |
| 2 | 0.64 | 0.5 | Daytime clouds, fog, insolation, winds | |
| Near-IR | 3 | 0.865 | 1 | Daytime vegetation / burn scar and aerosol over water, winds |
| 4 | 1.378 | 2 | Daytime cirrus cloud | |
| 5 | 1.61 | 1 | Daytime cloud-top phase and particle size, snow | |
| 6 | 2.25 | 2 | Daytime land/cloud properties, particle size, vegetation, snow | |
| SW IR | 7 | 3.90 | 2 | Surface and cloud, fog at night, fire, winds |
| IR (WV) | 8 | 6.19 | 2 | High-level atmospheric water vapor, winds, rainfall |
| 9 | 6.95 | 2 | Mid-level atmospheric water vapor, winds, rainfall | |
| 10 | 7.34 | 2 | Lower-level water vapor, winds, SO2 | |
| LW IR | 11 | 8.5 | 2 | Total water for stability, cloud phase, dust, SO2, rainfall |
| 12 | 9.61 | 2 | Total ozone, turbulence, winds | |
| 13 | 10.35 | 2 | Surface and cloud | |
| 14 | 11.2 | 2 | Imagery, sea surface temperature (SST), clouds, rainfall | |
| 15 | 12.3 | 2 | Total water, ash, SST | |
| 16 | 13.3 | 2 | Air temperature, cloud heights and amounts | |
| SW: Shortwave LW: Longwave WV: Water vapor IGFOV: Instantaneous Geometric Field Of View | ||||
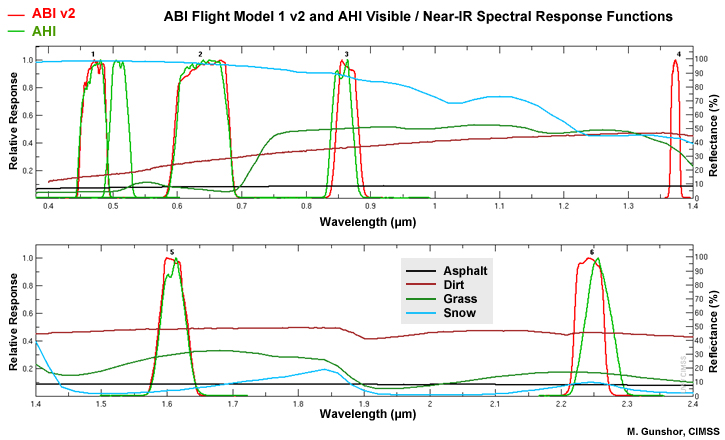
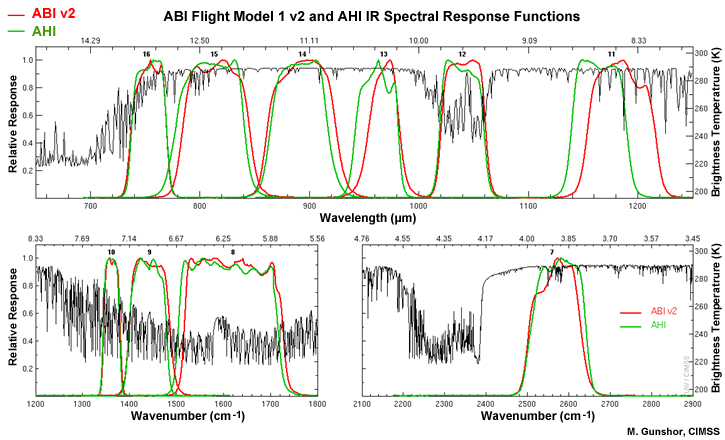
The images below show the spectral response functions (SRFs) for both the ABI and AHI channels. While there are some differences, for the most part the SRFs for the 15 common channels are very similar.
Himawari-8 Coverage
Himawari-8 is located at the equator and 140° E longitude. The imager provides full disk data and imagery every 10 minutes, two sectors over Japan every 2.5 minutes, and one moveable typhoon targeted area every 2.5 minutes.

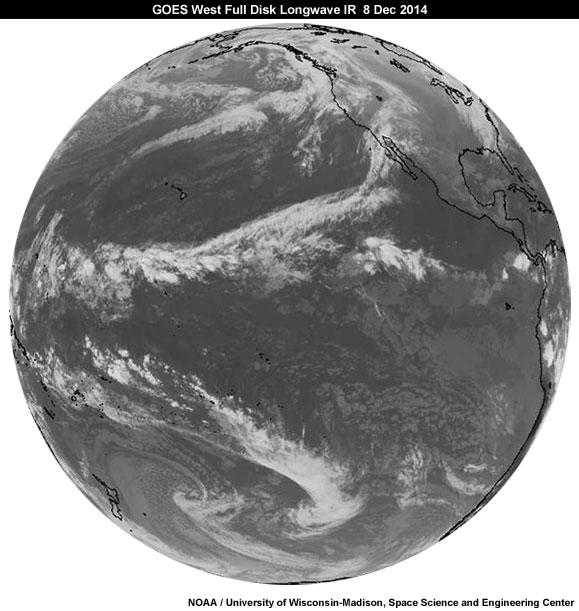
Himawari-8 provides good upstream coverage of the GOES-West viewing area, allowing forecasters to track storms from the Western Pacific toward Alaska and the Northwest contiguous U.S. (CONUS). Click the tabs to compare the viewing areas of Himawari-8 and GOES-West.
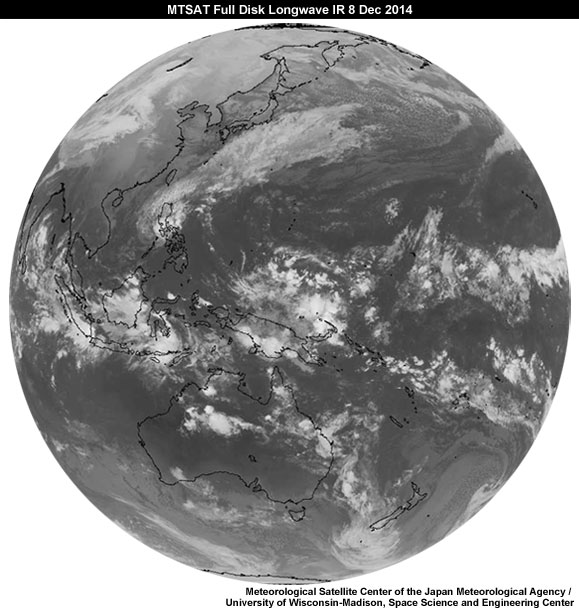
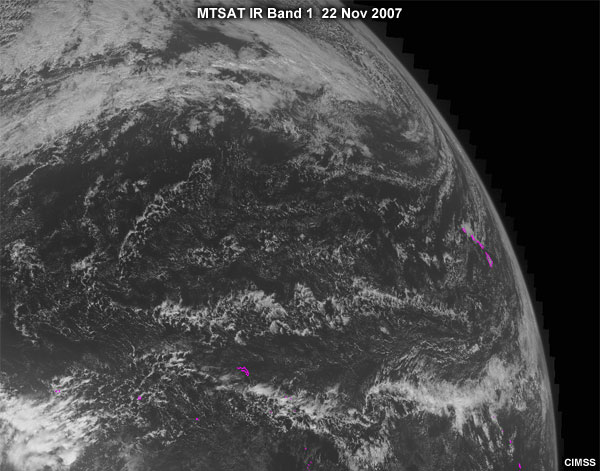
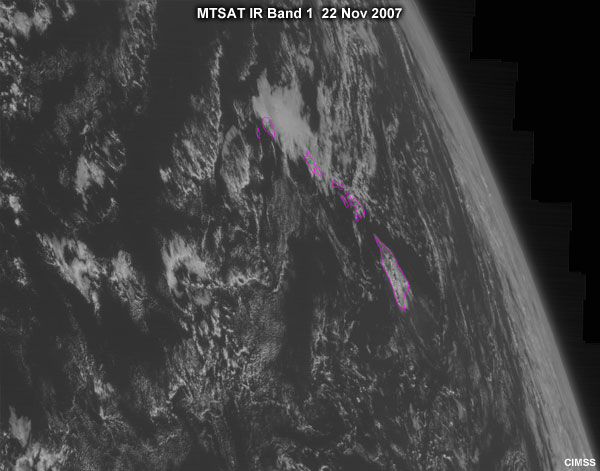
The following MTSAT-1R images illustrate AHI's geographical coverage over the Hawaiian Islands. The first image shows the larger-scale coverage, while the second zooms in over the Hawaiian islands.
AHI Data and Products
Himawari-8 does not carry equipment for direct dissemination of data and imagery. Rather, all imagery (full spatial and temporal resolution) is distributed via an Internet cloud service (also known as HimawariCloud).
Beginning in January 2015, a subset of the 16 channels, shown in the first table, is being disseminated at reduced resolution (1 km Vis and 4 km IR) via a communications satellite using Digital Video Broadcast (DVB-S2). This service is known as HimawariCast and replaces the MTSAT High-Rate Information Transmission (HRIT) and Low-Rate Information Transmission (LRIT) services.
The core imagery data of the HimawariCast service consists of High Resolution Information Transmission (HRIT) files, which are compatible with the predecessor MTSAT series HRIT service. While MTSAT-2 remains operational (until about mid-2015), these files feature 5 Himawari-8 channels (1 Vis, 4 IR) similar to the current MTSAT-2 imager channels, and are disseminated every 10 minutes.
| Initial (Through Mid-2015) HimawariCast Himawari-8 AHI 5-Channel Set | ||||
| Channels | Central Wavelength (µm) | Nominal Subsat. IGFOV / Resolution (km) | Sample Uses | |
|---|---|---|---|---|
| Vis | 3 | 0.64 | 1 | Daytime vegetation / burn scar and aerosols over water, winds |
| SW IR | 7 | 3.9 | 4 | Surface and cloud, fog and low clouds at night, fire, winds |
| IR (WV) | 8 | 6.2 | 4 | High-level atmospheric water vapor, winds, rainfall |
| LW IR | 13 | 10.4 | 4 | Surface and cloud |
| 15 | 12.4 | 4 | Total column water vapor, ash, SST | |
| SW: Shortwave LW: Longwave WV: Water vapor IGFOV: Instantaneous Geometric Field Of View | ||||
The JMA (Japanese Meteorological Agency) will increase the number of channels in the HimawariCast service to 14 out of the original 16, beginning mid-2015 when it's planned for Himawari-8 to take over operational service from MTSAT-2.
The 14 imager channels, shown in this next table, will be disseminated at 10 minute intervals and the spatial resolution will be at the reduced 1 km for visible and 4 km for infrared.
| HimawariCast Himawari-8 AHI Expanded 14-Channel Set (Beginning Mid-2015) | ||||
| Channels | Central Wavelength (µm) | HimawariCast Resolution (km) | Sample Uses | |
|---|---|---|---|---|
| Vis | 3 | 0.64 | 1 | Daytime cloud, fog, insolation, winds |
| Near-IR | 4 | 0.86 | 4 | Daytime vegetation, burn scars, aerosols over water, winds |
| 5 | 1.6 | 4 | Daytime cloud-top phase and particle size, snow | |
| 6 | 2.3 | 4 | Daytime land/cloud properties, particle size, vegetation, snow | |
| SW IR | 7 | 3.9 | 4 | Surface and cloud, fog at night, fire, winds |
| IR (WV) | 8 | 6.2 | 4 | High-level atmospheric water vapor, winds, rainfall |
| 9 | 6.9 | 4 | Mid-level atmospheric water vapor, winds, rainfall | |
| 10 | 7.3 | 4 | Lower-level water vapor, winds, SO2 | |
| LW IR | 11 | 8.6 | 4 | Total water for stability, cloud phase, dust, SO2, rainfall |
| 12 | 9.6 | 4 | Total column ozone, turbulence, winds | |
| 13 | 10.4 | 4 | Surface and cloud | |
| 14 | 11.2 | 4 | Imagery, sea surface temperature (SST), clouds, rainfall | |
| 15 | 12.4 | 4 | Total column water vapor, ash, SST | |
| 16 | 13.3 | 4 | Air temperature, cloud heights and amounts | |
| SW: Shortwave LW: Longwave WV: Water vapor IGFOV: Instantaneous Geometric Field Of View | ||||
Each nation has one access link via the HimawariCloud service to the full 16-channel dataset (full spatial and temporal resolution) and products. NESDIS is the access point for the U.S. and will be the dissemination point for all U.S. interests.
In addition to the AHI, Himawari-8 and -9 also host a Data Collection Service (DCS) and a Space Environmental Data Acquisition Monitor (SEDA) that monitors electron flux density and proton integral directional flux for space weather applications. Unlike the GOES-R series, Himawari does not have a Geostationary Lightning Mapper (GLM).
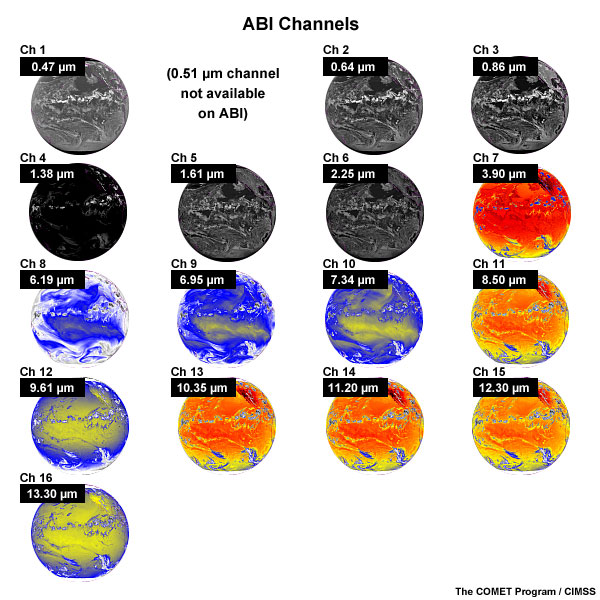
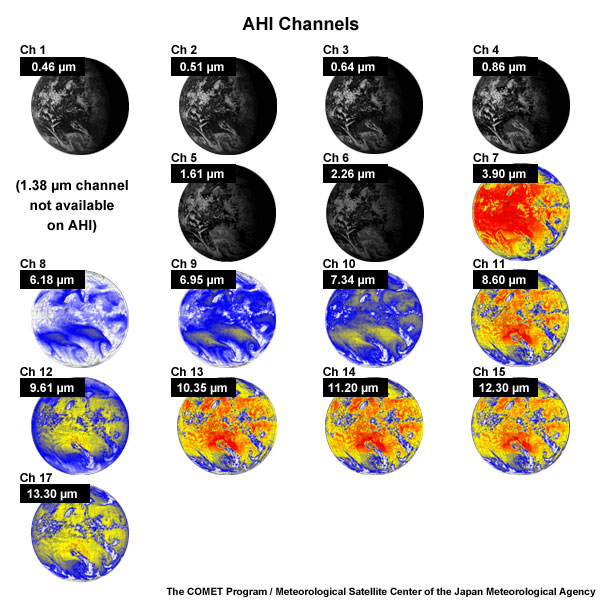
Comparing ABI and AHI Channels
Move the slider on the image to compare the ABI and AHI channels. As you can see, the imagers have very similar sets of channels. The primary differences are that AHI has a 0.51 micrometer green channel but does not have the 1.378 µm near infrared channel, which is typically used for cirrus detection.
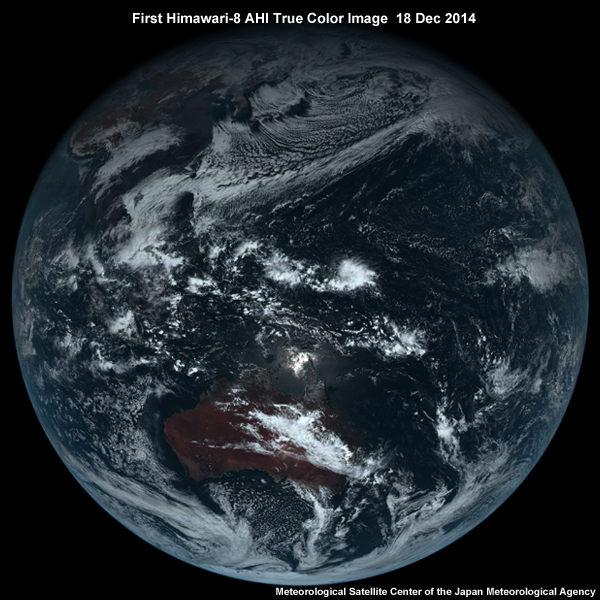
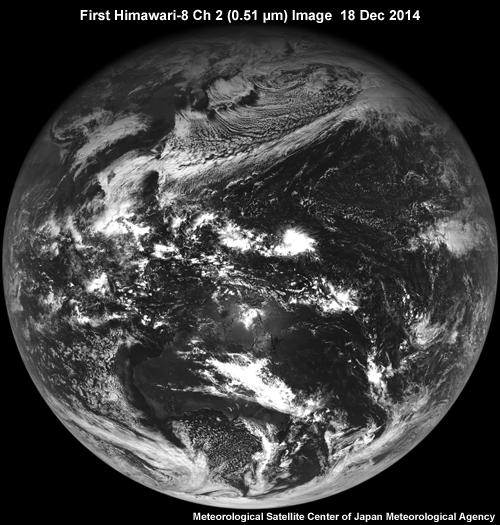
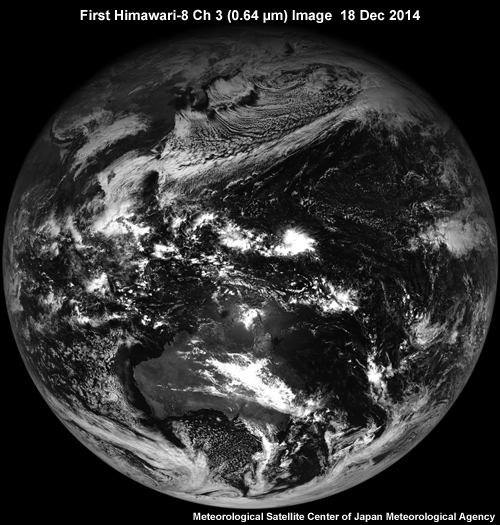
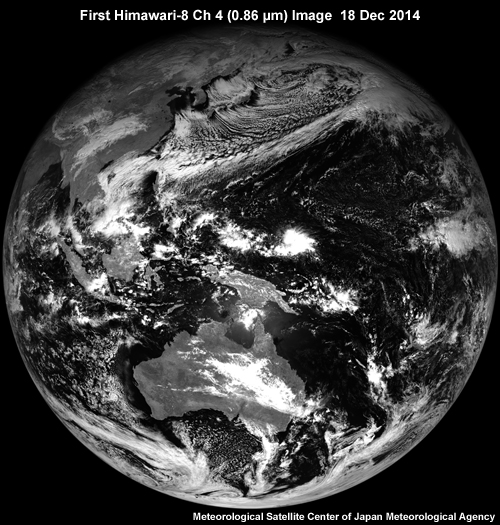
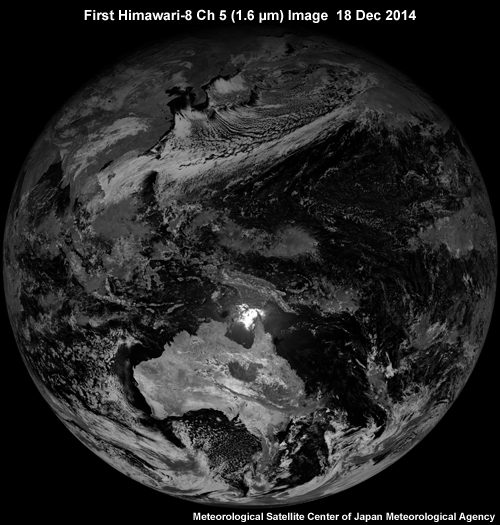
AHI’s three visible channels at 0.46, 0.51, and 0.64 µm enable the production of true color imagery. The image below is the first AHI true color image. Since the GOES-R ABI will not have a green channel, direct true color images will not be possible.
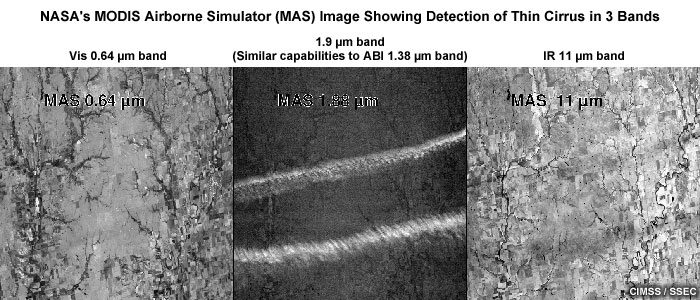
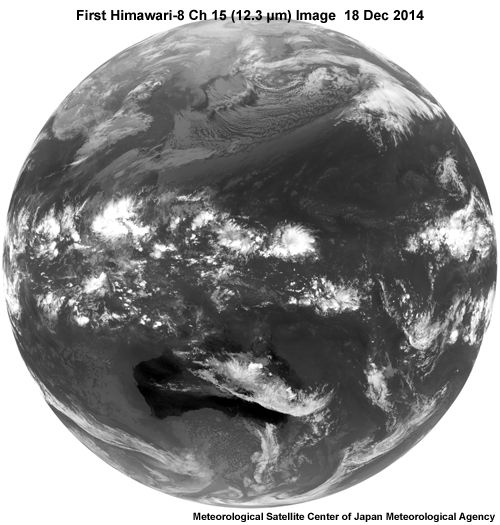
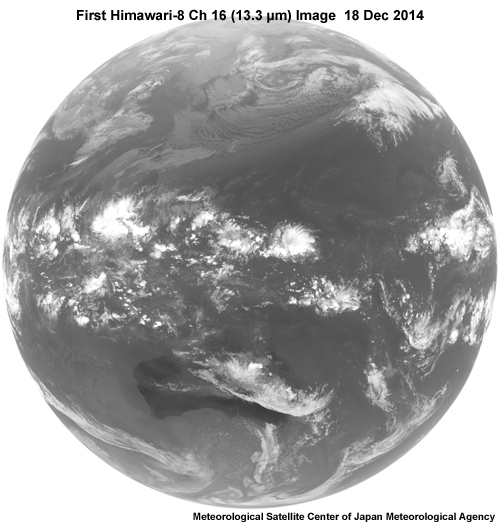
Unlike ABI, AHI will not have the 1.378 µm channel, which is centered in a strong water vapor absorption spectral region for detecting very thin cirrus clouds during the day. Using the 11.2 and 13.3 µm channels, AHI will still be able to detect all but the very thinnest cirrus. The graphic below shows an example of thin cirrus in a 1.9 µm image, which has similar characteristics to the 1.378 µm channel. You can see how difficult it is to detect thin cirrus in conventional visible and IR imagery.
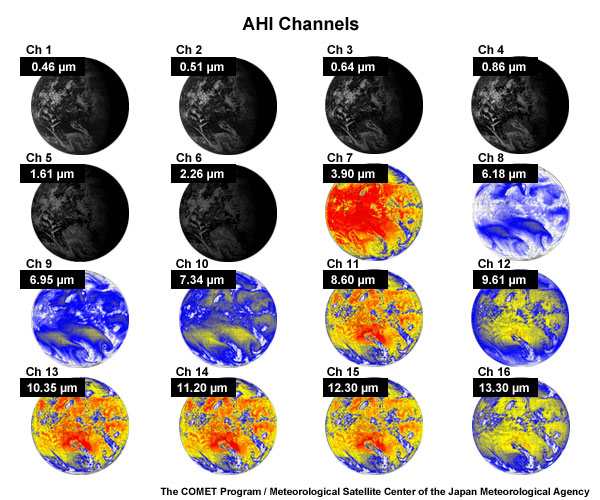
AHI Channels and Applications
Click each image on the graphic for a description of the channel and the applications that it supports and early examples of the imagery.

In addition to the imagery from the 16 AHI channels, JMA plans to produce the following initial product set:
- True color imagery
- Cloud mask
- Cloud type and phase
- Cloud top height
- Atmospheric motion vectors
- Volcanic ash
- Aerosol (includes dust)
AHI Benefits to Trans-Pacific Weather Forecasting
Although forecasters in East Asia and the western Pacific reap the full benefits of AHI, those in the central Pacific, Alaska, and Continental U.S. benefit from AHI data and products as well.
Since weather systems move primarily from west to east at mid-latitudes, providing improved radiances and cloud and moisture-drift winds over East Asia and the western and central Pacific leads to better long-range numerical weather prediction (NWP) forecasts for systems moving into the eastern Pacific and approaching Alaska and the CONUS.
AHI’s improved spatial resolution provides better targets for the generation of atmospheric motion vectors (AMVs). Its extra channels also improve the definition of the height assignments of AMVs.
Velden has shown that increasing the temporal refresh rate from 15 to 5 minutes on the regional scale and even finer on the mesoscale leads to enhanced AMVs and improved forecasts of tropical cyclones. Says Velden, “GOES-R AMVs (5 minutes over CONUS and 1 minute over smaller regions) will be an important contributor to mesoscale analyses based upon recent studies using proxy rapid-scan datasets occasionally made available from the current GOES.”
As to the impact of improved initial analyses of tropical cyclones and their near storm environment, Veldon states that “Accurately specifying the initial conditions in terms of vortex structure and environmental wind flows affecting (the tropical cyclone) is paramount to achieving superior predictions of track and intensity.
The following examples illustrate the value of improved temporal refresh rates for generating AMVs.
The first graphic shows AMVs generated from routine processing using 15-minute interval imagery. Compare the number of wind vectors to those on the second graphic, which were generated using 4-minute interval rapid scan imagery.
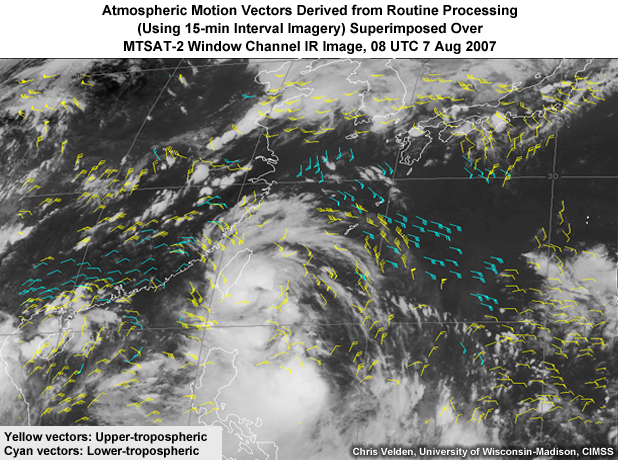
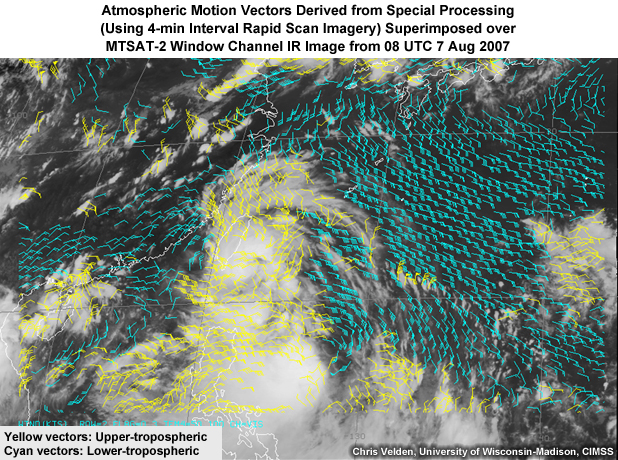
Notice the difference in detail in the divergence fields generated from routine winds (first graphic) vs. rapid scan winds (second graphic).
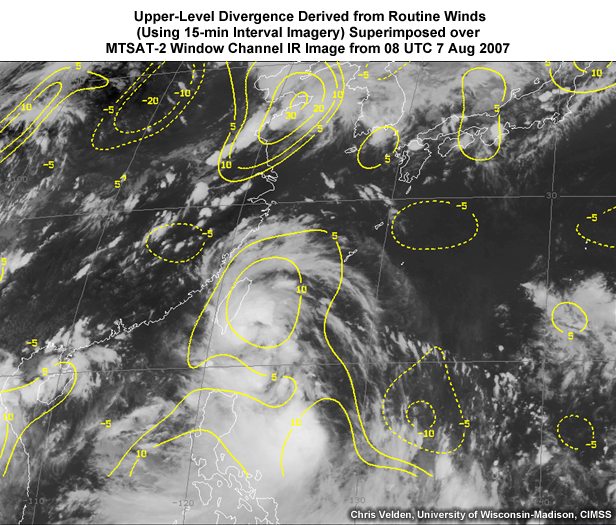
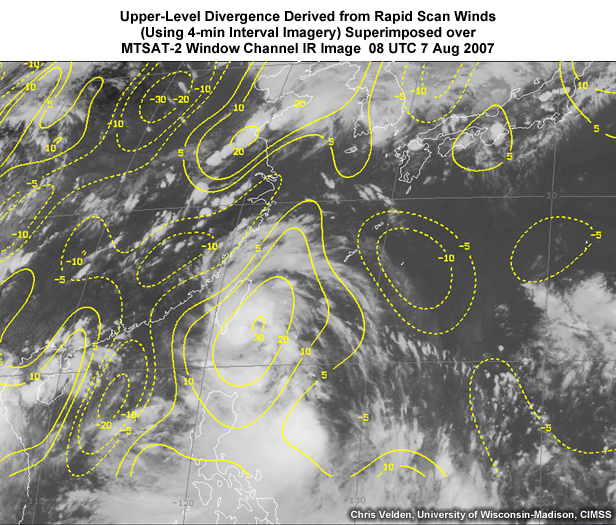
Based on these types of comparisons, we can reasonably conclude that improving the full disk temporal refresh rate on AHI to 10 minutes leads to much better AMVs than those derived from today's 30-minute full disk refresh rate. Improved observing capability and impact on NWP model performance should result in better forecasts for tropical cyclones, trans-Pacific aviation and marine routes as well as long-range forecasting for Alaska and CONUS.
In summary, you have seen a quick overview of the capabilities of the AHI on the Himawari-8 and -9 spacecraft, and a preview of the next generation geostationary imagers that should encircle the globe by 2019, revolutionizing the way we observe and forecast the weather.
You have reached the end of this lesson. Please consider taking the quiz and providing a User Survey.
References
Miller, Steven D.; Schmidt, Christopher C.; Schmit, Timothy J. and Hillger, Donald W. A case for natural colour imagery from geostationary satellites, and an approximation for the GOES-R ABI. International Journal of Remote Sensing, 33 (13), 2012, 3999-4028.
Schmit, Timothy J.; Goodman, Steven J.; Lindsey, Daniel T.; Rabin, Robert M.; Bedka, Kristopher M.; Gunshor, Mathew M.; Cintineo, John L.; Velden, Christopher S.; Bachmeier, A. Scott; Lindstrom, Scott S. and Schmidt, Christopher C. Geostationary Operational Environmental Satellite (GOES)-14 super rapid scan operations to prepare for GOES-R. Journal of Applied Remote Sensing, 7 (1), 2013, doi:10.1117/1.JRS.7.073462.
Goodman, Steven J.; Gurka, James; DeMaria, Mark; Schmit, Timothy J.; Mostek, Anthony; Jedlovec, Gary; Siewert, Chris; Feltz, Wayne; Gerth, Jordan; Brummer, Renate; Miller, Steven; Reed, Connie and Reynolds, Richard R. The GOES-R Proving Ground: Accelerating user readiness for the next-generation geostationary environmental satellite system. Bulletin of the American Meteorological Society, 93 (7), 2012, 1029–1040.
Lindsey, Daniel T.; Schmit, Timothy J.; MacKenzie, Wayne M. Jr.; Jewett, Christopher P.; Gunshor, Mat M. and Grasso, Louie. 10.35 micrometer: Atmospheric window on the GOES-R Advanced Baseline imager with less moisture attenuation. Journal of Applied Remote Sensing, 6 (1), 2012, doi:10.1117/1.JRS.6.063598.
Schmit, Timothy J.; Gunshor, Mathew M.; Menzel, W. Paul; Gurka, James J.; Li, Jun and Bachmeier, A. Scott. Introducing the next-generation Advanced Baseline Imager on GOES-R. Bulletin of the American Meteorological Society, 86 (8), 2005, 1079-1096.
Velden, C. S., J. Daniels, D. Stettner, D. Santek, J. Key, J. Dunion, K. Holmlund, G. Dengel, W. Bresky, and P. Menzel, 2005: Recent Innovations in Deriving Tropospheric Winds from Meteorological Satellites. Bull. Amer. Meteor. Soc., 86, 205-223.
Wu, Ting-Chi, H. Liu, S. J. Majumdar, C. S. Velden, and J. L. Anderson, 2014: Influence of assimilating satellite-derived atmospheric motion vector observations on numerical analyses and forecasts of tropical cyclone track and intensity. Mon. Wea. Rev., 142 (1), 49-71.
Additional Resources
Meteorological Satellites - Japan Meteorological Agency (JMA)
Meteorological Satellite Center (MSC) of Japan Meteorological Agency (JMA)
http://rammb.cira.colostate.edu/ramsdis/online/himawari-8.asp (RAMSDIS Online shows Himiwari-8 Imagery courtesy of the Japanese Meteorological Agency. Single channel imagery are available as well as various RGB combinations for select areas. Imagery and products displayed will (likely) change over time.)
Contributors
COMET Sponsors
The COMET® Program is sponsored by NOAA's National Weather Service (NWS), with additional funding by:
- Bureau of Meteorology of Australia (BoM)
- Bureau of Reclamation, United States Department of the Interior
- European Organisation for the Exploitation of Meteorological Satellites (EUMETSAT)
- Meteorological Service of Canada (MSC)
- NOAA's National Environmental Satellite, Data and Information Service (NESDIS)
- NOAA's National Geodetic Survey (NGS)
- Naval Meteorology and Oceanography Command (NMOC)
- U.S. Army Corps of Engineers (USACE)
Project Contributors
Senior Project Manager
- Wendy Abshire — UCAR/COMET
Project Lead / Instructional Design
- Marianne Weingroff — UCAR/COMET
Principal Science Advisors
- James Gurka — Retired NOAA
- Patrick Dills — UCAR/COMET
Additional Science Advisors
- Mat Gunshor — University of Wisconsin-Madison, CIMSS
- Tim Schmit — NOAA NESDIS STAR/ASPB @ CIMSS
- Chris Velden — University of Wisconsin-Madison, CIMSS
- Bill Ward — National Weather Service
Graphics/Animations
- Steve Deyo — UCAR/COMET
- Marianne Weingroff — UCAR/COMET
Multimedia Authoring/Interface Design
- Gary Pacheco — UCAR/COMET
- Marianne Weingroff — UCAR/COMET
COMET Staff, Winter 2014
Director's Office
- Dr. Rich Jeffries, Director
- Dr. Greg Byrd, Deputy Director
- Lili Francklyn, Business Development Specialist
Business Administration
- Dr. Elizabeth Mulvihill Page, Group Manager
- Lorrie Alberta, Administrator
- Hildy Kane, Administrative Assistant
IT Services
- Tim Alberta, Group Manager
- Bob Bubon, Systems Administrator
- Dolores Kiessling, Software Engineer
- Joey Rener, Student Assistant
- Malte Winkler, Software Engineer
Instructional and Media Services
- Bruce Muller, Group Manager
- Dr. Alan Bol, Scientist/Instructional Designer
- Steve Deyo, Graphic and 3D Designer
- Lon Goldstein, Instructional Designer
- Bryan Guarente, Instructional Designer
- Vickie Johnson, Instructional Designer (Casual)
- Gary Pacheco, Web Designer and Developer
- Tsvetomir Ross-Lazarov, Instructional Designer
- David Russi, Spanish Translations
- Andrea Smith, Meteorologist/Instructional Designer
- Marianne Weingroff, Instructional Designer
Science Group
- Wendy Schreiber-Abshire, Group Manager
- Dr. William Bua, Meteorologist
- Dr. Frank Bub, Oceanographer (Casual)
- Lis Cohen, Meteorologist (Casual)
- Patrick Dills, Meteorologist
- Matthew Kelsch, Hydrometeorologist
- Nicolas Major, Visiting Meteorologist, Meteorological Services of Canada
- Dr. Elizabeth Mulvihill Page, Meteorologist
- Amy Stevermer, Meteorologist
- Vanessa Vincente, Visiting Meteorologist, CIRA/Colorado State University