Produced by The COMET® Program
Introduction and Case Profile
The case focuses on squall lines that affected Jamaica on 28 September during the formation of Tropical Depression #16, which became Tropical Storm Nicole. The emphasis is on identification of features in the radar imagery that are associated with weather hazards such as high winds, tornadoes, heavy rain, and flash floods. The hazards to aviation are explored for each phenomenon that is reviewed.
Case Timeframe
28 September - 29 September 2010
Phenomena of Interest
Squall lines, bow echo, tornadoes, damaging surface winds, heavy rainfall and flash flooding
Forecasting Challenges
Forecasters need to recognize the key synoptic ingredients that can lead to the development of squall lines; identify signals in the radar and satellite imagery that can be associated with these systems; and identify mesoscale and convective scale severe weather signatures in the radar imagery. The latter will be achieved with the use of conceptual models and real examples.
Geography
The island of Jamaica is in the northwest Caribbean (Fig. 1). It has a mountainous interior with maximum elevation of 2256 meters.

Fig. 1. Map of Jamaica with elevation, cities, and towns affected by severe weather.
The Doppler radar of the National Meteorological Service is located in the hills above Kingston and its short-range coverage of 180 km covers the entire island and the Pedro Cays (Fig. 2).
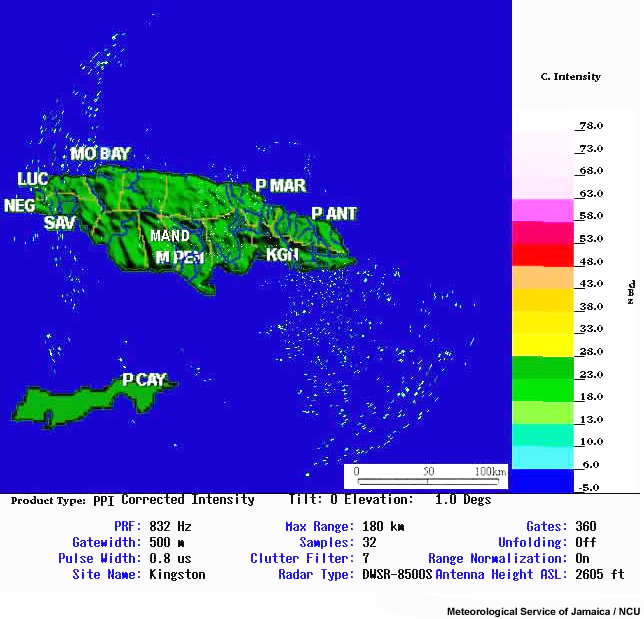
Fig. 2. Short range radar map with towns, parish boundaries (gold), and major rivers (dark blue). Radar map is courtesy of the National Meteorological Service of Jamaica.
Characteristics of Tropical Depressions
September is the peak month for tropical cyclone activity in the Atlantic and Caribbean. However, tropical cyclone landfall is rare for a single country. Far more prevalent are the precursor disturbances, such as easterly waves or developing tropical depressions, which bring heavy rain and severe weather to the Caribbean.
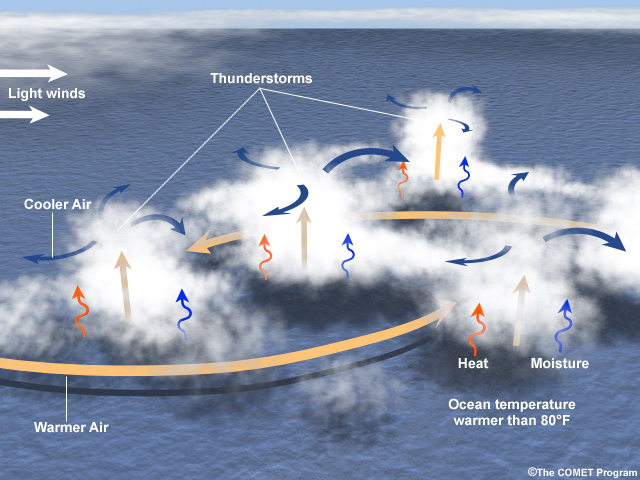
Fig. 3. Conceptual model of the circulation and thunderstorm systems of a tropical depression.
The typical incipient tropical depression has a broad surface low, weak vertical shear, and ridging or high pressure aloft. Developing tropical depressions are comprised of multicellular thunderstorm systems called mesoscale convective systems (MCSs). These are typically mesoscale bands of precipitation or squall lines which can be distributed asymmetrically around the low (Fig. 3). The movement of the mesoscale precipitation bands is influenced by the track of the low and the vertical shear. For tropical depressions in the northern hemisphere, the area to the right of the storm is favored for strong convection and heavy rainfall.
Synoptic Analysis
Surface and Upper Air
A broad low-pressure center formed over northern Belize near 18°N, 88°W at 1200 UTC on 27 September 2010 and moves to the northeast (Fig. 4). This means that areas in and around the low will also experience low-level convergence, rising motion, and areas of deep convection. An upper-level ridge (Fig. 4d) provides a favorable environment for strengthening of the surface low and the possible formation of a tropical cyclone.
Fig 4a
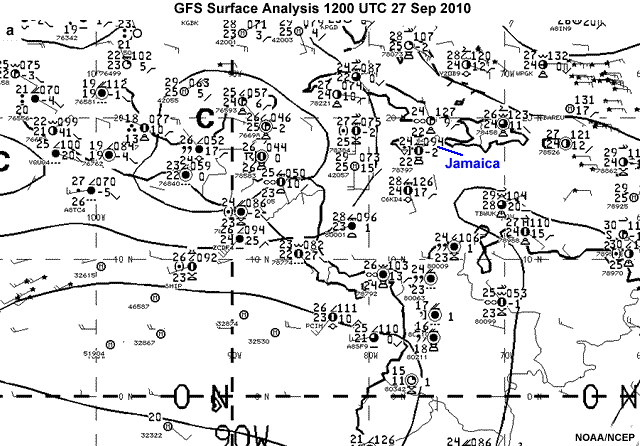
Fig. 4. Surface weather plots and isobars for (a) 1200 UTC 27 Sep, (b) 1200 UTC 28 Sep and (c) 1800 UTC 28 Sep 2010. (d) 250 hPa analysis at 0000 UTC 29 Sep 2010, where 'H' marks upper-troposphere high pressure center.
Fig 4b
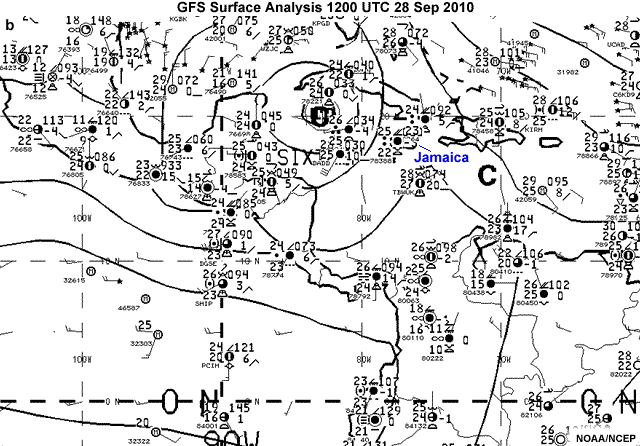
Fig. 4. Surface weather plots and isobars for (a) 1200 UTC 27 Sep, (b) 1200 UTC 28 Sep and (c) 1800 UTC 28 Sep 2010. (d) 250 hPa analysis at 0000 UTC 29 Sep 2010, where 'H' marks upper-troposphere high pressure center.
Fig 4c
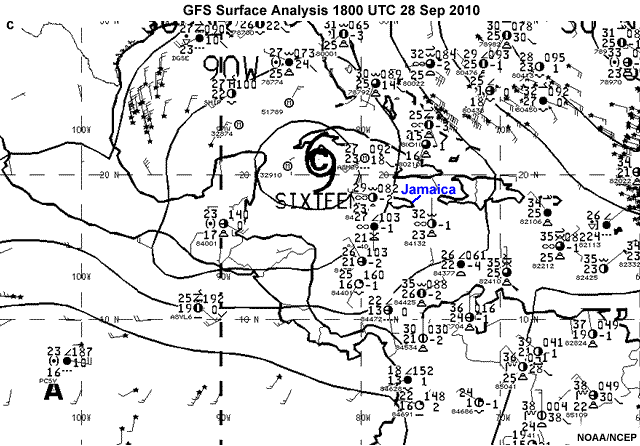
Fig. 4. Surface weather plots and isobars for (a) 1200 UTC 27 Sep, (b) 1200 UTC 28 Sep and (c) 1800 UTC 28 Sep 2010. (d) 250 hPa analysis at 0000 UTC 29 Sep 2010, where 'H' marks upper-troposphere high pressure center.
Fig 4d
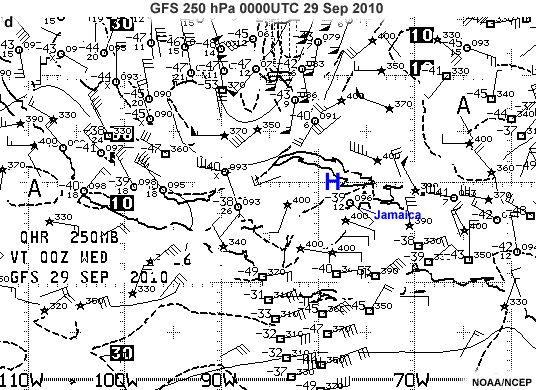
Fig. 4. Surface weather plots and isobars for (a) 1200 UTC 27 Sep, (b) 1200 UTC 28 Sep and (c) 1800 UTC 28 Sep 2010. (d) 250 hPa analysis at 0000 UTC 29 Sep 2010, where 'H' marks upper-troposphere high pressure center.
Question
Based on the position of the low pressure and the upper-level flow and conceptual
description above, how might clouds and precipitation evolve around the low?
(Select all that apply.)
The correct answers are b) and d).
Satellite Images and Soundings
Widespread cloudiness and deep layer moisture across most of the western and central Caribbean is associated with flow from the southern Caribbean, tropical Pacific, and even northern South America (Fig. 5a). Embedded within the large-scale circulation are MCSs oriented SSW-NNE (Fig. 5b). The prevailing flow is bringing mesoscale bands of deep convection or squall lines to the Western Caribbean and Central America (Fig. 5c).
Fig 5a
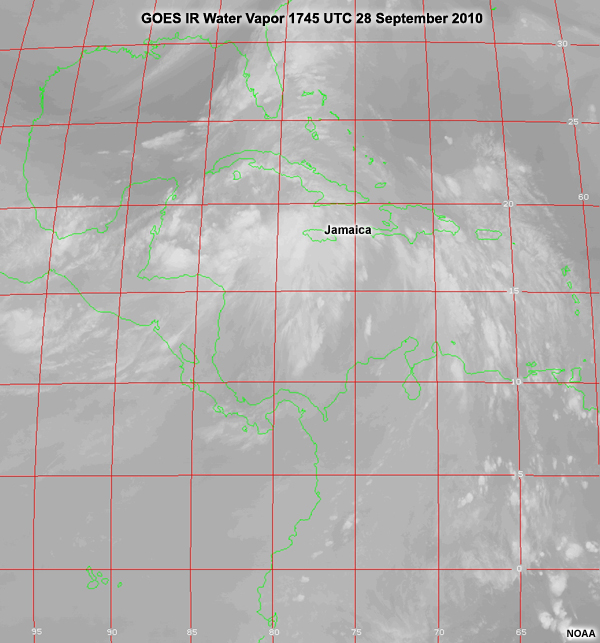
Fig. 5. Satellite images on 28 September 2010: (a) GOES IR water vapor image at 1745 UTC, (b) MODIS true color image at 1820 UTC, and (c) Animation of GOES IR images from 2225 UTC to 2340 UTC. Brightest white areas indicate deep convection.
Fig 5b
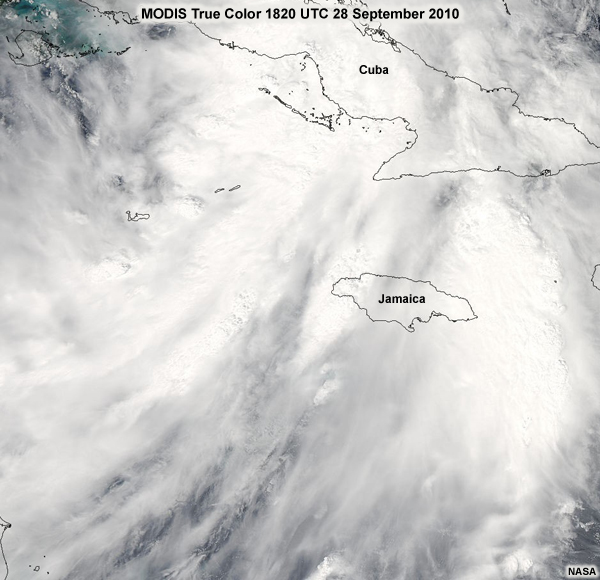
Fig. 5. Satellite images on 28 September 2010: (a) GOES IR water vapor image at 1745 UTC, (b) MODIS true color image at 1820 UTC, and (c) Animation of GOES IR images from 2225 UTC to 2340 UTC. Brightest white areas indicate deep convection.
Fig 5c
Fig. 5. Satellite images on 28 September 2010: (a) GOES IR water vapor image at 1745 UTC, (b) MODIS true color image at 1820 UTC, and (c) Animation of GOES IR images from 2225 UTC to 2340 UTC. Brightest white areas indicate deep convection.
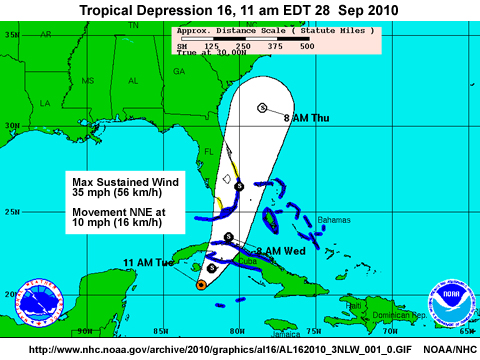
Fig. 6. Location of the center of Tropical Depression #16 at 11 am EDT (1500 UTC) 28 September 2010 and its forecast track and stage.
The precursor low pressure center moved slowly northeastward between 1200 UTC 27 September and 1200 UTC 28 September (Fig. 4c). Tropical depression #16 formed over the western Caribbean, off the coast of Belize, on 28 September and moved north while intensifying (Fig. 6).
Winds are predominantly southwesterly and southerly, indicating that clouds and precipitation will be steered to the northeast and north (Fig. 4c). The intensification and movement of the low pressure are indicated by the upper air observations over Kingston, Jamaica (Fig. 7). At 0000 UTC on 28 September, the sounding shows light winds from the surface to about 300 hPa. Winds are westerly up to 500 hPa then become south-southeasterly and weaker, while above 200 hPa stronger northwesterlies are present. By 1200 UTC on 28 September, westerly winds above 200 hPa have strengthened. The surface winds and upper air winds are consistent with a developing surface low and upper-level high to the west of the island. The veering of the winds with height indicates warm advection and strengthening of the warm-core low pressure. The onion shaped sounding, a signature of a dry lower-troposphere, is typical of the environment in the wake of deep convection such as a squall line.
Fig 7a
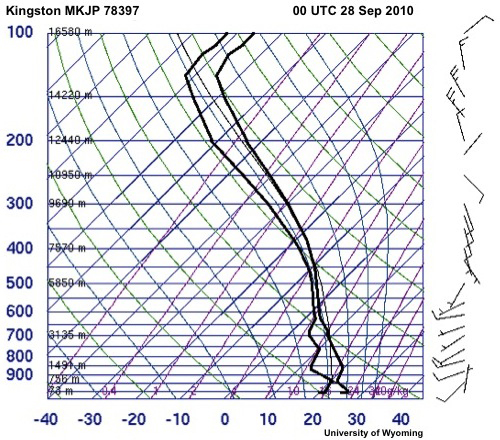
Fig. 7. Soundings from Kingston, Jamaica at 0000, 1200, and 1800 UTC 28 Sep and 0000 UTC 29 Sep 2010.
Fig 7b
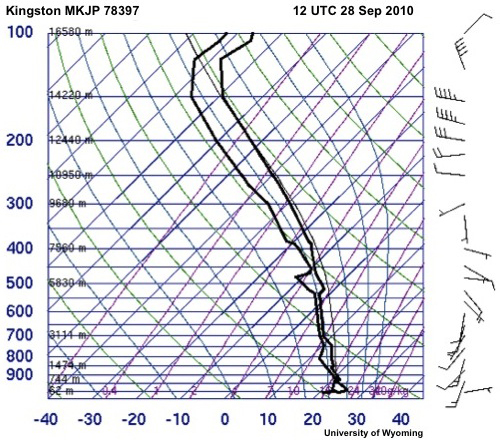
Fig. 7. Soundings from Kingston, Jamaica at 0000, 1200, and 1800 UTC 28 Sep and 0000 UTC 29 Sep 2010.
Fig 7c
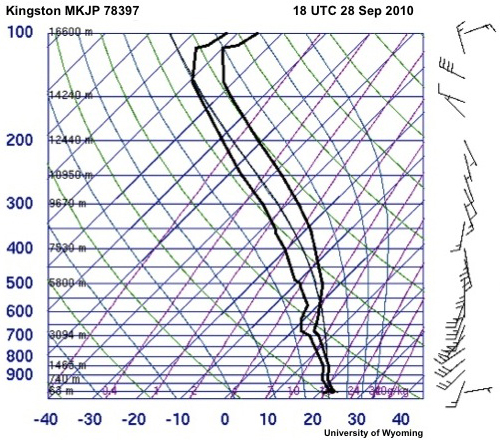
Fig. 7. Soundings from Kingston, Jamaica at 0000, 1200, and 1800 UTC 28 Sep and 0000 UTC 29 Sep 2010.
Fig 7d
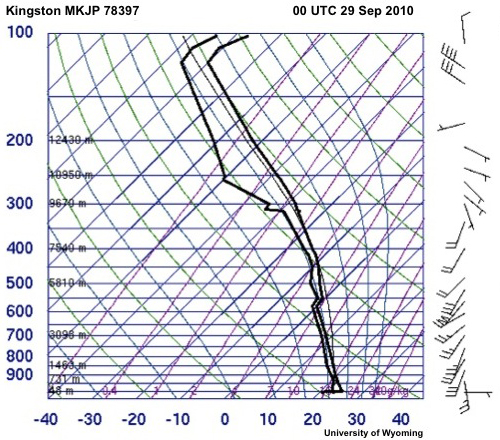
Fig. 7. Soundings from Kingston, Jamaica at 0000, 1200, and 1800 UTC 28 Sep and 0000 UTC 29 Sep 2010.
Over the course of the day, winds in the low-mid troposphere become much stronger and more southerly. By 1800 UTC, winds near 800 hPa exceed 15 m/s (30 kts). A deep layer of the atmosphere (up to 700 hPa) is at or near saturation with temperature profiles nearly parallel to the moist adiabats, conditions that are conducive to heavy rainfall and flash floods. Severe weather parameters, such as strong convective available potential energy (CAPE), are weak. However, it should be noted that tropical thunderstorms do not typically have as high CAPE values as deep convection in the midlatitudes. At 0000 UTC on 29 September, the predominant flow between 850 and 300 hPa is south-southwesterly. So, the deep layer steering is to the northeast and north. By this time, the sounding is close to moist adiabatic through the depth of the troposphere and the atmosphere is saturated up to 300 hPa.
Conceptual Models of MCSs
The surface maps, geostationary satellite, and upper air soundings provide information about the synoptic environment in the region. Now we will use radar imagery to analyze the local weather and forecast their associated hazards. We begin by reviewing the typical structure and evolution of the MCSs that affected Jamaica during this period.
Squall Line and Bow Echoes
Description
A squall line is an MCS that is linearly-oriented (along a line). Squall lines usually start as cumulonimbus along a low-level convergence boundary then merge and organize upscale to form a single cloud system with large contiguous areas of rain. A squall line or a single large thunderstorm can form into an MCS known as a bow echo, because of its characteristic bow shape on radar displays. The typical radar echoes over the lifecycle of a bow echo are shown in Fig. 8.

Fig. 8. (a) Conceptual model of bow echo evolution and favored locations for downbursts, tornadoes, and bookend vortices. (b) Conceptual diagram of bow echo features and an example cross section showing the rear-inflow notch or weak echo notch which signifies the location of a descending rear inflow jet that leads to damaging straight line surface winds. (c) Example of a bow-echo cross section showing radar reflectivity and storm relative flow including the rear inflow jet (from Grim et al. 2009).
How the Bow Forms
- During the mature stage of an MCS, the convective cells spread rearward transporting warm air aloft. The downdrafts produce a surface cold pool that also extends rearward due to the rearward expanding rain area.
- The juxtaposition of the warm air aloft over a cold pool produces lower pressure at mid levels, leading to mid-level convergence. The flow that converges in from the rear of the system at mid levels is known as the rear-inflow jet.
- The bow echo radar signature is produced as a rear inflow jet descends from mid-levels to the surface (Fig. 8c).
- Bow echoes may occur as either isolated systems or as part of a much larger squall line (e.g., Fig. 9); they are usually 20-120 km long.
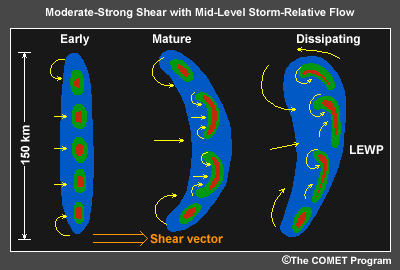
Fig. 9. Evolution of a squall line into a line echo wave pattern (LEWP) with small-scale bow echoes under moderate to strong vertical wind shear.
Mature Structure
- "Line-end" or "bookend" vortices develop on either end of the line.
- The poleward (cyclonic) vortex is usually stronger than the equatorward (anticyclonic) vortex.
- A strongly bowed echo may indicate high winds at the apex due to strong rear inflow or strong downbursts. Bow echoes often generate intense winds when line-end vortices are closely spaced because they act to strengthen the rear-inflow jet and hence lead to stronger winds at the surface (Fig. 10).
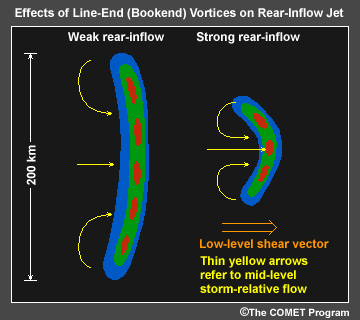
Fig. 10. Effects of line-end (bookend) vortices on the rear inflow jet.
Fujita (1978) observed that these bow-like structures caused damaging straight line surface winds along the bow axis. This kind of windstorm is called a "derecho", Spanish for "straight ahead", and can have winds of 60 to over 100 miles per hour. Strong surface winds in bow echoes result from the exceptionally strong, deep surface cold pool generated by deep convection and the downward transport by the rear inflow jet.
Brief tornadoes may occur on the leading edge of a bow echo. The preferred location for tornadoes is near the apex of the bow and on the poleward side of the apex (see grey dots in Fig. 8a). Figure 11 shows the radar reflectivity and corresponding Doppler velocity image associated with a bow echo that produced damaging straight line surface winds as well as a tornado. Note the weak echo channel (WEC), also known as a rear inflow notch, which indicates the presence of a strong rear inflow jet.
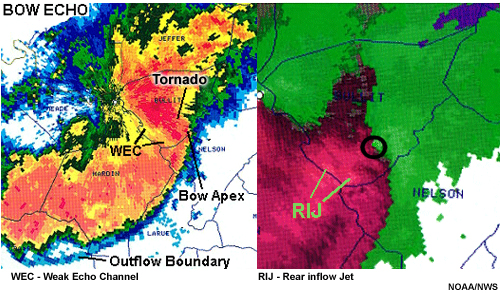
Fig. 11. Bow echo that produced a tornado and damaging surface winds. Note the weak echo channel (WEC), also known as a rear inflow notch in the left panel, associated with the strong rear inflow jet (RIJ, in the right panel). The black circle marks the velocity couplet that indicates rotation.
Forecast Squall Line Evolution
Movement and Evolution
Squall lines are commonly observed with a leading convective line and trailing stratiform region on radar imagery. Squall line motion results from both the advection of individual cells within the line and discrete propagation due to the triggering of new cells. For long squall lines (> 200 km) cells may move at an angle to the line but the net motion of the line is perpendicular to the initial orientation (Fig. 12). The speed of squall line propagation depends on the speed of cold pool/gust front propagation but can be affected by changes in the convective available potential energy (CAPE) and shear along the line. The balance between the low-level shear (usually 0-3 km) and the CAPE strongly influences how the MCS evolves and moves.
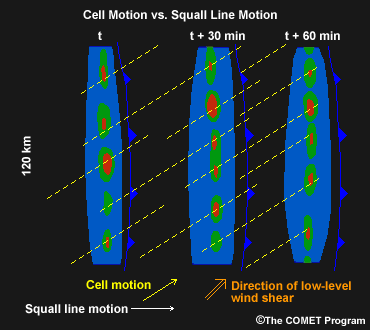
Fig. 12. Cell motion versus squall line motion and the role of low-level wind shear
Wind Hazards
Potentially damaging winds in squall lines are most threatening where the reflectivity gradients are strong at low-levels and the gust front remains close to the leading edge (Fig. 13). Swaths of damaging downburst winds occur with the combination of:
- Strong low-level reflectivity gradients along the leading edge
- Rear inflow notches (weak echo channels)
- Greatest degree of bowing
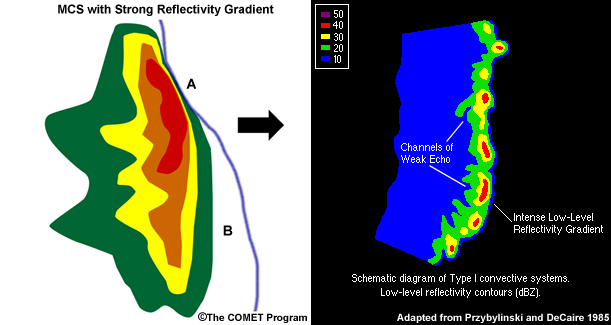
Fig. 13. (left) Conceptual model of the low-level radar reflectivity of a squall line moving left to right. The blue line ahead of the low-level reflectivity core marks the system gust front. Point A shows a gust front that stays close to the leading deep updrafts of the system and a tight low-level reflectivity gradient. Both indicators suggest an enhanced likelihood for damaging winds near point A. Damaging wind risk is lower at Point B as the gust front has outrun the core at that point, and the pattern shows a broader reflectivity gradient. (right) Conceptual model of squall line with moderate to strong shear and high gradients of high reflectivity and bow echoes.
Heavy Rainfall
High reflectivity is correlated with intense precipitation or high rain rates, where rain rate is usually measured as mm/hr or inches per hour. Precipitation of high intensity can come from tall thunderstorms, in which ice particles melt and collide and coalesce, or from warm tropical clouds where droplets collide and coalesce. In both cases, the radar reflectivity will be high. However in the latter case, the highest reflectivity will be below the melting level. Where reflectivity cross-sections are available, a marker for high precipitation rates and likely flash floods is a "low echo centroid". Intense precipitation causes low visibility and low ceilings, which can interrupt airport operations.
Flash floods are also likely where thunderstorm cells move over the same area continuously. Radar animations and cross sections can help forecasters to monitor the evolution, intensity, and movement of thunderstorm cells.
Case Challenge
- Identify severe weather radar signatures that are similar to conceptual models
- Forecast movement/development of mesoscale convection
- Identify heavy rainfall and potential flash flooding
- For each of the above, identify the associated aviation weather hazards
Identify Bow Echo Radar Signature
Examine the following short range (180 km) radar reflectivity image at 1850 LT on 28 September 2010 and answer the questions below.
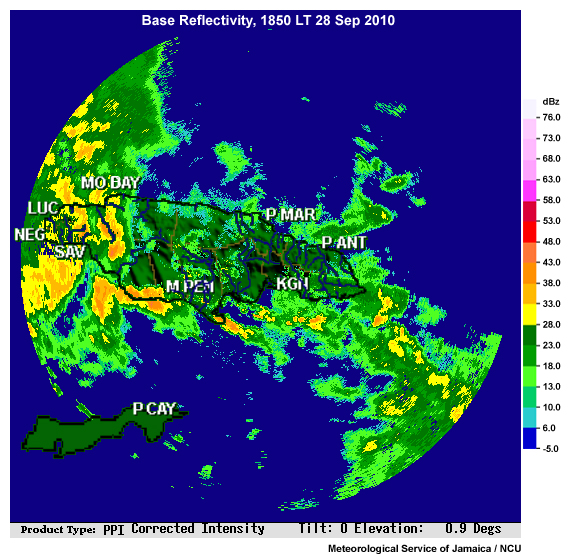
Fig. 14. Radar reflectivity (dBz) at short range at 1850 LT (2250 UTC).
Question 1 of 2
What is the dominant shape of the reflectivity areas that pose the greatest potential
threat over Western Jamaica?
(Choose the best answer.)
The correct answer is c).
The high reflectivity areas are bow-shaped.
Question 2 of 2
Identify the aviation hazards that are usually associated with this radar
reflectivity pattern and where they may be located.
(Select all that apply.)
The correct answers are a), c), d) and e).
Brief tornadoes tend to form on the poleward side of the apex. Strong, straight-line winds are typical along the apex of the bow. The bow echoes of high reflectivity also indicate heavy rainfall, strong downdrafts, and low visibility. Strong convective updrafts/downdrafts, and storm-relative cross flow will also cause turbulence. The area behind the bow is usually an area of weak echoes and little rain.
Summary: Bow Echo and Hazards
The radar reflectivity images show bow-echoes over western Jamaica (Fig. 15), which is conducive to production of strong straight line surface winds as well as the formation of tornadoes.
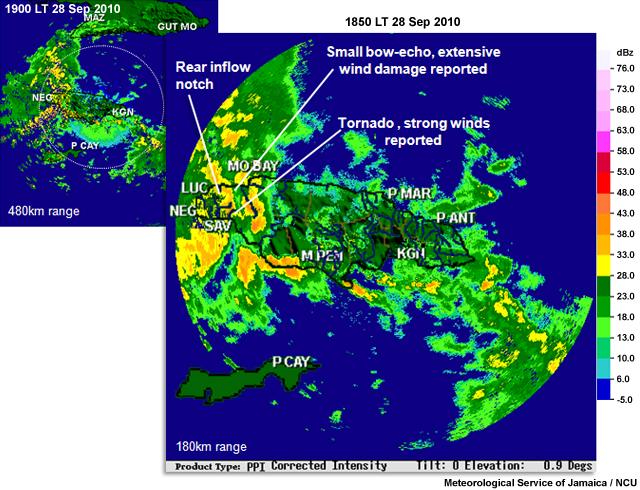
Fig. 15. Radar reflectivity (dBz) at short range at 1850 LT (2250 UTC) and long range at 1900 LT on 28 Sep 2010. Note the bow-shaped reflectivity echo over western Jamaica and the reported tornado and wind damage locations. Radar image is courtesy of the National Meteorological Service of Jamaica. Damage reports are from the Office of Disaster Preparedness and Emergency Management (ODPEM) of Jamaica.
A tornado/waterspout touched down in the town of Savanna-la-mar (SAV), near the apex of the large bow-shaped squall line (Fig. 15). High winds destroyed three homes and the historic Savanna-la-Mar Baptist Church, which was built in 1829. One person was critically injured by a flying sheet of zinc roofing.
The term "freak storms", used in media reports to describe the observed weather, implies that these events are freaks of nature and therefore unpredictable. In fact, brief tornadoes are typical hazards of bow echoes and here a tornado/waterspout formed in the area of the bow echo favored for tornadoes (Fig. 8). So, rather than being unexpected, the phenomenon occurred as expected from the conceptual model.
Extensive wind damage was also reported south and southwest of LUC (the town of Lucea). Notice the small bow-echo and the rear-inflow notch or weak echo region (Fig. 15), which indicates the presence of a rear-inflow jet and potential damaging surface winds. The likelihood of damaging, straight-line winds is higher in this case because of the close proximity of the line-end vortices which strengthen the rear-inflow jet.
By paying close attention to the radar reflectivity pattern, forecasters can identify bow echoes and the areas at risk for tornadoes, waterspouts, or damaging surface winds.
Forecast Squall Line Evolution
Review the following sounding profiles for Kingston.
18 UTC 28 Sep
00 UTC 29 Sep
Question 1 of 4
Based on the trends in stability, moisture, and vertical wind shear, would you expect
the squall line over western Jamaica to weaken, strengthen, or remain the same
within the next hour or so?
(Choose the best answer.)
The correct answer is b).
Based on the trends observed in the soundings, the squall line is expected to strengthen as low-level wind shear increased. By 0000 UTC on 29 Sep 2010, winds are veering with height up to 700 hPa indicating warm advection and enhancement of the warm-core of the developing tropical depression. The atmosphere is close to moist adiabatic through the depth of the troposphere and is saturated up to 300 hPa; conditions that are also characteristic of high rain rates and heavy rainfall.
Question 2 of 4
What hazards to aviation are posed by a squall line with intense convection?
(Select all that apply.)
The correct answers are a), c) and d).
Squall lines produce precipitation of high intensity which reduces visibility. With wet runways, greater breaking distance is required. Strong convective updrafts and downdrafts and the increase in low-level vertical shear will cause turbulence.
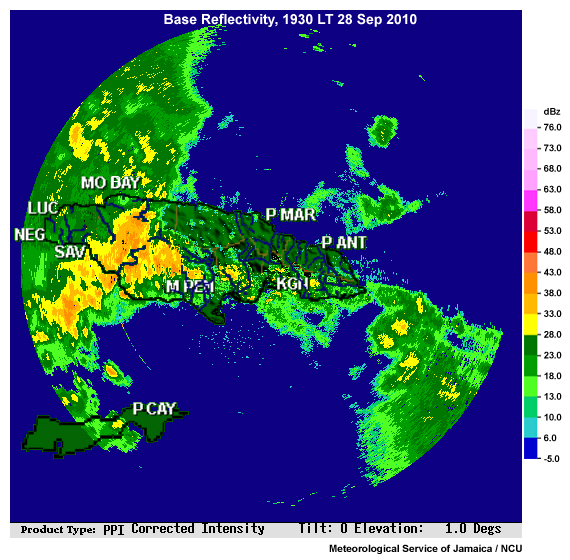
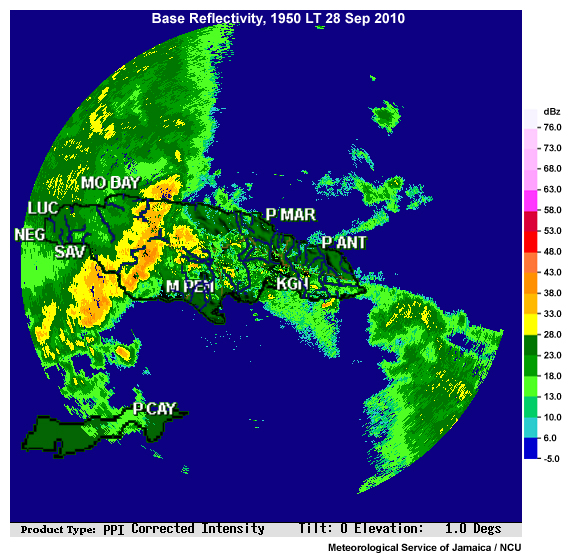
Review the radar reflectivity at 1850 LT and 1930 LT (below), the sounding at 1800 UTC/1400 LT (above), and the synoptic charts (Fig. 4b and 4c).
1850 LT 28 Sep
1930 LT 28 Sep
Question 3 of 4
In which direction do you expect the squall line to move in the next hour or so?
(Choose the best answer.)
The correct answer is b).
The squall line is expected to move from west to east. Squall line motion results from both the advection of individual cells within the line and discrete propagation due to the triggering of new cells. The low-level environmental shear (see the sounding) is advecting the cells to the northeast. However, new cell growth is south, southeast, and southwest of the line. So the general motion of the squall line is to the east (total system motion is slightly north of east).
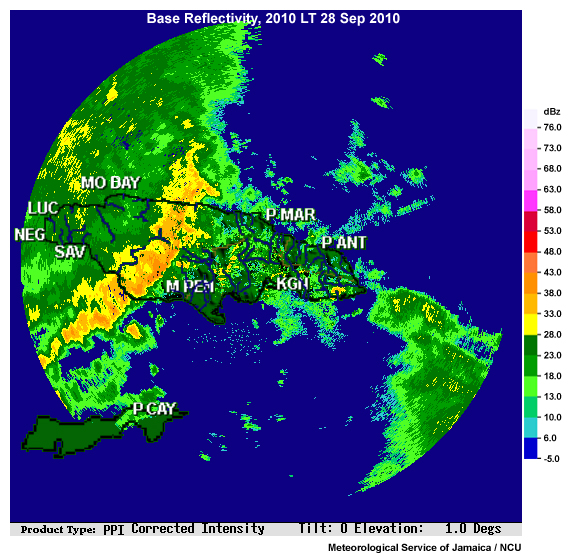
Review the tabs below to see the squall line movement and development through 2010 LT.
1930 LT 28 Sep
1950 LT 28 Sep
2010 LT 28 Sep
Question 4 of 4
How would you describe the evolution of the radar reflectivity pattern?
(Select
all that apply.)
The correct answers are b), d) and e).
Summary: Squall line with Damaging Surface Winds
As the storm moved from west to east the general shape shifted from a bow shape to a more linear-type of squall line (Fig. 16). There were reports of mini-tornadoes, which damaged the roofs of several homes in Ingleside, a suburb of Mandeville, and the towns of Lizzith and Downs in south central Jamaica. The reports were from a region of high values of reflectivity and strong gradients of radar reflectivity near an apex (indicated by the white arrows in Fig. 16). Reflectivity gradients were weaker along other parts of the leading-line, which indicates reduced risk of damaging winds. Note also the rear-inflow notches in the wake of the strong reflectivity apex at each place of reported high winds. As shown in Fig. 11 and Fig. 13, such weak echo areas indicate the location of strong descending rear-inflow jets. As in the first example, these small bow echoes produced brief tornadoes and damaging surface winds.
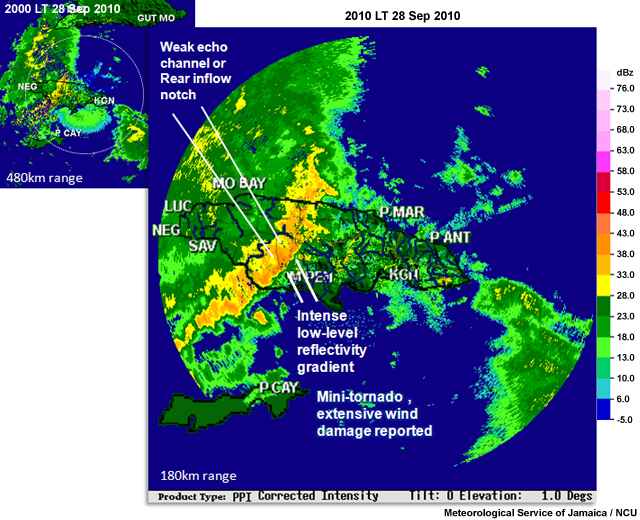
Fig. 16. Base radar reflectivity at 20:10 on 28 Sep 2010. Note the squall line across central Jamaica with peak low-level reflectivity and strong low-level reflectivity gradients over south central Jamaica. Note the accompanying rear inflow notch or weak echoes behind the regions of high reflectivity gradients. White arrows point to locations of brief tornadoes that damaged homes and other property. Radar image is courtesy of the National Meteorological Service of Jamaica.
Identify Heavy Rainfall and Potential Flash Flooding
In addition to the strong winds and tornadoes, MCSs can also cause flash floods. From the satellite images, we noted the long period of widespread cloudiness and areas of deep convection over the island. With those conditions, we expect that heavy rainfall will be prevalent.
But which areas will be most affected?
By examining a series of radar images, forecasters can observe where the precipitation rate is heaviest for the longest period, conditions which cause flash flooding. Flash floods also occur when a system becomes quasi-stationary over a drainage basin or when successive convective systems pass over the same drainage area.
Examine the animation of the radar reflectivity and answer the questions below.
Question 1 of 2
ICan you identify areas of potential flash flooding?
(Select all that apply.)
The correct answers are b), d) and e).
Question 2 of 2
If these conditions were present in your aerodrome forecast zone, what aviation
impacts would be expected?
(Select all that apply.)
The correct answers are a), d) and e).
Summary: Squall Lines and Flash Flooding
The highest reflectivity values occur for the longest periods over western and southwestern Jamaica, although rainfall is spreading across the entire island (Fig. 17). As the prevailing winds become more southerly (recall the soundings shown earlier), new cells move towards the NNE along a similar path as previous cells. The result is flash floods over parts of western, southwestern, and south central Jamaica. For example, note the persistence of high reflectivity cells over south central Jamaica near May Pen (M PEN) between 2150 and 2350 LT.
Fig. 17. Animation showing regions of frequent high reflectivity associated with flash flood producing thunderstorms.
Flash floods are also common where moist low-level air encounters elevated terrain and moisture convergence and lifting are focused into small areas. Most of the high reflectivity cells are on the south side of the mountainous backbone of the island—the windward side relative to the prevailing flow from the south and southwest. Indeed, most of the flood reports were in southern and western parts of the island.
Assessing the Impacts
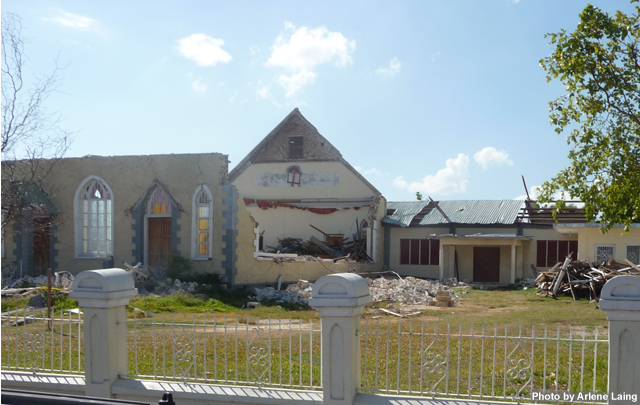
Fig. 18. Photograph of the destroyed historic Savanna-la-mar Baptist church that was hit by reported tornado on 28 September 2010 (photograph taken by Arlene Laing).
The destroyed historical Baptist church (Fig. 18) serves as a dramatic reminder of the hazards of severe thunderstorms. News reports and reports from official government agencies describe the scale of the damage from the series of local storms that accompanied the developing tropical depression.
The multiple hazards that accompanied the severe storms are summarized in the official report of the Planning Institute of Jamaica, 2010: "Jamaica macro socio-economic and environmental assessment of the damage and loss caused by Tropical Depression No. 16/Tropical Storm Nicole, November 2010." The report includes a map (Fig. 19) of widespread heavy rainfall, flooding, extensive wind damage, and tornadoes.
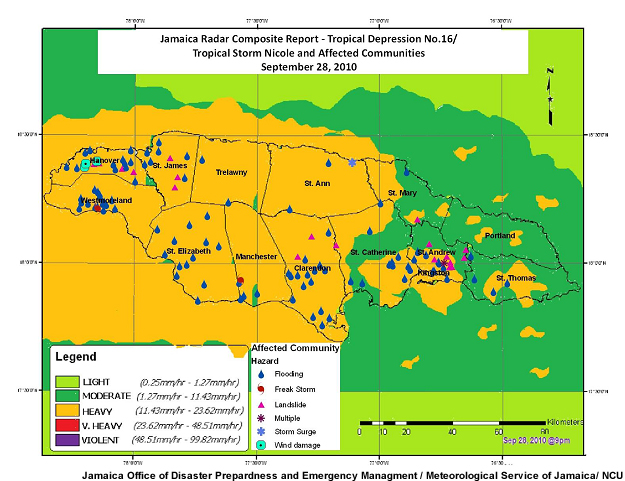
Fig. 19. Map of rainfall, flooding, wind damage, tornadoes (reported as 'freak storms'), storm surge, landslides, and multiple sources of damage. Source: National Meteorological Service of Jamaica and the Office of Disaster Preparedness and Emergency Management (ODPEM).
Aviation Impacts
The conditions associated with the squall lines would have various impacts on aviation. These include: strong surface winds, strong vertical wind shear, turbulence from tornadic cells, low ceilings, and low visibility. Additional impacts on airport operation is caused by heavy rainfall such as wet runways that require greater braking distance. Hours of thunderstorm activity can also cause a reduction in the Airport Acceptance Rate (AAR), which determines the number of aircraft that can land at a specific airport in given time frame.
News Reports
- The Gleaner
http://jamaica-gleaner.com/gleaner/20100930/news/news7.html
"The historic Savanna-la-Mar Baptist Church, Westmoreland, built in 1829, was on Tuesday evening flattened by a freak storm, which hit the town sometime after 6 p.m. Eyewitnesses who were downtown Sav-la-Mar, close to the waterfront, told The Gleaner that they saw what appeared to be a waterspout, which came ashore with bright flashes of light and fire. Numerous buildings, including homes, were damaged or destroyed; and trees and utility poles collapsed." - The Western Mirror
http://westernmirror.com/index.php/permalink/3032.html
On Tuesday evening, our newsroom received reports of a tornado-like phenomenon that hit the Westmoreland capital, Savanna-la-Mar. Chadd-Rick Clarke, a resident of Little London, Westmoreland, was in the town when the freak storm occurred. "I mean I was there when things started blowing all over the place … people started running for shelter and screaming … one lady's foot got chopped by a piece of zinc (which was blown by the strong winds)," Clarke revealed. - RJR Radio
"Sections of Savanna-la-mar were also left without electricity after the heavy winds, which lasted for several minutes, downed utility poles. Director-General of the Office of Disaster Preparedness and Emergency Management (ODPEM), Ronald Jackson, says one of the persons who, was injured during the passage of the storm is in serious condition. "There was a freak storm which is similar to what they call a tornado or a water spout which occurred in a section of Savanna-la-mar. It damaged three homes, one was totally flattened while the other two lost roofing completely," Mr. Jackson said." - Jamaica Observer
http://www.jamaicaobserver.com/news/Never-seen-flooding-like-this_8019000
"But in Downs and Lititz on the South Manchester/South-East St Elizabeth border, there was also the story of a mini-tornado which ripped off several roofs and devastated the greenhouse farm of former member of parliament for South-East St Elizabeth Len Blake. Pointing to wrecked greenhouse structures which had been protecting lush rows of lettuce, Blake said the "freak storm", which lasted "less than five minutes", had done him "more than a million dollars in damage".
References
- Fujita, T. T., 1978: Manual of downburst identification for project NIMROD. Satellite and mesometeorology Research Paper 156, Dept. of Geophysical Sciences, University of Chicago, 104 pp.
- Grim, J. A., R. M. Rauber, G. M. McFarquhar, B. F. Jewett, and D. P. Jorgensen, 2009: Development and forcing of the rear inflow jet in a rapidly developing and decaying squall line during BAMEX. Mon. Wea. Rev., 137, 1206–1229.
- MetEd, 2011: Flash Flood Processes: International Edition. Meteorological Influences
https://www.meted.ucar.edu/hydro/basic_int/flash_flood/navmenu.php?tab=1&page=2.0.0 - Planning Institute of Jamaica, 2010: Jamaica macro socio-economic and environmental
assessment of the damage and loss caused by Tropical Depression No. 16/Tropical Storm
Nicole, November 2010. [Available at
http://www.pioj.gov.jm/Portals/0/Sustainable_Development/Tropical%20Storm%20Nicole_Impact%20Assessment_Final.pdf] - Przybylinski, R. W., and D. M. DeCaire, 1985: Radar signatures associated with the derecho, a type of mesoscale convective system. Preprints, 14th Conf. on Severe Local Storms, Indianapolis, IN, Amer. Meteor. Soc., 228-231.
- Przybylinski, R. W., 1995: The bow echo: Observations, numerical simulations, and severe weather detection methods. Wea. Forecasting, 10, 203–218.
- Smull, B. F., and R. A. Houze, 1987: Dual-Doppler radar analysis of a midlatitude squall line with a trailing region of stratiform rain. J. Atmos. Sci., 44, 2128–2148.
- Weisman, M. L., J. B. Klemp, and R. Rotunno, 1988: Structure and evolution of numerically simulated squall lines. J. Atmos. Sci., 45, 1990–2013.
- Weisman, M. L., 1992: The role of convectively generated rear-inflow jets in the evolution of long-lived mesoconvective systems. J. Atmos. Sci., 49, 1826–1847