Introduction
This site provides a Webcast focusing on the capabilities of the new Modis (Moderate Resolution Imaging Spectroradiometer) instrument on the Terra (EOS AM-1) satellite platform. The Webcast features Dr. Paul Menzel, NPOESS Operational Algorithm Team Leader for imaging. The Presentation is divided into short sections and includes an overview of the MODIS instruments, calibration, channel selection, and multiple examples of imagery products, highlighting applications in the earth, oceanic, and atmospheric sciences. Links to resources on MODIS Imagery are also provided. This Webcast was designed for a user with a wide variety of interests. Operational forecasters may want to focus on sections focusing on applications and examples.
on the navigation menu indicates more information on the associated topic.
MODIS Launch
MODIS Instrument
Other Instruments on TERRA
MODIS Spectral Bands
MODIS Channel Selection
Visible and Near-IR
MODIS Sounding
Calibration
NASA ER-2 Validation
More on Validation
Cloud Mask
Cloud Mask
Image Loop
Cloud Mask Algorithm
Thin Cirrus Detection
Image Loop
Cloud Mask with Thin Cirrus
Impact on Global Cloud Mask
Polar Application of Cloud Mask
Verification of Polar Inversion
Global Composite
Summary
- A more accurate definition of "clear-sky" conditions is key to improve characterization of land and ocean surface
- Likelihood of deetecting clouds increases with additional information from new spectral
channels on MODIS
- 13.9 μm channel enchances detection of clouds (cirrus)
- 1.38 μm improves detection of thin cirrus
- Enhanced cirrius cloud depiction leads to improved cloud tests and a more representative cloud mask product
- Water Vapor and infrared window channels in combination assist with detection of clouds in polar regions
- Global land and ocean product composites show benefit from improved cloud masking capabilities and algorithms
Land Applications
Land-Solar Radiation
Other Spectral Signatures

Land-Thermal Radiation
Land Applications Table
Click here to see a complete table including more information on product algorithms, MODIS product numbers and other technical information.
Summary
- MODIS spectral bands are sensitive to a broad range of ecosystems
- Increased spectral resolution in the visible and infrared begins to reveal the spectral signatures of various land and atmospheric characteristics
- Spectral selection in the visible and infrared supports numerous land applications
including:
- Sea turface temperature
- Land surface temperature and emissivity
- Surface reflectance
- Bi-directional reflectance
- Snow cover type/change
- Vegetation indices
- Leaf area index
- Net photosynthesis and net primary production
- Thermal anomalies and fire detection
Land Application Examples
Ice Leads
Snow and Ice Detection
Composite Snow and Ice Maps
Other Spectral Signatures
Global Albedo
Land-Surface Temperature
Leaf Area Index
Fire Detection
Coastal Change
Summary
- Fine scale structures like ice leads are resolvable with high reolution 250m visible imagery
- Multi-spectral image combination enables very good discrimination of snow, ice, and clouds
- Detailed composite maps track changes in snow and ice over time
- Global albedo maps take advantage of improved cloud masking capabilities with MODIS
- Land-surface temperature maps show diurnal variability over the continents
- A leaf area index product monitors spring/fall leaf growth/decline
- Fire, hot spots, and smoke plumes are observed in dedtail with a combination of visible and near-infrared bands
- Monitoring of coastal change is significantly improved with integrated approaches to multi-spectral senesing in the visible (0.5-0.9 micron range for suspended sediment) and infrared (for water typing)
Ocean Applications
Ocean-Solar Radiation
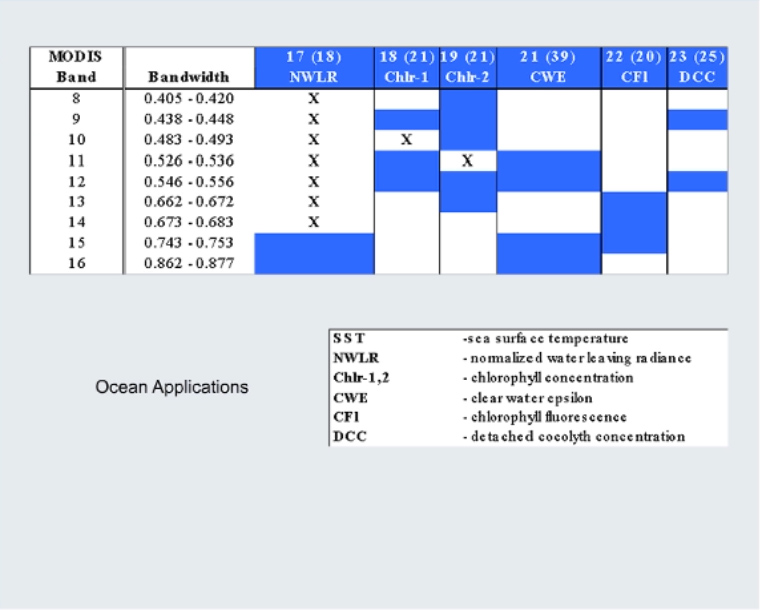
Ocean Applications Table
Click here to see a complete table including more information on product algorithms, MODIS product numbers and other technical information.
Other Spectral Signatures
Chlorophyll from SeaWiFS and MODIS
Chlorophyll Composite Image
Sea-Surface Temperatures
Gulf Stream Radiance Measurements
Summary
- MODIS' ocean-solar bands are shown to be very sensitive to chlorophyll and accessory pigments
- A broad range of ocean applications are possible with multi-spectral imaging in the visible and infrared
- Delineation of ocean chlorophyll and coverage in the tropics are improved when compared to SeaWiFS
- Composite imagery reveals excellent coverage and delineation of gradients in chlorophyll concentration
- Sea surface temperature is resolved in far greater detail and coverage in the topics is enhanced with the MODIS 4 micron channel
- Water leaving radiance at 1 km resolution reveals gradients and stunning details within ocean circulation patterns
Atmosphere Applications
Introduction
Atmosphere-Solar Radiation
Atmosphere-Clear Sky Thermal Emission
Atmosphere-Thermal Radiation
Atmosphere Applications Table
Click here to see a complete table including more information on product algorithms, MODIS product numbers and other technical information.
Summary
- Visible and near-IR spectral bands are useful in determining cloud droplet albedo and size distribution
- Infrared spectral bands, sensitive to CO2 and water vapor, provide temperature and moisture information for 3 layers
- Spectral channels near 14 μm provide effective cloud-top emissibity and height
- Multispectral combinations allow for a wide range of atmospheric applications from atmospheric moisture and temperature, to aerosol and cloud properties
Examples
Cloud Classification
Aerosol Detection
Volcanic Ash
CO2 Slicing
Cloud Phase Determination
Ice and Water Cloud Distribution
Day-Night Loop of Ice Clouds
Supercooled Water Cloud Distribution
MODIS Temperature Weighting Functions
Summary
- Through spectral characterization, MODIS cloud classification can enhance the ability to detect clouds independent of cloud threshholds
- MODIS has an enhanced ability for aerosol detection and determination of aerosol optical thickness
- Volcanic ash plumes are discriminated using infrared split-window bands within the silicate emissivity step function
- Global estimates of cloud-top temperature and pressure, cloud fraction, and effective emissivity can be produced when the CO2 slicing technique is applied to the CO2 channels on MODIS
- Cloud phase can be determined through a trispectral combination of 8, 11, and 12 μm infrared window channel brightness temperatures
- Global composites show water clouds dominant at low and midlatitudes, with ice clouds most abundant near the poles and with high level clouds in the tropics
- MODIS water vapor and CO2 channels are able to provide about three layers of temperature information between the surface and 300 hPa
Spatial Resolution
MODIS vs. GOES
MODIS vs. AMSU Global Comparison: 850 hPa
MODIS vs AMSU Global Comparison: 500 hPa
Summary
- Application of MODIS high resolution 1 km infrared data to retrieval of atmospheric temperature demostrates the capability to detect horizontal gradients in greater detail than with existing operational sounding or imaging instruments
- Comparisons with GOES and AMSU show that the horizontal temperature gradients are in good agreement
- MODIS improves the global depiction of atmospheric temperature
Water Vapor Channel
1 km Field-of-View: Water Vapor Channel
Polar Coverage
MODIS Polar Water Vapor Loop
Polar Wind Vectors
Moisture Weighting Functions
Summary
- MODIS is the first instrument to measure water-vapor sensitive radiation at 6.7 μm with a spatial resolution of 1 km
- Data are revealing fine-scale structure for atmospheric circulations on the mesoscale and for orographic effects such as cloud-free mountain waves and gravity waves
- MODIS imagery at 1 km resolution increases the opportunity for feature tracking and depiction of atmospheric flow over polar regions
- MODIS water vapor and CO2 channels are able to provide about three layers of temperature information between the surface and 300 hPa
- MODIS water vapor channels can also sense the vertical distribution of tropospheric water vapor, providing about three layers of information
Total Precipitable Water
MODIS vs. GOES
Scatter Plot of MODIS vs GOES TPW
MODIS total precipitable water vapor shows a wet bias with respect to GOES; bias 1.5 mm and RMS of 3 mm; bias will be removed after more validation
MODIS vs. AMSU Global Comparison
Summary
- MODIS depictions of the spatial variability in total-column water vapor are much improved as a result of the high resolution 1 km fields of view
- Comparisons between the MODIS and GOES Total Precipitable Water products point to a small positive bias for MODIS and a need for additional validation
- Patterns and gradients in the global distributions of MODIS and AMSU total water vapor compare favorably
Ozone
MODIS vs. GOES
MODIS vs. GOES Scatter Plot
MODIS ozone is very close to the Goes ozone (over North America): RMS of about 10 Dobsons
MODIS vs. TOMS Global Comparison
Summary
- Higher spatial resolution of MODIS results in improved depictions of the spatial variability in total ozone concentration
- MODIS vs. GOES comparisons demonstrate that patterns and gradients in total ozone compare favorably over midlatitudes
- Global comparisons between MODIS and TOMS show good agreement in ozone gradients at low and mid latitudes; additional refinement of the regression relationship will improve depictions of extreme events and larger gradients over polar regions
Direct Broadcast
Direct Broadcast Introduction
Snow in the Midwest
Fog in the Pacific Northwest
Fires in the Appalachian Mountains
Close-Up of Cape Cod
Direct Broadcast Details
SSEC UW-Madison EOS Direct Broadcast
Goals:
- Acquire and process MODIS and AIRS data from Terra and Aqua in near real-time
Highlights:
- SeaSpace auto-tracking 4.4 m antenna installed August 2000
- 500 Terra passes (day and night) acquired as of 20 January 2001
- Software for processing MODIS data released in May 2000
- Automated processing to Level-1B is now operational at SSEC
- Most recent 7 days of data and quicklooks will be available via FTP by end of January
More Information:
- Community Satellite Processing Package: https://cimss.ssec.wisc.edu/cspp/
- MODIS Today - USA False and True Color Composites: http://ge.ssec.wisc.edu/modis-today/index.php
Summary
- The full MODIS broadcast signal is available to international users with an X-band tracking antenna capbility
- Installed August 2000, a MODIS antenna at the University of Wisconsin provides real-time MODIS coverage from the Atlantic to the Pacific, and from Central America into Canada
- CSPP (Community Satellite Process Package) software is available for ground stations to
process direct broadcast data into level-1B files (radiances, imagery) and a variety of
level-2 products (derived cloud, atmospheric, and surface information):
https://cimss.ssec.wisc.edu/cspp/ - Near real-time and archive browse imagery:
http://ge.ssec.wisc.edu/modis-today/index.php,
https://modis.gsfc.nasa.gov/ - Overpass predictions and past orbit plots:
https://www.ssec.wisc.edu/datacenter/orbit_tracks.html - Data, product, and other spacecraft information:
https://modis.gsfc.nasa.gov/
Summary
Related Links
Remote Sensing of the Earth, Oceans, and Atmosphere with MODIS
SOO Training Resource Center
(http://strc.comet.ucar.edu/_index.htm)
NPOESS Userport
(https://www.meted.ucar.edu/satmet/poess_links.php)
NASA MODIS
Homepage
(http://modis.gsfc.nasa.gov/)
NASA's official MODIS Web site, this site provides links to news, data
and products, presentations, publications, science team Web pages, and
links to related sites.
Terra and Aqua Spacecraft
and MODIS Overview - NASA Goddard Space Flight Center
(https://terra.nasa.gov/, https://aqua.nasa.gov/)
These sites provide overviews of the Terra and Aqua Spacecraft and MODIS instrument on board
each, including links to data, latest imagery, publications, and interesting visualizations.
Aqua Spacecraft Website - NASA Goddard
Space Flight Center
(http://aqua.gsfc.nasa.gov/)
This site contains information about NASA's Earth Observing System (EOS)
Aqua spacecraft (the follow-on to Terra) scheduled for launch 2002.
MODIS Algorithm Theoretical Basis Documents (ATBDs)
(https://modis.gsfc.nasa.gov/data/atbd/)
This site includes a comprehensive listing of MODIS ATBDs for level-0
to level-4 products. Documents are provided in PDF format.
MODIS Direct Broadcast at NASA Goddard Space Flight Center
(https://modis.gsfc.nasa.gov/data/directbrod/)
Information about MODIS direct broadcast capabilities with links to overpass
prediction software and output, and real-time direct broadcast imagery
generated at NASA's Goddard Space Flight Center.
MODIS Direct Broadcast at SSEC
- University of Wisconsin
(https://cimss.ssec.wisc.edu/db_products/)
This site includes orbital track graphics, access to "quicklook" MODIS
imagery, and access to seven-day MODIS level-1b data in HDF format as
received by SSEC.
CIMSS - University of
Wisconsin MODIS Website
(http://cimss.ssec.wisc.edu/modis/)
MODIS science and product development at UW with links to data examples.
Community Satellite Processing Package (CSPP)
(https://cimss.ssec.wisc.edu/cspp/)
Software for Direct Broadcast supported by SSEC, University of Wisconsin-Madison, and NOAA's
JPSS Program.
Contributors
The following people have contributed to the development of Remote Sensing of the Earth, Oceans, and Atmosphere with MODIS
Sponsors
- National Oceanic and Atmospheric Administration (NOAA)
- National Weather Service (NWS)
- Naval Meteorology and Oceanography Command (NMOC)
- Air Force Weather Agency (AFWA)
- National Environmental Satellite Data and Information Service (NESDIS)
- National Polar-orbiting Operational Environmental Satellite System (NPOESS)
- Meteorological Service of Canada (MSC)
Principal Science Advisor
- Dr. W. Paul Menzel - Cooperative Institute for Meteorological Satellite Studies (CIMSS)/NOAA/University of Wisconsin
Project Meteorologist
- Patrick Dills - UCAR/COMET
Project Lead/Instructional Design
- Dr. Sherwood Wang - UCAR/COMET
Multimedia Authoring
- Seth Lamos - UCAR/COMET
- Carl Whitehurst - UCAR/COMET
Graphic Interface Design/Illustration
- Heidi Godsil - UCAR/COMET
- Steve Deyo - UCAR/COMET
Software Testing/Editing/Quality Assurance
- Michael Smith - UCAR/COMET
Copyright Administration
- Lorrie Fyffe - UCAR/COMET
Data/Photographs Provided By
- CIMSS/UW
- NCAR/UCAR/NSF
- NOAA/NESDIS
- NOAA/NWS
COMET HTML Integration Team 2019
- Tim Alberta — Project Manager
- Dolores Kiessling — Project Lead
- Steve Deyo — Graphic Artist
- Jordan Goodridge — Student Assistant/Web Developer
- Gary Pacheco — Lead Web Developer
- David Russi — Translations
- Alex Sheehan — Web Developer
- Tyler Winstead — Web Developer
Comet Staff
Director
- Dr. Timothy Spangler
Assistant Director
- Dr. Joe Lamos
Business Manager/Supervisor of Administration
- Elizabeth Lessard
Administration
- Lorrie Fyffe
- Bonnie Slagel
Graphics/Media Production
- Steve Deyo
- Heidi Godsil
- Seth Lamos
- Kay Levesque
Hardware/Software Support and Programming
- Steve Drake (Supervisor)
- Tim Alberta
- Dennis Ward (Webmaster)
- Carl Whitehurst
Instructional Design
- Patrick Parrish (Supervisor)
- Dr. Alan Bol
- Dr. Vickie Johnson
- Bruce Muller (Contract Employee)
- Dr. Sherwood Wang
Meteorologists
- William Bua
- Richard Cianflone - NWS
- Patrick Dills
- Doug Drogurub (Student)
- Kevin Fuell
- Jonathan Heyl (Student)
- Dr. Stephen Jascourt
- Matthew Kelsch
- Dolores Kiessling
- Wendy Schreiber-Abshire
- Dr. Doug Wesley
Software Testing/Quality Assurance
- Michael Smith (Coordinator)
National Weather Service COMET Branch
- Richard Cianflone
- Anthony Mostek (National Satellite Training Coordinator)
- Elizabeth Mulvihill Page
- Dr. Robert Rozumalski (SOO/SAC Coordinator)
Systems Administration
- Karl Hanzel
- James Hamm
- Max Parris (student)
Meteorological Service of Canada Visiting Meteorologists
- Peter Lewis
- Garry Toth