Overview
Vorticity Maxima and Comma Patterns
Season: Every day
Phenomena: Moist Circulations, Vorticity Maxima and Vorticity Advection
Tools: GOES water vapour
Forecast Challenges:
- Identify and predict the vorticity maxima in order to predict areas of positive vorticity advection
- Identify the related axes of maximum winds, deformation zones and air masses
Vorticity maxima signatures are very common and indicate areas of ascending circulation and atmospheric forcing. The correct placement of vorticity maxima is vital to the placement of related dynamic features such as the axis of maximum winds and deformation zones.
Note: All examples and conceptual models in this module are set in the northern hemisphere. All graphics are oriented north to south with north on top.
Conceptual Model
Development of a Comma Pattern
The shape of the cyclonic comma pattern reveals the location of the vorticity maximum. The vorticity maximum is located at the point of inflection and is the center of the cloud rotation in the atmospheric frame of reference. The shape of the concave inflow and convex outflow arcs are related to both the relative intensity of the vorticity maximum and the length of time the vorticity maximum has been acting on these arcs. The concave arc becomes more "caved" with both vorticity maximum intensity and age. The convex arc becomes more vexed.
The vorticity maximum (X) is the addition of both horizontal wind shear (S) (simply referred to as shear hereafter) and rotational vorticity (R). The following graphics illustrate the concept. The size of the symbols indicates relative intensity.
Given pure rotation, this conceptual cloud line will evolve in a symmetrical fashion. The position of the vorticity maximum is at the center of the rotation, which is also the point of inflection. The rotational vorticity is the sole component of vorticity. There is no shear vorticity component. The shape of the comma is determined by both the intensity of the vorticity maximum and its age.
With increased shear on the equatorial side of the rotation, the point of inflection and the total vorticity is shifted towards that region of greater shear. The concave arc in the location of the wind maximum is enhanced. The convex arc is not enhanced and is created purely by the rotational component of the vorticity, which remains unchanged and located at the center of the circle. The point of inflection is still the center of moisture rotation, which is also the location of the total vorticity maximum resulting from the sum of the rotational and shear vorticities.
To summarize, this point of inflection is a cyclonic outward cusp formed by the intersection of two cyclonically curved arcs directed toward the cusp. Typically, a cyclonic outward cusp is created by westerly speed shear that is equatorward of the cusp and marks the location of a vorticity maximum. This pattern is very common due to the prevailing westerly circulations around the globe.
With even stronger winds the equatorial shear component of the vorticity increases and there is more displacement of the total vorticity and point of inflection toward the region of shear and away from the position of the rotational vorticity centre. The concave arc in the location of the wind maximum is really enhanced. And again, with increased shear vorticity, the vorticity maximum will be more intense.
If the shear is on the poleward side of the rotation, the same shifting of the point of inflection takes place, again with the center of total vorticity shifting towards the region of shear. In contrast, however, the convex arc in the location of the wind maximum is enhanced. The concave arc is not enhanced and is created purely by the rotational component of the vorticity, which remains unchanged and located at the center of the circle. The vorticity maximum will be buried within the moisture area as opposed to the previous illustrations, where it is located in the dry portion of the circulation. This enhancing of the convex arc is "vexing" in that the point of inflection and vorticity maximum may be more difficult to locate than when the vorticity is dominated by its rotational component or the shear is equatorward of the rotational center.
Poleward shear comma clouds are common with the northeast trade winds in the tropics.
To summarize, this point of inflection is a cyclonic inward cusp formed by the intersection of two cyclonically curved arcs directed toward the cusp. Typically, a cyclonic inward cusp is created by easterly speed shear that is poleward of the cusp and marks the location of a vorticity maximum.
It's important to note that in this idealized example the moisture extends into the vorticity centre. In the real atmosphere the moisture may dry out near the circulation centre, especially as the circulation ages. As a result, the actual point of inflection may be displaced upstream from the apparent point of inflection revealed by the moisture patterns.
Morphology of a Comma Pattern
Roger Weldon originally identified the "comma" cloud pattern in the early 1980's. The cloud and absolute vorticity isopleth correlations he used were empirical. Variation in cloud heights from 500 hPa and time differences between the analysis and the satellite data can lead to errors. However, the centre of cloud rotation as identified by the point of inflection is the vorticity maximum.
Comma Dominated by Rotation and/or Equatorial Shear
The concave arc associated with the axis of maximum winds defines this type of comma. The most concave portion of the comma pattern identifies where the axis of maximum winds crosses into the moisture area.

The comma head is the portion of the comma downstream from the vorticity maximum. Positive vorticity advection will be strongest in the comma head region.
Comma Dominated by Poleward Shear
The convex arc defines this type of comma. The concave arc region is minimal, and the point of inflection is buried within the moisture area. The comma head is still that portion of the comma downstream from the vorticity maximum.
Other Considerations
- With both patterns, the comma tail is associated with the warm conveyor belt. Vorticity advection will be minimal in this region. The comma tail begins at the upstream long wave trof.
- It is very important to remember that all satellite features are generated by system-relative motions.
- If moisture elements on the poleward side of the cyclonic circulation are stationary or moving westward with respect to the earth's surface, the vorticity maximum is actually a closed upper low.
Analysis
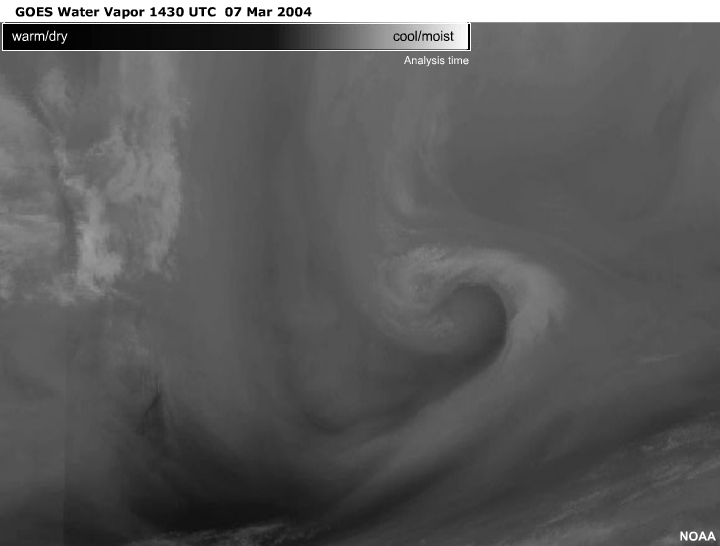
In the following interaction, first take a look at the GOES water vapor loop, then analyze it for the axes of maximum winds, vorticity maxima, and vorticity minima. After identifying these features, compare your analysis to the one provided.
Satellite Loop
Within this GOES 4-km water vapor loop, look for the the development of a vorticity maximum.
After viewing the loop, click the Your Analysis tab to access the last image of the loop (1430 UTC) and mark the location of the vorticity maxima, any associated vorticity minima, and any axes of maximum winds.
Your Analysis
The following exercise cannot be completed in Internet Explorer 11 or older versions. Please use Microsoft Edge or other modern browsers to complete this exercise.
Mark the location of the most prominent vorticity maxima, vorticity minima, and axes of maximum winds within the highlighted area.
Click the Done button to compare your analysis to the "Expert's Analysis".

Draggable Elements:
Vorticity minima:
Vorticity maxima:
| Tool: | Tool Size: | Color: |
|---|---|---|
|
|
|
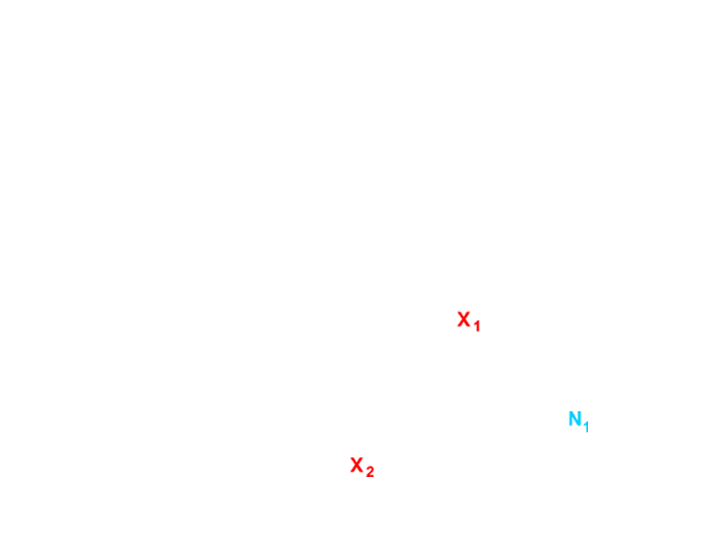
Within the highlighted area, there are two highly curved axes of maximum winds that are defined by dark WV vapor channels. Vorticity maximum X1, located at the point of inflection, is dominated by curvature vorticity and is paired with two ill-defined vorticity minima to the right of the flow.
The vorticity pairs can be matched can be across the axis of maximum winds that creates them. The two well-defined axes of maximum winds cruise through the atmosphere like water on sand carving out new branches and paths as the steering forces change.
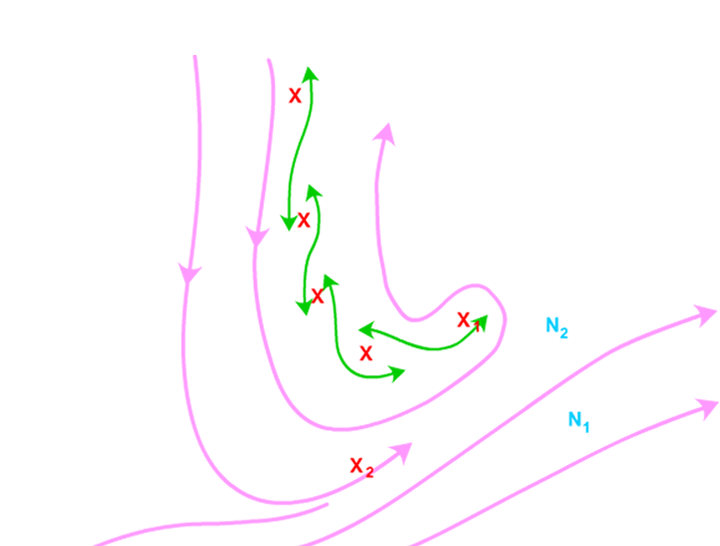
At least four subtle vorticity centers can be seen drifting southward as indicated. They can be located by identifying the "backward S" deformation zones that link them. They are spun up by the southerlies to their east and the northerlies to their west.
An anticomma pattern identifies the subtle vorticity minimum, N2. If poleward shear is responsible for N2, then the point of inflection is located at the inward point of the anticomma. If N2 is the result of equatorial shear or rotation, the point of inflection is located at the cusp. Since this pattern is dominated by poleward shear, N2 should be located at the inward point. The size of the symbol almost covers both locations.
Looking at the GFS90 500-hPa absolute vorticity reveals acceptable agreement with X1. X2 is straddled by two separate model vorticity centers picking up the idea that the wind maximum is starting to carve a more southwestward path. The other subtle vorticity centers are simply identified as a lobe(s) of higher vorticity along the axes of maximum winds.
Interpretation
Let's take a closer look at this situation. First we'll look at the large-scale atmospheric circulations, then we'll focus on the main comma and vorticity maximum, and finally, we'll take a closer look at the moisture patterns associated with much more subtle commas.
Circulation Overview
A broad and strong northerly flow spilling over the top of a large upper ridge to the west digs ever more southward during the animation time period. This flow turns sharply northward again climbing over a downstream ridge. A broad southwesterly upper flow crosses the southern portions of the satellite view. Both of these circulations contribute to spin up the central vorticity maximum as it translates eastward. Near the end of the animation, moisture elements poleward of the vorticity maximum are stationary in the earth frame of reference. When this occurs, the vorticity maximum graduates to an upper low. The satellite image is dominated by upper ridges in regions to the right of the axes of maximum winds. The vorticity maximum is caged within the sharp and deep cyclonic eddy.
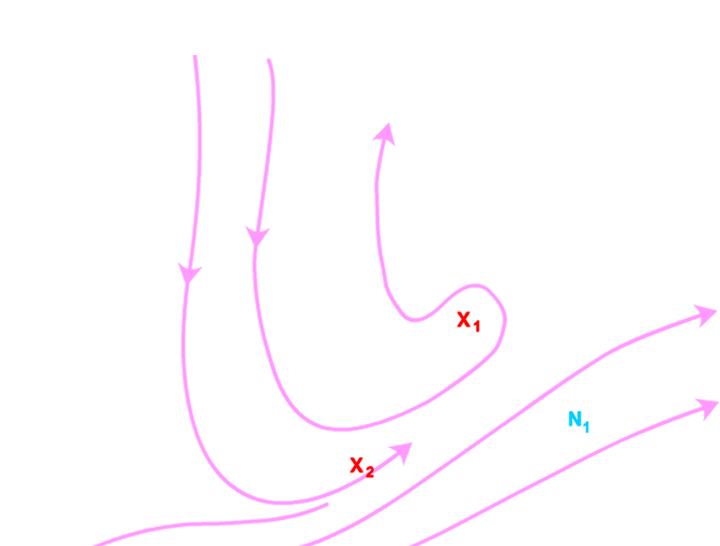
The Comma
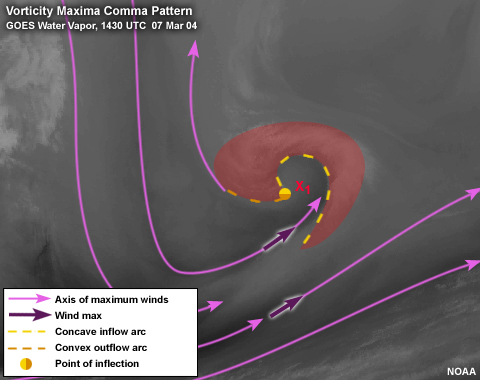
Let's focus in on the largest comma. Some key points here are:
- The dominant vorticity maximum is to the left of the associated flow looking downstream. The associated wind maximum can be seen as darkening in the dry surge of the comma pattern.
- The point of inflection and the vorticity maximum is located at the cusp of the moisture pattern as this vorticity maximum is dominated by rotation and equatorward shear. Of these two components, rotation is by far the largest contributor to the total vorticity.
- The point of inflection has already completed a cyclonic rotation of 270 degrees. Obvious rotation around the centre of cloud rotation as seen here can be the result of a strong vorticity centre, an older vorticity centre, or a combination of both.
Moisture Patterns

From a moisture edge perspective, in order to identify the vorticity maximum, you are typically interested in the concave or inflow arc of the cyclonic pattern.
X1
This comma pattern evolves into a strongly wrapped pattern. The sharp curvature of the axis of maximum winds wrapping around the vorticity maximum means that curvature vorticity is the main contributor to the strong vorticity maximum. Darkening in the surge area is associated with a wind maximum that will increase the vorticity of this centre even more.
X2
An axis of maximum winds carves a more southerly path into the base of the upper trof. The dry surge in the moisture edge is the evidence required to locate the new vorticity minimum at the cusp in the comma pattern.
N1 and N2
These anticommas are dominated by poleward shear. As a result, the centre of cloud rotation must be located at the interior point of inflection of the moisture signature.
The Vorticity Maxima Chain
Moisture edges related to deformation zones can also be used very effectively to infer subtle vorticity maxima. The characteristic "backward S" deformation zones can only be created by two vorticity maxima located at both ends of the moisture edge. A series of these subtle "backward S's" can be seen along a north-to-south line just to the west of the comma head. The points of inflection of each comma pattern are much more subtle than the deformation zones that reveal the weak cyclonic circulations.
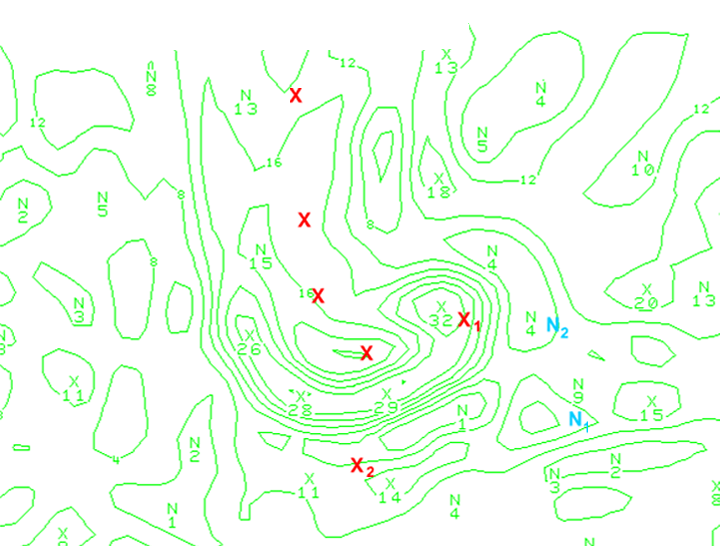
Comparison with NWP
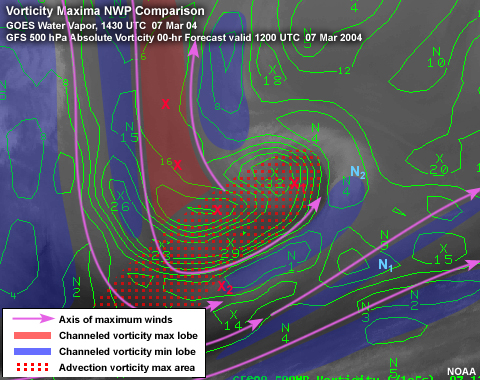
The NWP and observed vorticity centres X1, N1, and N2 correspond well. The NWP has identified a strong (32) vorticity maximum correlated with X1, but has misplaced it to the northwest. Both N1 and N2 are similarly displaced. These placement errors could be important for mesoscale applications.
The weakest part of the NWP solution is in the orientation of the axes of maximum winds spilling over the upper ridge. Using the WV imagery, two distinct and separate axes of maximum winds can be identified as comprising the broad flow. An edge of higher and colder cirrus cloud just east of the ridge can be used to locate a secondary axis of maximum winds. This particular wind axis can be followed along the cirrus edge into the trough, where it digs southeastward and spins up a new vorticity maximum.
In order to diagnose the NWP deficiencies in identifying the upper flow, it is easiest to consider channeled and advection flows.
- A channeled flow is straight. An elongated lobe of vorticity maxima will lie to the left of the flow, while an elongated lobe of vorticity minima will lie to the right of the flow looking downstream. Vorticity advection along a channeled flow is weak.
- An advection flow is curved. Curved flows typically advect significant
amounts of vorticity.
- If the flow curves cyclonically, the vorticity maximum is enhanced. The vorticity maximum area to the left of the cyclonically curved flow transforms into a more intense positive vorticity centre. Significant positive vorticity advection occurs downstream from this intense positive vorticity centre. The lobe of vorticity minima to the right of the flow weakens and is typically replaced by a short-wave trough as the flow becomes more cyclonically curved.
- If the flow turns anticyclonically, the vorticity minimum is enhanced. The vorticity minimum lobe to the right of the anticyclonically curved flow transforms into a more intense negative vorticity centre. Significant negative vorticity advection occurs downstream from this intense negative vorticity centre. The lobe of vorticity maxima to the left of the flow weakens and is typically replaced by a short-wave ridge as the flow becomes more anticyclonically curved.
In the accompanying graphic, red and blue shaded lobes of channeled vorticity straddle the axes of maximum winds identified from WV imagery. The orientation of the NWP vorticity lobes is more northwesterly compared to the northerly orientation of the axes of maximum winds identified from WV imagery. The red stippling is used to identify an area of significant cyclonic curvature and positive vorticity advection (PVA).
Implications
The correct placement of vorticity maxima is vital to the placement of related dynamic features such as the axis of maximum winds and deformation zones. All of these dynamic features must fit cohesively into the atmospheric puzzle. The correct placement of a vorticity maximum might be the piece of the puzzle required to correctly identify and place other dynamic features.
Here are some important attributes of vorticity maxima to keep in mind when identifying them:
- Circulations around vorticity maxima are typically strong. As a result, numerical analyses of the atmosphere are typically successful in their placement and appropriate relative intensity. However, if numerical analyses should misplace or not analyze a vorticity maximum, the implications on the predictions could be important.
- Cyclonic circulations tend to be rather moist.
- Correctly identifying and locating vorticity maxima can help better predict convection and cloud patterns.
- Convective feedback in numerical models can generate spurious vorticity maxima that can be identified as inappropriate through a careful analysis of the WV imagery.
Examples
Example 1: Pure Rotation
Here are a few examples of vorticity maxima. As is often true on the forecast desk, cases are not always as straight forward as the conceptual models. These real-world cases may not be the best examples of vorticity minima, but then how often do you see any perfect examples at the desk.
Carefully examine the loop before doing the analysis. Be sure to compare your analysis to the ones provided.
Satellite Loop
Within this GOES 4-km water vapor loop, look for the the development of a vorticity maximum dominated by rotation.
After viewing the loop, click the Your Analysis tab to access the last image of the loop (1245 UTC) and mark the location of the vorticity maxima, any associated vorticity minima, and any axes of maximum winds.
Your Analysis
The following exercise cannot be completed in Internet Explorer 11 or older versions. Please use Microsoft Edge or other modern browsers to complete this exercise.
Mark the location of the most prominent vorticity maxima, vorticity minima, and axes of maximum winds within the highlighted area.
Click the Done button to compare your analysis to the "Expert's Analysis".

Draggable Elements:
Vorticity minima:
Vorticity maxima:
| Tool: | Tool Size: | Color: |
|---|---|---|
|
|
|
Within the highlighted area, there are two highly curved axes of maximum winds that are defined by dark WV vapor channels. Vorticity maximum X1, located at the point of inflection, is dominated by curvature vorticity and is paired with two ill-defined vorticity minima to the right of the flow.

Closer examination of the loop reveals a weaker axis of maximum winds that curls into the circulation around X1. Two weaker vorticity centers, X2 and X3, are located to the left of this flow and indentified by small comma patterns. These small vorticity centers could be important as they track around the stronger center, X1.

Another axis of maximum winds approaching from the northwest completes the analysis. A diffuse comma pattern and vorticity maximum, X4, can be identified. The deformation zones that explain the cloud banding can be used to confirm the placement of these vorticity centers.

Looking at the GFS90
500-hPa
absolute
vorticity for 30
minutes prior to the analyzed satellite
image reveals that
the NWP placement of X1 is too far west.
This error is only
partly explained by the 30-minute time
difference. The rest
may be explained by lack of data over the
ocean.
Shifting the paired X1-N1 and N2 centers
eastward results in
a better match suggesting the NWP is too
slow with the upper
trough and associated jets. Generally, the
axes of maximum
winds are straddled by vorticity pairs.
Placement of X3 and
X4 is excellent.
Example 2: Equatorial Shear
Carefully examine the loop before doing the analysis. Be sure to compare your analysis to the ones provided.
Satellite Loop
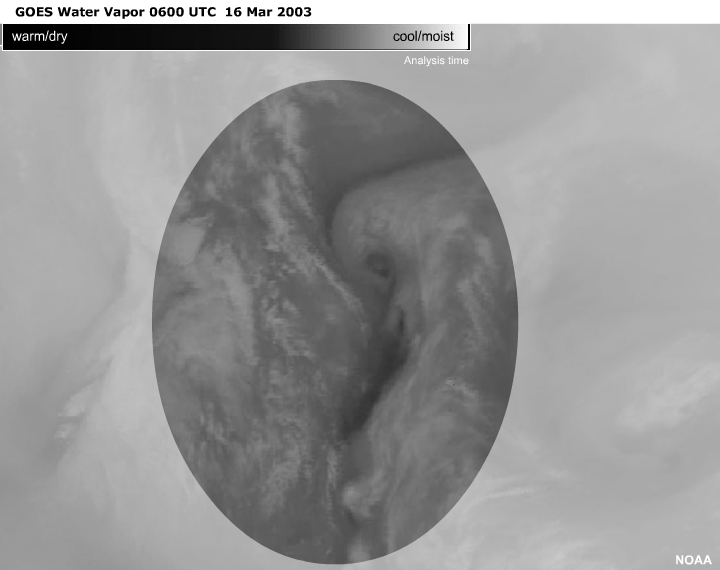
Within this GOES 4-km water vapor loop, look for the the development of a vorticity maximum with equatorial shear.
After viewing the loop, click the Your Analysis tab to access the last image of the loop (0600 UTC) and mark the location of the vorticity maxima, any associated vorticity minima, and any axes of maximum winds.
Your Analysis
The following exercise cannot be completed in Internet Explorer 11 or older versions. Please use Microsoft Edge or other modern browsers to complete this exercise.
Mark the location of the most prominent vorticity maxima, vorticity minima, and axes of maximum winds within the highlighted area.
Click the Done button to compare your analysis to the "Expert's Analysis".

Draggable Elements:
Vorticity minima:
Vorticity maxima:
| Tool: | Tool Size: | Color: |
|---|---|---|
|
|
|
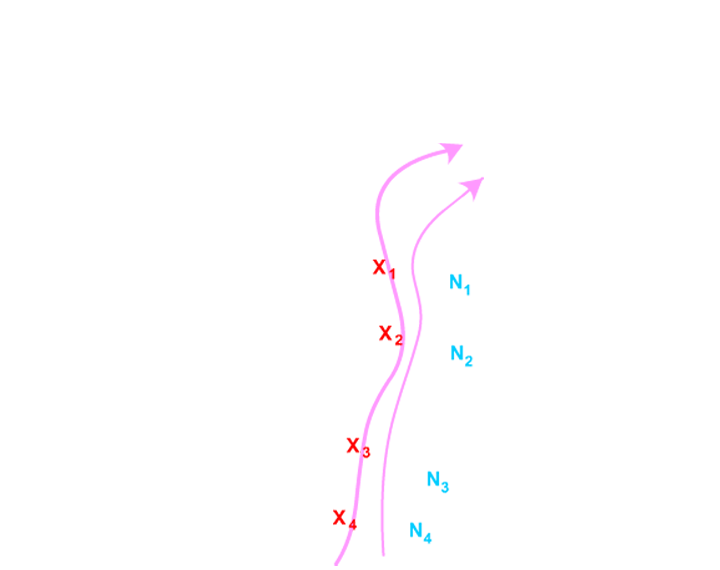
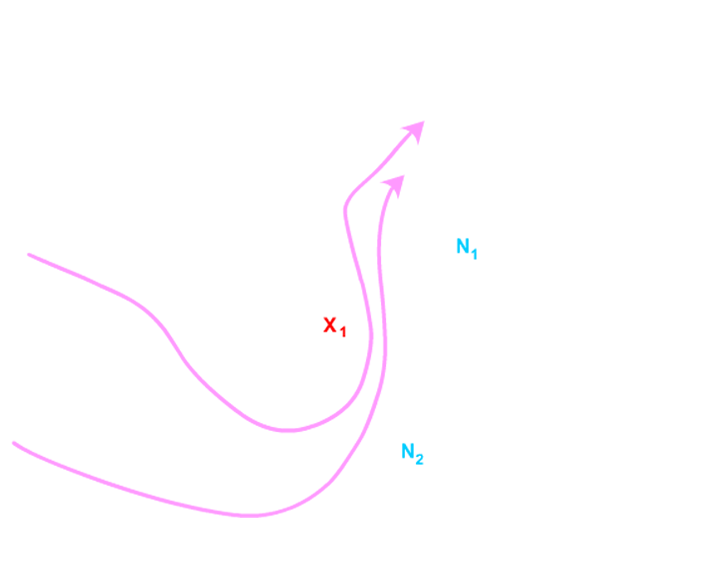
A straight southerly flow of moisture is centered within the hightlighted area. Vorticity maxima and minima pairs straddle wind maxima that are embedded along the axis of maximum winds. The vorticity minima are very challenging to locate but can be estimated to lie on the opposite side of the flow from each of the vorticity maxima.
Closer examination of the final frames of the loop reveal that moisture to the north of the largest and oldest vorticity maximum, X1, is moving westward with respect to the earth's surface. This vorticity maximum has evolved into an upper low.

Examination of the final frames of the loop also reveals that upstream moisture is being stretched along the deformation zones associated with each vorticity maxima, but most notablty with X1 and X2. Vorticity center X4 focuses significant convection.
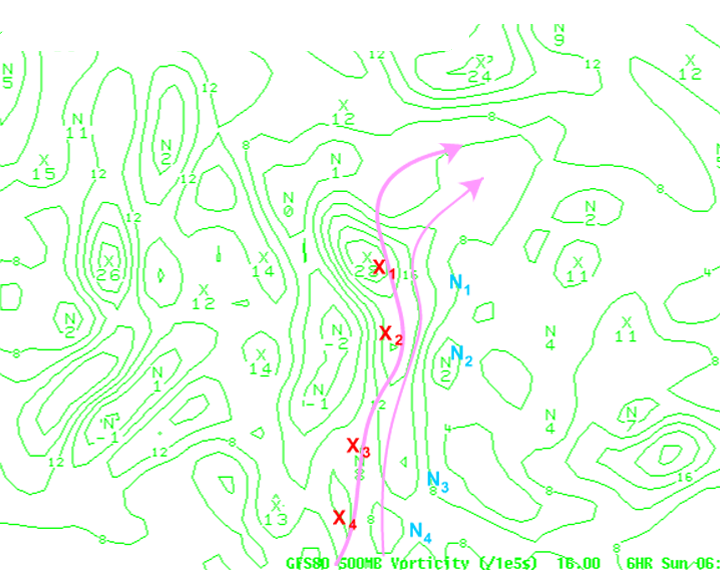
Looking at the GFS80 500-hPa absolute vorticity shows an acceptable correlation. X1 is excellent, while the NWP vorticity minimum is displaced northeast from N1. NWP has the southern third of the trough advanced too far to the east. As a result, the NWP would have misplaced the convection to the east of where it actually occurred.
Example 3: Poleward Shear
Carefully examine the loop before doing the analysis. Be sure to compare your analysis to the ones provided.
Satellite Loop
Within this GOES 4-km water vapor loop, look for the the development of a vorticity maximum with poleward shear.
After viewing the loop, click the Your Analysis tab to access the last image of the loop (0115 UTC) and mark the location of the vorticity maxima, any associated vorticity minima, and any axes of maximum winds.
Your Analysis
The following exercise cannot be completed in Internet Explorer 11 or older versions. Please use Microsoft Edge or other modern browsers to complete this exercise.
Mark the location of the most prominent vorticity maxima, vorticity minima, and axes of maximum winds within the highlighted area.
Click the Done button to compare your analysis to the "Expert's Analysis".

Draggable Elements:
Vorticity minima:
Vorticity maxima:
| Tool: | Tool Size: | Color: |
|---|---|---|
|
|
|

A broad northeasterly flow
divides
the
highlighted area.
X1 is driven by poleward shear as it drifts
southeastward.
Moisture elements to the north of X1 are
moving westward
while moisture elements to the south are
nearly stationary
or moving slowly northeastward. This
indicates that the X1
is an upper low.
N1 is nearly stationary as it rotates
anticyclonically.
Moisture elements translating westward to
the south of N1
identify that N1 has graduated to an upper
high circulation
and is dominated by rotational vorticity.
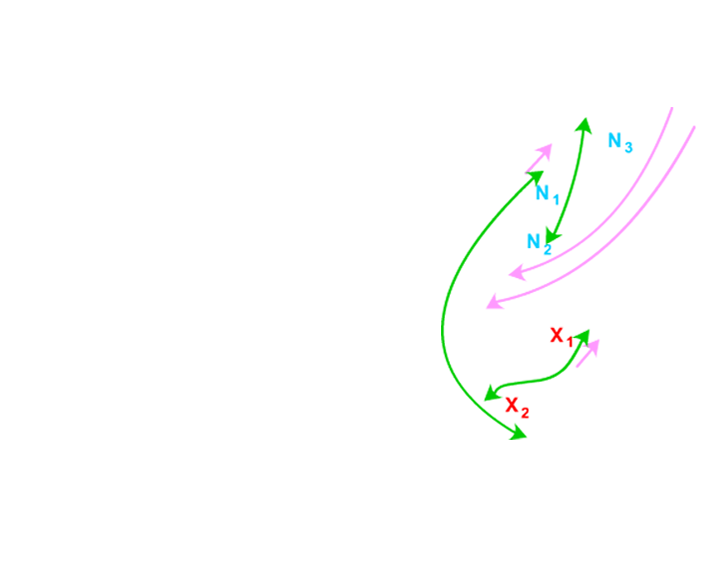
Closer examination reveals
that two
northeasterly axes of
maximum winds comprise the braod flow.
The southern axis looks as though it had
much earlier spun
up vorticity maximum X2. A "backward S"
moisture boundary
joins these vorticity maxima.
The northern axis can be correlated with
equatorial shear,
suggesting a secondary vorticity minimum N2
at the cusp of
the moisture edge. An "S-shaped" moisture
boundary links the
two subtle vorticity minima, N2 and N3.
A concave moisture boundary links X2 and N1
and marks the
weatern boundary of the northeasterly flow.
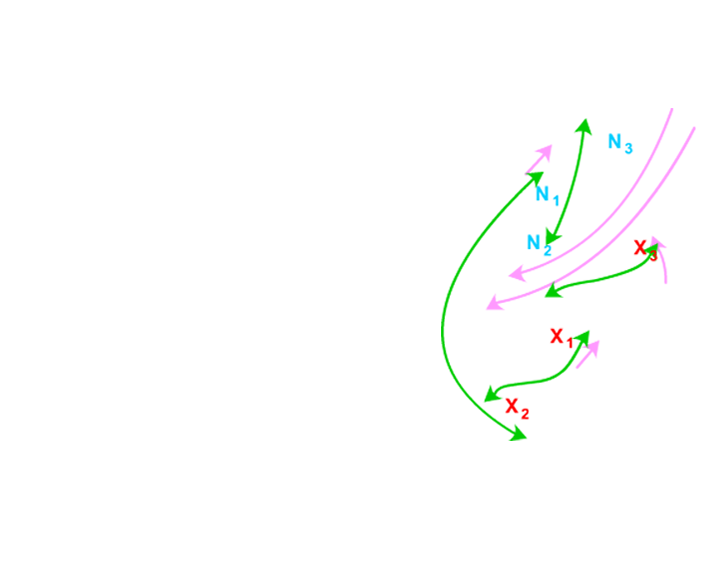
Close examination reveals
X3
drifting
westward with the
flow. Early in the animation the patterns is
that of a
vorticity maximum dominated by poleward
shear, with the
vorticity maximum at the well defined
interior flex point.
By the end of the animation the point of
inflection is
marked by colder cloud, while the comma head
is warmer and
possibly lower.
Another "backwards S" moisture boundary
joins X1 and X3.
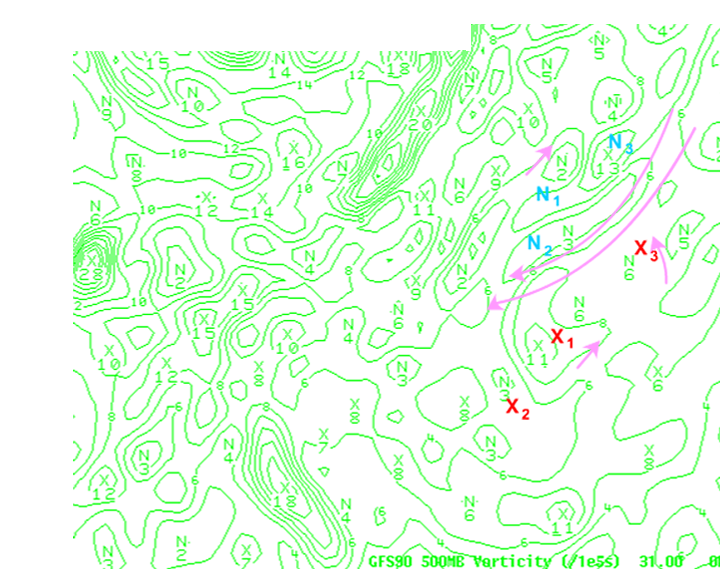
The analysis window is over
the
relatively
data-sparse
western Atlantic. Considering this, X1 is
well placed in the
GFS90 500-hPa.
X2, which is not resolved well by the NWP,
is located
between two vorticity minima to the east of
the NWP
position. Similarly, X3 is located between
two vorticity
minima.
The meteorologist's positioning of the
vorticity centers can
still add significant improvement to
diagnosis of the
atmospheric flows, especially over
data-sparse regions.
This concludes Vorticity Maxima and Comma Patterns, please take a few minutes to take the Quiz, and then fill out our User Survey.
Contributors
Comet Sponsors
- National Oceanic and Atmospheric Administration (NOAA)
- National Weather Service (NWS)
- Naval Meteorology and Oceanography Command (NMOC)
- Air Force Weather Agency (AFWA)
- National Environmental Satellite Data and Information Service (NESDIS)
- Environment Canada - Meteorological Service of Canada (MSC)
- Australian Bureau of Meteorology (BoM)
Principal Science Advisor
- Phil Chadwick — MSC
Project Lead
- Bruce Muller — UCAR/COMET
Instructional Design
- Bruce Muller — UCAR/COMET
Computer Graphics/Interface Design
- Steve Deyo — UCAR/COMET
- Heidi Godsil — UCAR/COMET
Multimedia Anchoring
- Bruce Muller — UCAR/COMET
- Dan Riter — UCAR/COMET
Data Provided by
- NWS - NOAA
COMET HTML Integration Team 2019
- Tim Alberta — Project Manager
- Dolores Kiessling — Project Lead
- Steve Deyo — Graphic Artist
- Jordan Goodridge — Student Assistant/Web Developer
- Gary Pacheco — Lead Web Developer
- David Russi — Translations
- Gretchen Williams — Web Developer
- Alex Sheehan — Web Developer
- Tyler Winstead — Web Developer
COMET Staff
Director
- Dr. Timothy Spangler
Deputy Director
- Dr. Joe Lamos
Business Manager/Supervisor of Administration
- Elizabeth Lessard
Administration
- Lorrie Alberta
- Linda Korsgaard
- David Russi
- Bonnie Slagel
Graphics/Media Production
- Steve Deyo
- Heidi Godsil
- Seth Lamos
Hardware/Software Support and Programming
- Tim Alberta (IT Manager)
- James Hamm
- Karl Hanzel
- Ken Kim
- Mark Mulholland
- Dan Riter
- Carl Whitehurst
- Malte Winkler (student)
Instructional Design
- Patrick Parrish (Production Manager)
- Dr. Alan Bol
- Lon Goldstein
- Dr. Vickie Johnson
- Bruce Muller
- Dwight Owens
- Dr. Sherwood Wang
Meteorologists
- Dr. Greg Byrd (Project Cluster Manager)
- Wendy Schreiber-Abshire (Project Cluster Manager)
- Dr. William Bua
- Patrick Dills
- Tom Dulong
- Dr. Stephen Jascourt
- Matthew Kelsch
- Dolores Kiessling
- Dr. Arlene Laing
- Elizabeth Mulvihill Page
- Dr. Doug Wesley
Software Testing/Quality Assurance/Copyrights Administration
- Michael Smith (Coordinator)
NOAA/National Weather Service - Forecast Decision Training Branch
- Anthony Mostek (NWS COMET Branch Chief [acting] and Satellite Training Leader)
- Dr. Richard Koehler (Hydrology Training Lead)
- Brian Motta (IFPS Training)
- Dr. Robert Rozumalski (SOO Science and Training Resource [SOO/STRC] Coordinator)
- Shannon White (AWIPS Training)
Meteorological Service of Canada Visiting Meteorologists
- Phil Chadwick
- James Cummine