Print Version
2. Setup Conditions
2.1 Background
2.2 Evaluating the Setup Stage
2.3 Drying
Mechanisms
2.3.1 East and Central U.S.
a. Patterns
b. Exercise
2.3.2 Interior West
2.3.3 Coastal
West
2.3.4 Alaska
3. Fuels and Fire Danger Ratings
3.1 Fuel Models
3.2 Live Fuel Moistures
3.3 "Dry"
Thresholds
3.4 Critical Setups
3.4.1 Light Fuels
3.4.2 Heavy
Fuels
3.5 Fire Danger Ratings
3.6
Ratings Systems
4. Fire Weather and Fuels Data and Guidance Products
4.1
General Guidance
4.2 Fuel Readiness
4.3 Growth Status
4.4 Exercise 1
4.5 Exercise 2
5. Situational Awareness
5.1 Building Awareness
5.2 Awareness Practices
5.3 Example
5.4 Exercise
This module addresses the transition between low and high fire danger, effectively known as the fire setup stage. Fire weather focal points and Incident Meteorologists (IMETs) should have the knowledge needed to identify changes in fuel conditions and the effects of long- and short-term weather patterns. This knowledge will allow them to disseminate pertinent information to the rest of the forecast staff, in turn allowing for better preparation of effective forecast and warning products. A variety of fire weather and fuels-related data and guidance sources are employed to demonstrate how to evaluate the current fire danger across a particular area.
At the end of this module you should be able to:
-
Describe the fire “setup” stage and identify weather patterns that lead to fuel dryness.
-
Understand fuel dryness evolution and how it relates to the National Fire Danger Rating System (NFDRS).
-
Describe specific fire weather and fuel data sources that aid in determining fuel susceptibility.
-
Apply situational awareness concepts to fire weather forecasting operations.
As part of the NWS Advanced Fire Weather Forecasters Course, this module focuses on the setup stage and the condition of the fire environment to support fire ignition and spread. It provides background information for other modules addressing critical fire weather climatology and fire behavior. Typical weather and fuel conditions in four regions of the U.S. are used to illustrate common drying mechanisms and to identify unique regional conditions. The module also introduces weather and fuels data used to evaluate the fire danger and discusses the importance of maintaining good situational awareness throughout the forecast process.
2. Setup Conditions
Conditions have been dry: no rain, lots of wind, sunshine, and hot days. To a fire weather forecaster, this weather pattern suggests that fuels are drying out and will most likely set up higher fire danger levels. Fire danger, resulting from the status of fuels, determines fire ignition, spread, and intensity levels over a specific area. A forecaster begins the fire weather forecast process by considering the current situation and determining specific regions and conditions of concern.
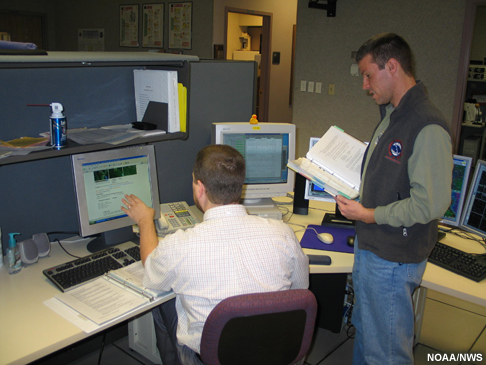
Fire weather forecasters need to look at many factors—fuel conditions as well as past, current, and expected weather—to assess the environmental setup for fires.
2.2 Evaluating the Setup Stage
Some questions a fire weather forecaster or IMET might consider include:
- What drying mechanisms are in place?
- How have long-term conditions affected the fire danger?
- How have more recent conditions modified the fire danger?
- What is the current fuel loading and curing state of the fuels?
- What are the normal fuel conditions for this time of year?
- Am I expecting any critical patterns to set up?
- Is fire activity increasing in terms of ignitions, spread, and intensity?
These questions are typical of those addressed by fire weather forecasters in evaluating the setup stage for fire danger. To assess the setup stage, the fire weather program leader will look at fuel and weather data produced on a daily or weekly basis by various sources. He or she will use established knowledge and also consult with various local land agency officials to determine the status of fuels in the area. Fuel susceptibility to fire ignition, spread, and intensity will be gauged and disseminated to the rest of the forecast staff in accordance with local or regional policy. The forecast staff will then use this information to identify problem areas within their forecast area of responsibility, paying particular attention to critical weather thresholds when preparing humidity, temperature, and wind forecasts for the focus area. Knowing the fuel susceptibility and potential problem areas will increase the forecasters' awareness of the fire danger situation. Forecast products benefiting most from this knowledge include Red Flag Warnings and Fire Weather Watches as well as fire weather discussions found within zone and spot forecasts.
Fire danger is often most difficult to predict during the transition period between the setup stage and full-blown fire season. Staffing levels within land agency departments may not be at full capacity during this period. Furthermore, complex terrain across a particular area adds an elevation component and different plant species exhibit different growth cycles. Adding forecast value by providing a weather emphasis that highlights increasing fire danger during this time period significantly benefits customers and other agency partners.
In the following examples and exercises, you will explore the setup stage to support the ignition and spread of fire. You will examine typical weather and fuel conditions in four regions of the U.S. to be able to assess typically-occurring drying mechanisms as well as unique regional conditions. A number of Fire Weather and Fuels Data and Guidance Products are available as tools for this process.
Basic patterns
- Seasonal surface highs (generally summer)
- Building upper-level ridges (spring/early summer)
- Blocking mechanisms that cut off moisture (entire year)
- Dry cold fronts (entire year)
2.3.1a East and Central U.S. — Patterns
Dry Cold Fronts
East of the Rocky Mountains, a frequent occurrence of dry or nearly dry cold frontal passages over a fairly long timeframe is the main means of drying fuels. The main period of concern for this type of pattern coincides with the timeframe leading up to the primary fire season. This timeframe typically includes the fall and winter/early spring seasons when deciduous leaves are off or are in the early growth stage. Leaf-off allows more solar radiation to reach the ground and provides less shelter from the wind. These factors contribute to more efficient drying under certain weather patterns. The dry cold front occurrence is magnified by an upper-level blocking pattern but can also be associated with a zonal or meridional wave structure. Short-wave trains caught in west/northwest flow can also be associated with dry cold fronts. This pattern is less likely to occur during the summer across southern latitudes but is still common across the far northern latitudes of the contiguous U.S. The key to this drying mechanism is its persistent nature, as well as the orientation of the flow. Persistent northwest flow over a long period reduces residence time and the magnitude of the return flow moisture from the Gulf of Mexico and the Atlantic. The relatively cooler air mass found under this northwest flow can be accompanied by much lower dewpoint readings. This pattern can keep humidities low during fuel dormancy or lead to a reduced growth period.
Bermuda surface high
Another fuel-drying mechanism occurring in the eastern U.S. relates to the position of the Bermuda surface high. The building of the Bermuda surface high typically occurs in late spring with the breakdown of the pattern occurring in early fall. Its persistence over a particular geographic region can lead to drought conditions and well above normal temperatures. This pattern limits moisture intrusions from the Gulf of Mexico and the Atlantic Ocean. Subsidence associated with the Bermuda anticyclone limits thunderstorm potential, exacerbating the dry conditions. The feedback response includes lower surface humidity, lower soil moisture values, and subsequent reduced evapo-transpiration from dying or nearly cured vegetation. Short periods of breeziness can occur as a weakened surface cold front nears the area from the west/northwest, increasing fire danger. If a front moves through, it can bring cooler temperatures, a chance of widely scattered showers, and increases in relative humidity.
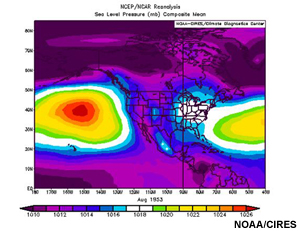
The following images show the 500-mb geopotential height and sea level pressure for August 1953. Moisture from the Gulf of Mexico is effectively cut off from the northeastern U.S.

(Click images above to open a larger version in a window.)
Composite mean 500-mb height and sea level pressure data are shown for August 1953. During this time, a persistent extension of the Bermuda high pressure cell occurred across portions of the Mid Atlantic/Northeast and the Ohio River valley. Dry and warm conditions developed and raised fire danger across the Northeast.
2.3.1b East and Central U.S. — Exercise
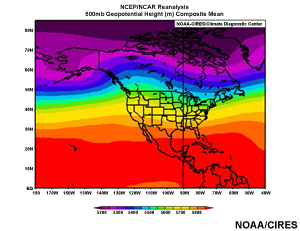
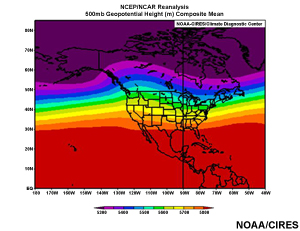
Examine the following scenario and explain its likely effects on weather patterns and fuel/fire conditions across the southern United States.
(Click images above to open a larger version in a window.)
The 500-mb height data for these time periods suggests a slightly meridional upper-level wave pattern with a semi-permanent ridge over the interior West and a semi-permanent trough over the interior East.
(Click image above to open animation in a window.)
(Click image above to open animation in a window.)
(Click image above to open animation in a window.)
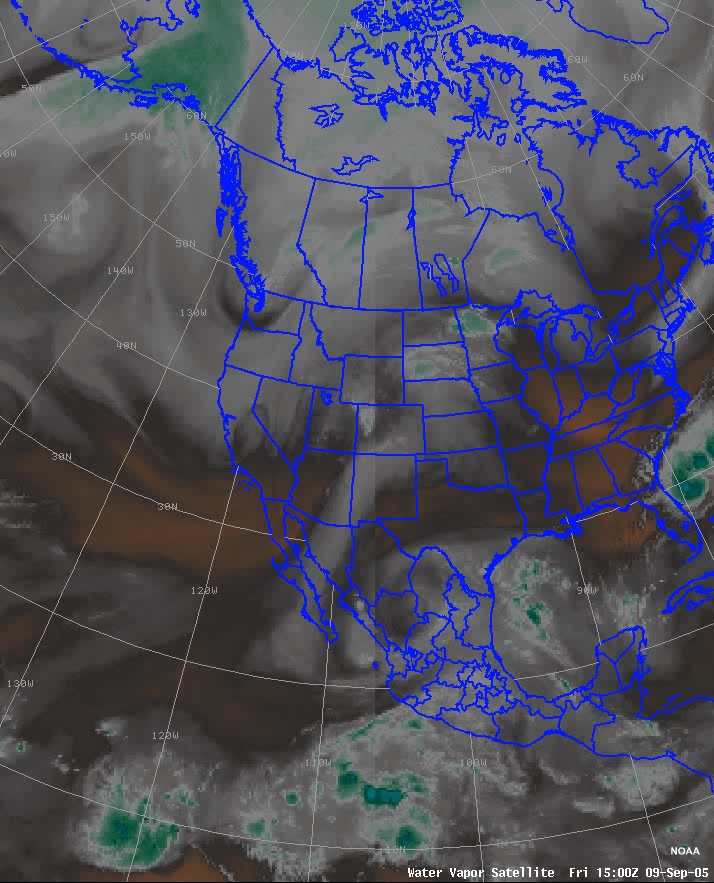
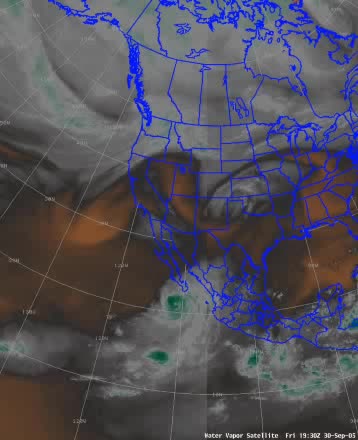
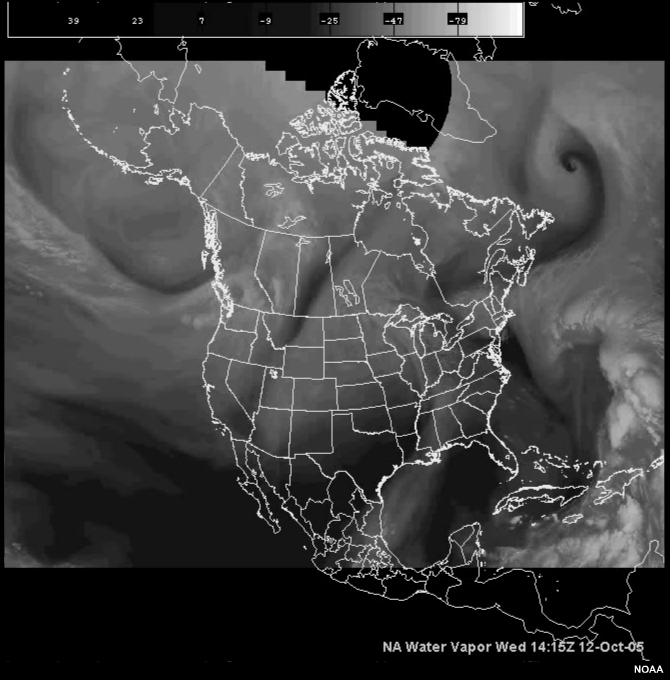
Loops of water vapor imagery provide information on the movement of storm systems across in U.S. during September and October 2005.
Questions to consider:
How will this upper-level pattern affect moisture flow across south central portions of the U.S.?
What do the 500-mb height data and water vapor imagery indicate as far as weather patterns in the southern and southeastern U.S.?
How will this upper-level pattern affect storm movement and precipitation?
What does this pattern mean for fire danger conditions in the region?
Explanation:
The composite 500-mb height data is aligned with a rather persistent pattern in which northwest tracking systems developed and moved over the south central U.S. every three to four days. This pattern lasted over a long period of time. As can be seen in the water vapor imagery for September and October 2005, the flow over the southern plains region essentially cut off moisture from the Gulf of Mexico. The systems were fairly dry and didn't allow sufficient moistening of the boundary layer. As a result, the fronts brought little or no rain and increased winds ahead of and behind the frontal passage. Ahead of the frontal passage, the region experienced warming under southerly flow, and behind the front, drier air masses were advected from high pressure source regions. The water vapor imagery also illustrates that, beginning in September, a drier zonal flow was in place over the U.S. During the timeframe from September into October, the storm centers followed a more northerly latitudinal track, progressing over the Great Lakes region or farther north over the Canadian provinces.
Result:
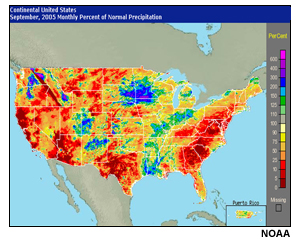
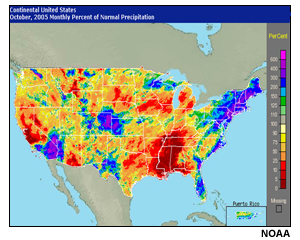
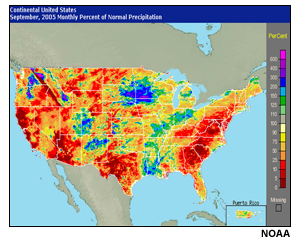
Precipitation over the southern U.S. was below normal for all months through the end of 2005. This pattern set up a dry fuels environment and raised the fire danger across the region.
(Click images above to open a larger version in a window.)
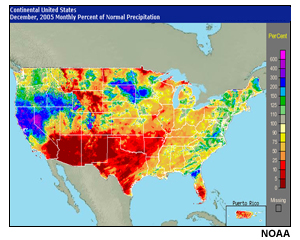
Percent of normal precipitation for September, October, November, and December, 2005. During this time period, precipitation in the southern U.S. was below normal, with extremely below normal values occurring in the southern plains and southwest regions.
2.3.2 Most of the western United States (Interior West) - Patterns
Building of upper-level ridge/Dry cold fronts
Across most of the western U.S., the main drying mechanism is the combination of dry or nearly dry cold fronts with a building of the upper-level ridge. Dry or nearly dry cold front passages increase winds and can sublimate pre-existing snowpack or dry out the soils and duff layer. This pattern typically occurs during the late winter and spring months across the southern latitudes and during the spring and early summer months across the northern latitudes.
The initial strengthening of the subtropical high usually occurs in May and June as it builds northward from Mexico, aided by the Pacific trough. During this period, moisture originating from the Gulf of Mexico, Gulf of California, and the Pacific is limited as it tries to flow around the subtropical high. Temperatures warm to well above seasonal levels underneath the upper ridge, and humidity recoveries are poor, leading to extra curing time for fuels. An intense mid-level dry slot, typically centered around 700 mb, is generally found on the west/northwest sector of the building upper ridge and is an important component for poor humidity recovery across the upper elevations. As moisture pools over northern Mexico during the month of June, the eventual northward strengthening of the subtropical high will lead to increased convective activity in the southwest portions of the U.S. by late June and early July. Periodic moisture “bursts” propagate northward and clockwise around the closed anticyclone and sufficiently moisten the boundary layer. This advection of moisture effectively ends fire season across the Southwest. The mid-level dry slot propagates northward during the months of July and August as the subtropical ridge continues to strengthen and sometimes joins with the Bermuda anticyclone. At the same time, periodic moisture bursts originating from the southwestern U.S. will affect the rest of the West. These bursts tend to be short lived, with warm and dry conditions usually returning under the upper ridge.
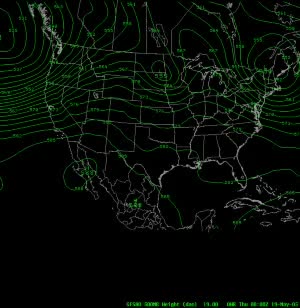
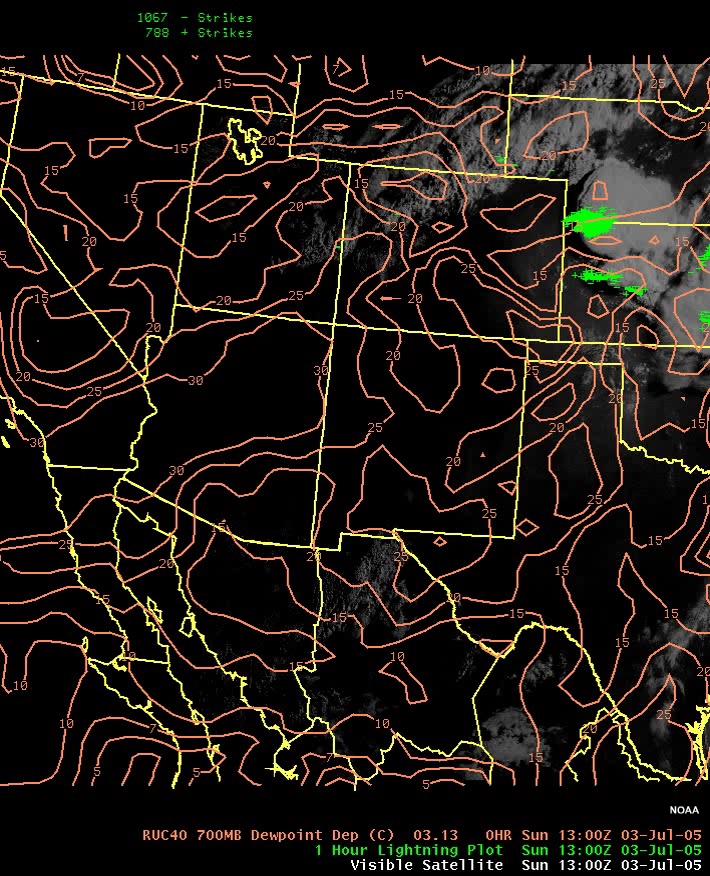
(Click images above to open animations in a window.)
The 500-mb height data illustrate a ridge building across the western U.S.
Visible imagery from satellite overlaid with Rapid Update Cycle (RUC) 700-mb dewpoint depression data shows the lack of moisture flow over the western and southwestern U.S.
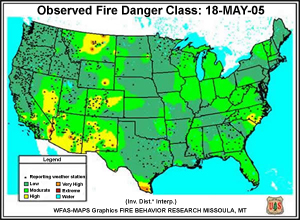
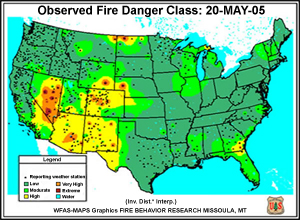
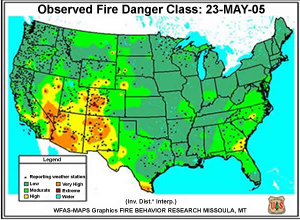
The graphics in this example illustrate the ridge-building evolution and its effect on fire danger during the spring 2005 season across the Southwest. Note the long residence time of the mid-level dry slot over portions of the Southwest, as well as a rise in heights. Also note the northward progression of increased fire danger during the same time period. As the ridge persists, the fire danger increases in Nevada, Arizona, New Mexico, and Colorado, becoming "very high" in many areas throughout this region.
2.3.3 California and coastal areas of Washington and Oregon (Coastal West)
Subtropical high
The primary fire season across the coastal West is mainly the fall. Based on surface fuel and growing season characteristics, the summer to early fall timeframe is the main setup period. The summer "heat wave" pattern for much of the coastal West results from a semi-permanent, strong subtropical high located over the Sierra Nevada mountain range. Climatologically, widespread measurable precipitation is rare during the months of June, July, and August across coastal areas of California. Pacific storm systems tend to be shunted northward by the blocking subtropical ridge, though significant shortwaves will occasionally bring substantial precipitation to far northern California and the Pacific Northwest. Moisture "bursts" originating from the Southwest occasionally rotate around the subtropical high during the months of July and August and can affect coastal areas. The frequency of occurrence for these significant precipitation events is low; in some years, they do not occur at all.
Onshore flow
During the dry season, prevailing westerlies off the Pacific Ocean bring persistent periods of onshore flow across the western coastal areas. Onshore flow contains much higher humidity values and keeps the lowland coastal fuels from drying out despite generally meager coastal precipitation. A strong midlevel dry slot exists above the marine inversion and ultimately helps cure the upper elevation surface fuel bed. As summer transitions into fall, cold frontal passages originating from the Pacific become more robust and increase in frequency. Closed low translations can also occur and provide significant precipitation to much of the coastal West. These closed low systems can delay or significantly shorten the fall fire season.
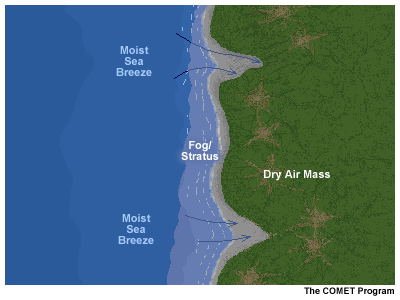
Onshore flow brings moist air to lower elevations and helps keep lowland fuels from drying out.
Offshore flow
Offshore flow events follow frontal passages during the late summer and fall. These events enhance fuel dryness by increasing winds and promoting long residence times of low humidity. An offshore event can occur over a short or long period of time. These events are created when high surface pressure builds across the interior of the Pacific Northwest and Great Basin. Many of these events, including the Santa Ana winds affecting southern California, take shape as downslope winds. Due to the nature of fuels and extreme dryness associated with these events, shrub and grass fuels dry substantially and fire danger increases rapidly. It only takes a few of these offshore events in combination with a normally dry summer to produce very high to extreme fire danger ratings along the coast. These wind events transition to significant critical fire weather events when the fuels have been fully dried out. The frequency and duration of these offshore events greatly influence the setup stage. Longer duration or high frequency events can lead to a quicker transition to the primary fire season.
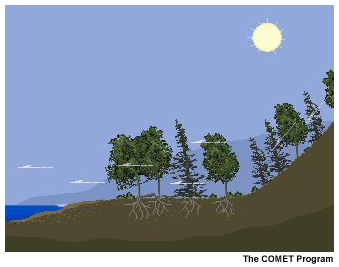
Offshore flow brings drier air as well as higher wind speeds. Both of these factors can dry out fuels.
Example
The data below illustrate how conditions became drier from June through September across the coastal areas of California during 2005. In normal years, this recurring dryness provides a precursor setup to the main fire season occurring in September and October. In October 2005, anomalously wet conditions associated with a robust closed low greatly suppressed fire danger and curtailed the fire season. When precipitation is scant during the fall of the year, fire season can be prolonged into the winter months, or a more severe season can occur.
(Click image above to open animation in a window.)
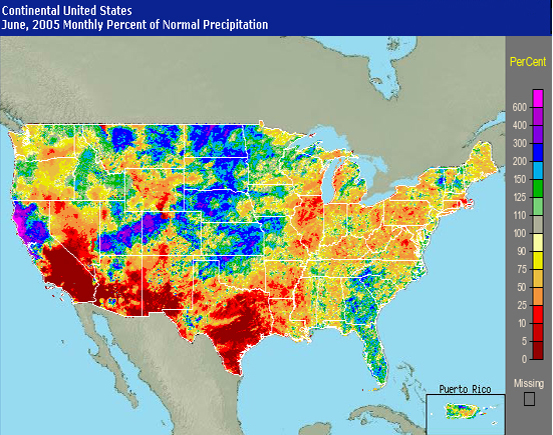
The color coding on the maps represents the percent of normal precipitation for the U.S. In June 2005, conditions in California are already quite dry. The dryness continues until October, when rainfall was above normal. November was a dry month, but the wetter October acted to suppress the fire season in the region.
Upper-level ridge
West coast and interior Alaska drying mechanisms involve a similar building of an upper-level ridge. This building occurs between April and mid-July and extends from Canada through southeast Alaska as the polar jet moves northward. Seasonally, April tends to be the driest month. The lack of moisture flow into the area typically continues until mid-July. The ridging results in dry, easterly flow, which in combination with solar heating due to increased hours of daylight, exacerbates the dry conditions. Closed lows in the Gulf of Alaska and the Aleutian Chain vicinity maintain the upper ridge until southwest flow develops in late July and August, ultimately breaking down the ridge and ending the drying season.
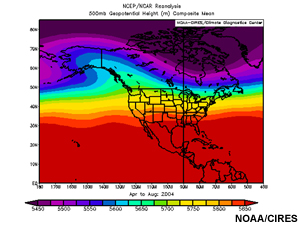
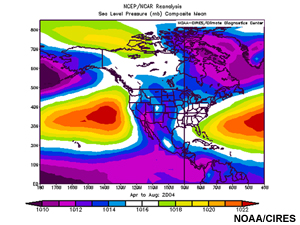

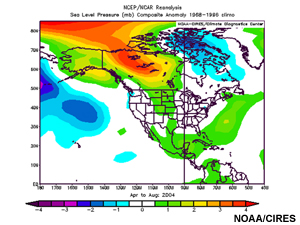
The two uppermost figures represent the 500-mb and sea level pressure composite means for April through August 2004 and indicate an area of high heights centered over southeastern Alaska and northwestern Canada. The two bottom plots show the composite anomalies for the same time period.
The 500-mb height data for April-August 2004 indicate an area of high heights persisting over northwest Canada. The ridging results in dry, easterly flow into most of the state of Alaska and also cuts off moisture flow into the region. As summer arrives, the northern latitudes experience more solar heating due to more direct sun angles and more hours of daylight. This weather pattern is effective at drying fuels in the region and increasing the area's susceptibility to fire. In 2004, the ridging persisted into August causing more drying than is typically observed. These extremely dry conditions resulted in the worst fire season ever recorded in Alaska.
The key factor in this critical fire weather setup was the delay in summer precipitation that usually arrives in mid-July. The high pressure ridge cut off moisture flow into the area, and conditions remained unusually dry well into the month of September.
3. Fuels and Fire Danger Ratings
The weather patterns described in previous sections for the different regions dry out fuels and ready them for fire. When your job is fire weather, how do you know what fuels are present in an area? How do you know that they have dried out and are fire-ready?
Understanding fuel readiness requires knowing at least a bit about the fuels present in an area. Fuels are combustible, fire-sustaining matter, made up of the various components of live and/or dead vegetation occurring on a site. These components include litter, duff layers, dead-down woody material, grasses, shrubs, regenerated growth, and timber, usually in various combinations. The major fuels are grouped by type and represented by a fuel model in fire danger rating systems as well as fire behavior models. This module will focus on the fuel models related to the fire danger rating system.
Fuel models represent the combustible, fire-sustaining matter present in the real world. In 1998, the National Fire Danger Rating System was updated to include 20 fuel models, 17 of which are mapped. These fuel models are summarized below.
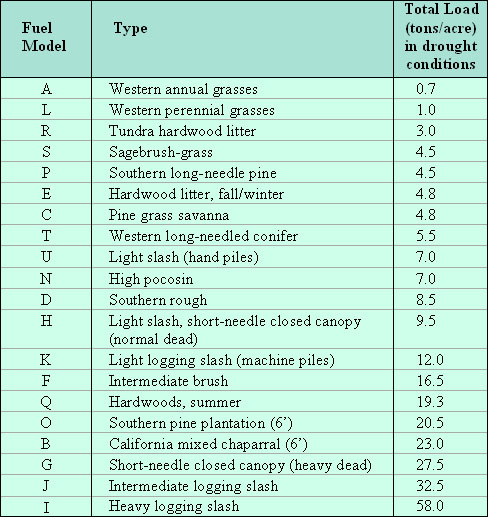
Based on Forest Encyclopedia Network, NFDRS Fuel Models by A. Long, and the National Fire Danger Rating System.
Each fuel model has a fuel loading value that depends on the fuel type and weather conditions. Fuel loading values give information on how quickly the material responds to weather changes. For dead 1-hour and 10-hour fuel loading calculations, the response depends on temperature, relative humidity, and cloudiness. For 100-hour fuel loading, 24-hour conditions, including maximum and minimum temperature and relative humidity, hours of precipitation, and day length, are used. Dead fuel moisture values are a function of time lag, specified as the time it takes a fuel particle to reach two-thirds of its way to equilibrium with its local environment. A fuel's time lag is proportional to its diameter: 1-hour fuels have less than 1/4-inch diameter, 10-hour fuels have 1/4- to 1-inch diameter, 100-hour fuels are between 1 inch and 3 inches, and 1000-hour fuels have diameters of 3 to 8 inches.
Live fuel moisture levels also need to be taken into account within fire danger rating systems. Live fuel moistures are best understood through the annual growth cycle, also known as the green-up period. Live fuel moistures within the National Fire Danger Rating System range from 50 to 200 percent, with fuel moisture levels below 50 percent corresponding to dead fuels. Live fuels act as a heat sink, requiring much higher ignition temperatures to preheat the fuel to a combustible state. As dry conditions persist, live fuel moistures will decrease. This decline is part of the curing process and ultimately leads to higher fuel susceptibility to fire ignition, spread, and intensity. This higher susceptibility results primarily from increased fuel loading due to the transition from live to dead.
The National Fire Danger Rating System separates live fuels into two categories. Fine fuels are considered to be herbaceous, while shrubs, branches, and foliage are categorized as woody fuels. For herbaceous fuels, the curing cycle depends on whether a plant species is annual or perennial. Annual plants start from seed, green up, and then eventually cure out and die. Perennial plants, in contrast, can green up several times depending on environmental conditions and cure out more slowly than annual plants.
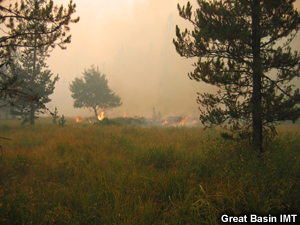
Herbaceous fuels include grasses and other fine fuels that can cure out quickly.
Woody live fuel moistures, on the other hand, tend not to rise or drop significantly over short timescales. Extreme weather patterns and certain vegetation types provide exceptions to this rule. For example, Santa Ana wind events lasting 18 hours or more can drop chaparral fuel moistures by 15 to 20 percent. Live fuel moisture thresholds for particular areas are available from land agency fuels specialists. Most chaparral, for instance, burn quite well at live fuel moistures of around 110 percent. When live fuel moistures decrease to around 75 percent, these fuels will burn very well.
Green-up is one of the major factors distinguishing fire season periods across the U.S., and can be affected significantly by drought. The primary fire season generally precedes green-up along the west coast and across central and eastern portions of the contiguous U.S. Primary fire season across most of the West and Alaska follows the green-up period, once surface fuels cure out.
Different fuels have different “dry” thresholds. During pre- and post-green-up, a critical fire weather pattern can generally create a fire event once a fire is initiated within a grass or other light fuel type. A significant period of dryness can lead to very large fire events, as happened in the southern plains region in 2005-2006. Fire can spread rapidly in these fuel types, because fuel moisture levels can be particularly low once the grasses have cured out for the season. The susceptibility of these fuels to fire events also depends on broadscale land use practices and compaction. Areas that experience significant amounts of grazing, for example, will have much lower fuel loading and less continuity.
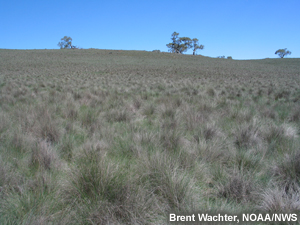
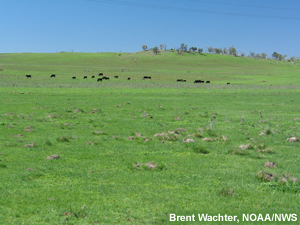
Abundant grass fuels provide a continuous surface fuel bed, increasing the chance of fire ignition and spread.
Across the road, cattle have grazed down the grasses allowing the remaining stems to green up. These grazed-down, green grasses would not support any fire spread or even fire ignition.
Compaction of grasses is generally due to snow cover, affecting fuels in northern latitudes as well as in higher elevations across the West. Compacted grasses have less air available to feed a fire and also break up the continuity, causing the fire to burn more slowly. A wet winter leads to more compaction but also provides more fuel loading after the green-up process is complete.
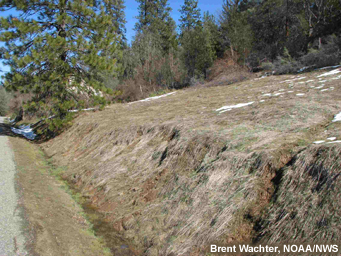
Heavy, wet snows during winter can compact grasses. Some of the grass stems will break, resulting in a discontinuous fuel bed.
3.4 Critical setups
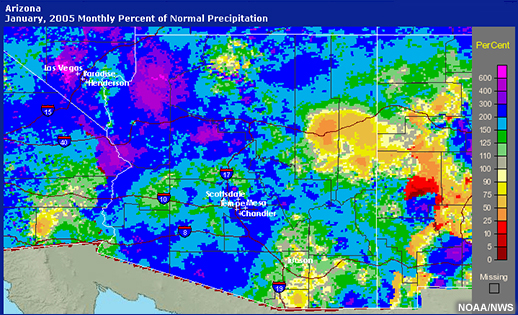
The critical setup pattern for grasses and other light fuels is a wet period followed by a dry period. The wet period promotes abundant growth while the dry period dries the fuels out. The effect can be cumulative and continue over successive years. For example, a wet spring or summer coinciding with the main green-up period for a particular geographic area, followed by a normal winter, can lead to two periods of abundant fuel growth. If that abundant fuel growth is followed by a long period of very dry conditions coinciding with the primary fire season for a particular area, the fire danger substantially increases. An example of this situation occurred in Arizona in 2005. Above normal precipitation fell across a large portion of Arizona during January and February. This moisture promoted significant green-up of grasses and other fine fuels across the lowland desert areas of Arizona during the spring growing season. The spring period was drier and these abundant fine fuels dried out during April and May. Large fires began to pop up in May and became more widespread during June and July.
The percent of normal precipitation is mapped for Arizona for January 2005. Precipitation amounts were much above normal in most of the western portion of the state.
The percent of normal precipitation is mapped for Arizona for February 2005. Precipitation amounts were much above normal in most of the western portion of the state.
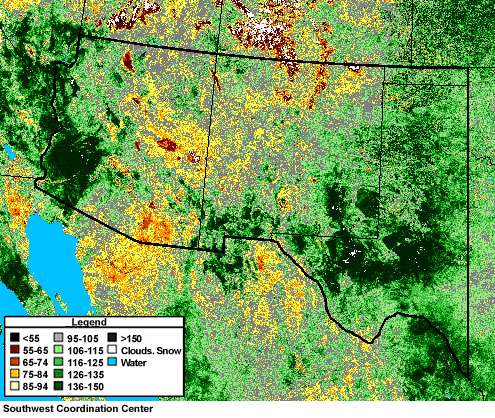
The map indicates the departure from normal greenness during April 2005. Significant departures were observed across a large portion of the lowland areas of southern and western Arizona.
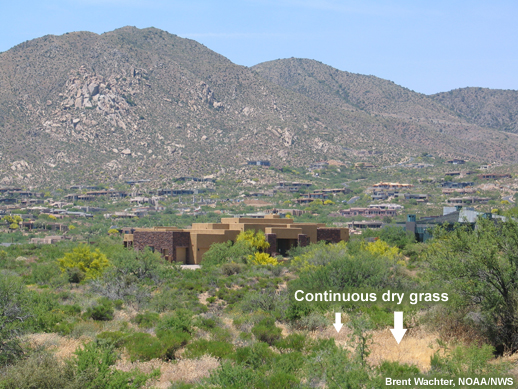
Grass growing in open areas between the shrubs provides a continuous surface fuel bed. In most years, grass loading is less and the fuel bed is less continuous in the desert environment. The significant grass loading in 2005 fueled fires that were difficult to control or contain.

This chaparral was at 135% live fuel moisture—above normal for late June. However, because the grass fuel loading was so significant, the fire intensity pre-heated the shrub and allowed it to burn. Heavy fuel loading led to unusually intense fires in the desert lowlands.
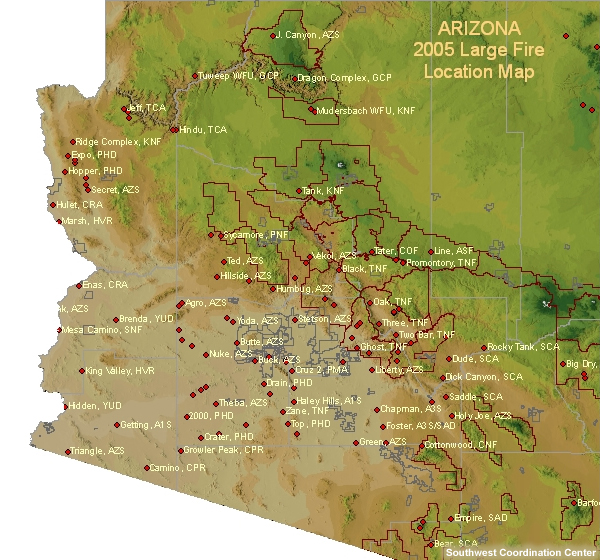
Map of large fire locations in Arizona during 2005. Each red diamond marks the location of a 100+ acre fire. A large number of fires occurred in the desert lowlands (indicated by the brown areas on the map). Higher elevations, represented by the greener areas, experienced far fewer fires.
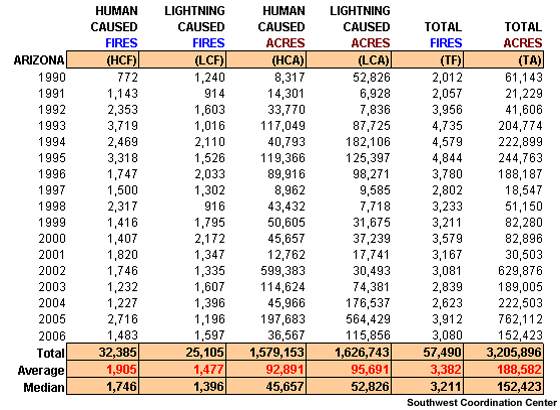
In 2005, more acres burned in Arizona wildland fires than had burned in any of the past 15 years.
Timber and heavier fuels need a longer drying duration to be ripe for a fire event. An example would be several weeks without precipitation occurring during a warm spell. In these cases, the litter and duff layers play a role in determining the fire susceptibility. Across the interior West, the most critical setup pattern for these fuels is abundant winter or spring precipitation followed by a dry winter or an especially late winter/spring during the next year. In this case, fine fuel loading is high from the wet year and heavier fuels or sheltered areas dry out quickly due to the lack of precipitation in the winter and spring. This setup can extend the fire season, and the abundant and more continuous fuels can cause efficient fire ignition and spread as well as increased fire intensity.
In Boreal forests across Alaska and other northern regions, the setup increasing fine fuel loading plays a lesser role than those that affect timber fuels. Most Boreal forest understory in Alaska and northern Canada is made of woody plants, lichens, and a deep duff layer with minimal grass. During the record-breaking 2004 fire season in Alaska, the latter part of spring was exceptionally warm and wet. These wet conditions were followed by a warm and unusually dry summer. The ladder fuels, including the volatile Black spruce and wood understory, quickly dried out leading to extended periods of high fire danger. Deciduous trees, which normally do not sustain crown fires, also contributed to fire intensity and spread.
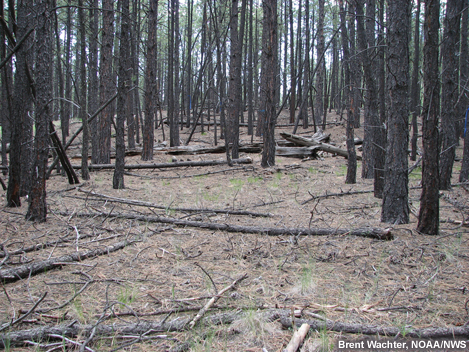
The same conditions that cure out grasses and fine fuels also dry out fuels in timber-sheltered areas. This drying can produce a volatile setup for fires.
Fire weather forecasters need at least a basic understanding of fuel information to be able to identify these critical setup patterns. Different fuel types require different levels and durations of dryness, which vary by geographic region. Fire weather program managers should keep forecast staff up-to-date on fuel susceptibility, and should continually reference the National Fire Danger Rating System (NFDRS), used by land agency personnel within the U.S. to track trends in fire danger.

Key parameters output by NFDRS and used to assess how well a fuel might burn include the following:
- Ignition Component—the expressed probability that a firebrand will cause an actionable fire.
- Spread Component—the rate of a fire's spread at its head under assumed winds, fuel conditions, and
topography.
- Energy Release Component—a number relating to available energy released from burning wildland
fuels.
- Burning Index—a measure of fireline intensity and flame length.
These components provide valuable references for determining the difficulty of controlling a fire. For instance, the Energy Release Component (ERC) can be used to determine the type of resources and type of attack likely to be most effective.
NFDRS provides a consistent system for assessing conditions across the U.S. It considers only initiating fires and is based on estimates for containment rather than extinguishment. NFDRS represents near worst-case conditions across a Fire Danger Rating Area based on the peak heating period during the normal burn window. Fire Danger Rating Areas within regions are defined as being fairly uniform in terms of weather, fuels, and topography.
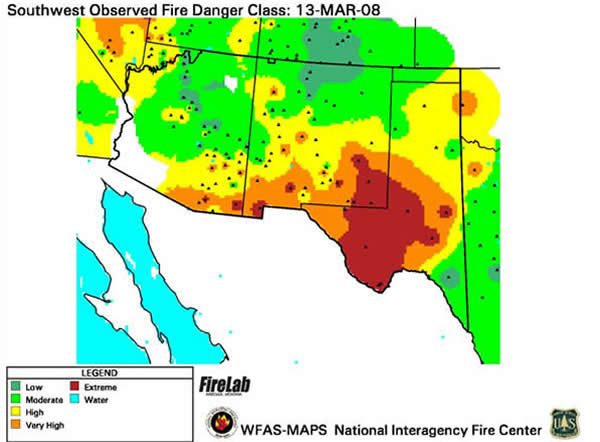
Fire Danger Ratings provide quickly-accessed, up-to-date information about the susceptibility of an area to fire ignition and spread.
In Canada, a different fire danger rating system is used. This system works quite well for boreal forest areas and can also be used to address fire danger issues across some northern latitudes of the contiguous U.S. These areas include the Great Lakes region as well as portions of the New England area. In the southeastern part of Australia, streamflow data is a useful reference to fire control, based on the extent to which fires will be able to spread in riparian areas during normal precipitation years. During dry years with low or nonexistent streamflow, fires can burn quickly through these areas.
4. Fire Weather and Fuels Data and Guidance Products
![]() How do you know what weather patterns are affecting different regions and whether they
are setting up an environment conducive to fire? How do you know the status of fuels in your area? A variety
of data and tools are available through products outlined in the Fire Weather and
Fuels Data and Guidance Matrix. These products are useful to the fire weather focal point, IMET, and
other forecast staff.
How do you know what weather patterns are affecting different regions and whether they
are setting up an environment conducive to fire? How do you know the status of fuels in your area? A variety
of data and tools are available through products outlined in the Fire Weather and
Fuels Data and Guidance Matrix. These products are useful to the fire weather focal point, IMET, and
other forecast staff.
NFDRS
Overall information on fire danger conditions, including both fuels and weather, is summarized in the National Fire Danger Rating System (NFDRS). This rating can be accessed through the Wildland Fire Assessment System. The Fire Danger Rating is defined as the resultant descriptor of the combination of both constant and variable factors affecting the initiation, spread, and difficulty of control of wildfires in an area. It can be thought of more simply as an indicator of how well wildland fuels will burn.
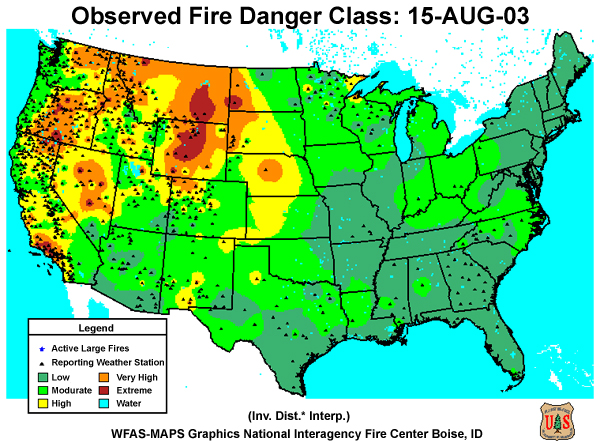
NOAA SPC
NOAA's Storm Prediction Center (SPC) provides short- and longer-term weather guidance, including 1-day to 3-8 day outlooks identifying fire weather risk across the U.S. Many of the weather patterns responsible for drying fuels are also critical fire weather patterns during the primary fire season. SPC guidance products and discussions for selected areas can help fire weather forecasters track these patterns before the fuels become fully susceptible to significant fire ignition and spread. These discussions can also be used to highlight near critical conditions when fuels are already susceptible to fire.
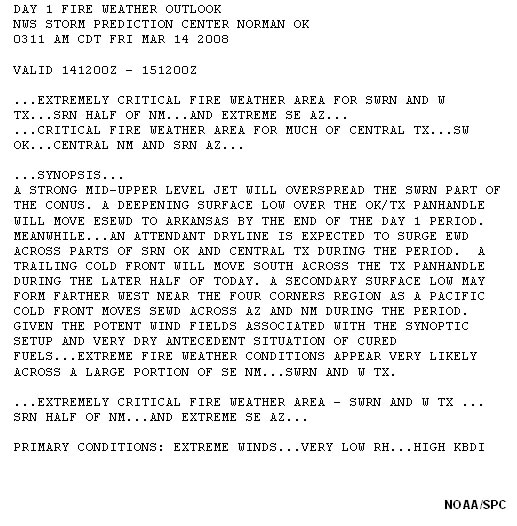
Fire weather outlook discussions provided by NOAA's Storm Prediction Center offer useful guidance about critical fire weather areas based on weather pattern and fuel status.
GACC Fire Potential
Prior to and during the fire season within a region, each Geographic Area Coordination Center (GACC) provides a 7-day outlook for significant fire potential. Significant fire potential is defined as the likelihood a wildfire event will require mobilization of additional resources from outside the area in which the fire situation originates. The significant fire potential outlook gives a dryness extent for each day for set geographical areas called Predictive Services Areas (PSAs). The outlook also identifies "high risk" days. These are days in which "dry" or "very dry" fuel conditions are combined with a significant weather trigger including lightning, high winds, or above-normal temperatures and dryness. The GACC outlooks report fuel status as "moist", "dry", or "very dry" using a simple color scaling. During the setup stage, tracking changes in the fuel status helps a fire weather forecaster very quickly identify fuel susceptibility.
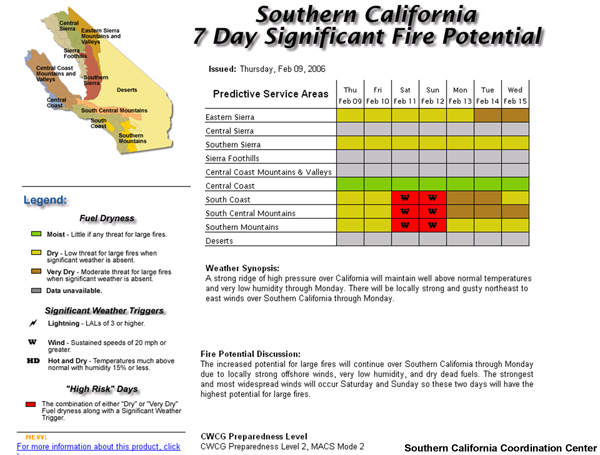
Screen shot of the 7-day significant fire potential issued by the Southern California Geographic Area Coordination Center (GACC).
GACC Seasonal Outlooks
GACC Predictive Services and the National Interagency Coordination Center also offer seasonal fire potential outlooks for time periods on the order of one to three months depending on the region covered and the length of the fire season. The following example shows the forecast fire potential across the U.S. for the period from April through June, 2008.
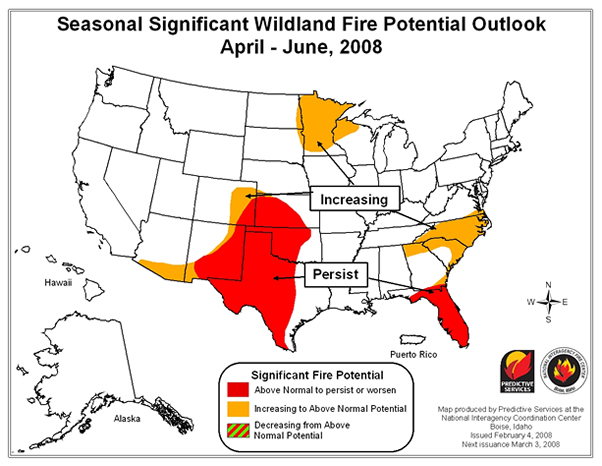
Seasonal fire potential outlook for the U.S. issued by Predictive Services at the National Interagency Coordination Center.
The Predictive Service's unit of each regional GACC provides additional fuel readiness products online. Content and graphical displays may vary with region, but in general, daily, weekly, monthly, and seasonal outlooks are provided. These sources provide useful information for monitoring patterns and quickly assessing when changes in fuels or other environmental factors could pose dangerous conditions. Weather changes can very quickly and significantly influence fire danger, making it important to stay aware of the patterns affecting your area of concern. How quickly the fire danger responds to these changes depends in part on the type of fuel, condition, and fuel loading.
Predictive Services units provide a range of information related to fuels and the setup of high fire danger conditions. Graphical products showing the Energy Release Component (ERC) and dead fuel moisture values are particularly useful in helping gauge fuel susceptibility. The information is typically found within the Fuels and Fire Danger section of the GACC web site, although content and graphical display can vary with region. The Northern Rockies Coordination Center, for example, provides fuels information for 13 individual PSAs.
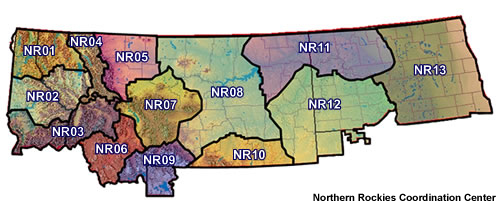
The 13 Predictive Services Areas (PSAs) covered by the Northern Rockies Geographic Area Coordination Center are color coded above. During fire season, fuel information and other types of data are reported for each area.
Choosing Region 6 to view values for the Big Hole Montana area, we find plots of ERC and fuel moistures for the 2007 fire season, with average, maximum, and year 2000 values overlaid for comparison.
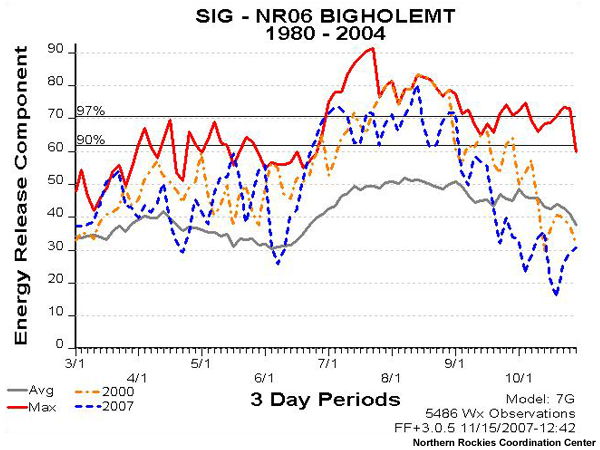
Energy release component for 2007 is shown by the blue line and was significantly above average (gray line) from early June through the end of August.
The Energy Release Component (ERC) relates to how hot a fire can burn in terms of total energy (BTUs) released per square foot area. It changes daily based primarily on changes in weather. Cooler, wetter weather will lower values while warmer and drier weather will raise values. The ERC reflects changes in both live and dead fuel moisture content and is a cumulative or "build-up" type of index. As live fuels cure and dead fuels dry, ERC values increase, providing useful information about fire danger conditions. ERC is widely used by land agency personnel to track fuel dryness and drought effects. It is common practice to compare current values with those from historically significant fire years, as well as with maximum and minimum readings. ERC values are output for both fine and timber fuel types. ERC values change less on a day-to-day basis for heavier fuel types than for finer fuels.
Other measures of fuels readiness include relative greenness and departure from average greenness. These products are based on the satellite-derived normalized difference vegetation index (NDVI) and are mapped weekly for each of the Geographic Area Coordination Centers. Relative greenness is expressed as a percent of the maximum possible greenness for each vegetation type. Low values during the growing season are a sign that the vegetation is under stress and, during the fire season, signal a high susceptibility to fire ignition. The departure from average greenness indicates how green an area is compared to its average greenness for the time of year.
Growing Season
Additional information that can aid in determining the status of live fuels include the Growing Season Index (GSI), soil moisture graphics, and the national fuel moisture database, which contains live fuel moistures reported by local land agency districts and consulting local officials. The Growing Season Index (GSI) is used to monitor canopy status of live vegetation over time using three main variables: photoperiod, minimum temperature, and evaporative demand. The index is a 21-day running average that helps smooth the effects of significant short-term changes in environmental conditions. Lower GSI values indicate less active growth while higher values indicate active growing.
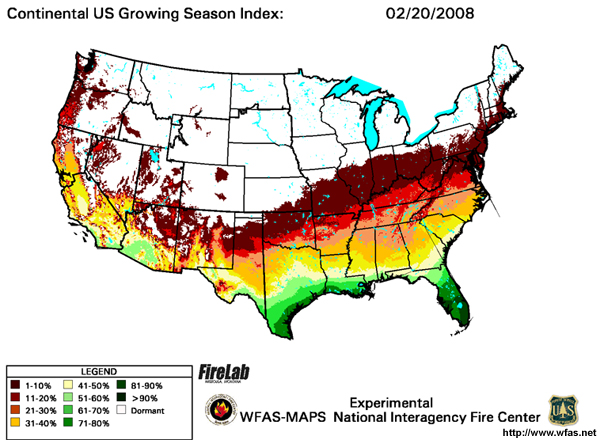
Growing Season Index values are mapped for the continental United States for late February 2008. The growing season is becoming more active across the southern tier of the U.S., indicating the beginning of the transition from dormancy to pre-green-up. Because the GSI is a 21-day average, fuels have most likely transitioned to green-up in areas with values greater than 50 percent.
Soil Moisture
Graphical soil moisture information is provided by NOAA's Climate Prediction Center (CPC) as well as the University of Washington. Soil moisture relates to duff layer dryness and to a lesser extent to surface litter dryness. Soil moisture also relates to the growth of live fuels. Low soil moistures can stress the live fuels and curtail growth.
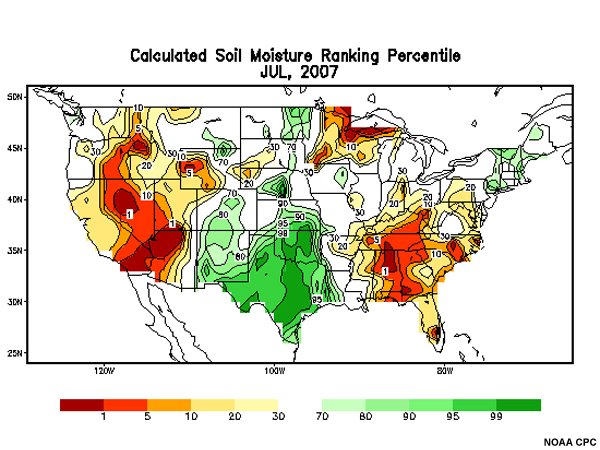
Consider this pattern experienced by portions of the country from 2004 through 2006.
During the winter 2004-2005 and spring 2005, soil moisture over much of the Southern Plains and portions of the Southwest was above normal. This wet period was followed by partial drying as the summer progressed. In some areas, moisture was sufficient to allow perennial fuels to green up, but by fall 2005, the dryness had expanded across the region. Conditions became significantly dry during winter 2005-2006.
(Click image above to open animation in a window.)
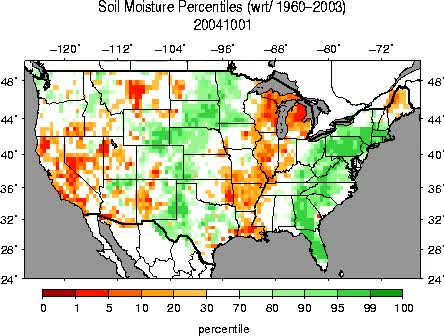
Soil moisture values were above the 1960-2003 normal from late 2004 through the first half of 2005. However, dry conditions began to develop in the summer and strengthened during the fall. Significant dry conditions continued through early 2006.
Question 1: As you begin assessing the fire weather situation in 2006, what things are most important to consider?
Answer: In evaluating this situation for fire potential, be able to address:
- the types of fuels present across the region
- how recent patterns have affected fuel loading and conditions
- how weather changes will affect the fuels situation
Question 2: Where do you find out about fuels? [see Data/Guidance Product Matrix]
Answer: Fuel information is available from the WFAS, U.S. Forest Service, and Predictive Services. Suppose you are monitoring environmental conditions in western New Mexico. A good starting point would be to check fuel conditions reported by the Southwest Coordination Center Predictive Services. Vegetation in the western New Mexico region mainly consists of four fuel models—Western Grass, Open Pine with Grass, Closed Short-needle Conifer, and Light Slash. The Predictive Services site offers information about the Burning Index (BI) and Energy Release Component (ERC) for each of these models. The National Fuel Moisture Database in conjunction with the Growing Season Index provides a gauge for assessing live fuel moisture levels during and after green-up. The WFAS offers easy-to-access information about dead fuel moisture, greenness levels, and overall fire danger.
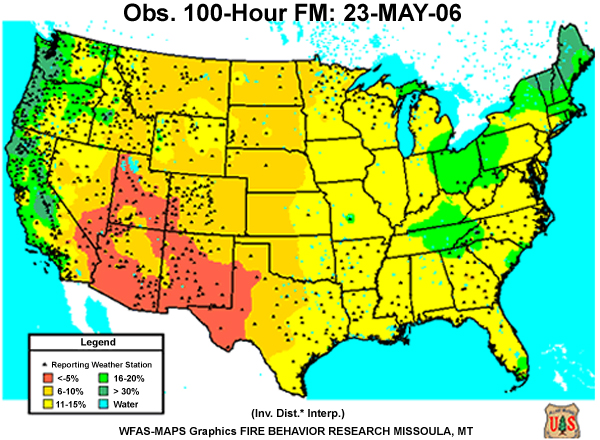
The WFAS map product illustrates that fuel moistures were below 15% for most of the southern U.S. and below 5% for much of New Mexico.
Question 3: How do you assess the influence of recent weather patterns on fuel conditions?
Answer: One option is to check the Energy Release Component, which is a cumulative value reflecting long- and short-term weather conditions. Periods of dry weather raise this component and increase the overall fire danger. Local land agency fuel specialists as well as the Growing Season Index information and National Fuel Moisture Database can also provide useful information.
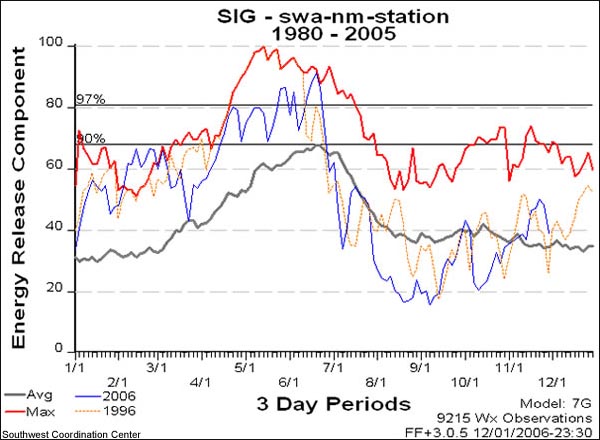
The blue line represents the Energy Release Component for 2006. By late spring, values were much above the 1980-2005 average shown by the solid gray line.
Question 4: How susceptible are the surface fuels in open pine forests to changes in weather?
Answer: Open pine stands allow more solar radiation and wind to reach the surface fuels. Grasses and lighter fuels have very short response times to changes in weather conditions, especially when they are cured out or dormant. A few very hot, very dry days can raise the fire susceptibility of these fuels very quickly. Heavier and dead down fuels found within a more sheltered timber environment require much longer time periods to dry out and become fire-ready. However, once they have dried, the higher available potential energy can lead to much higher Energy Release Components than lighter fuels.
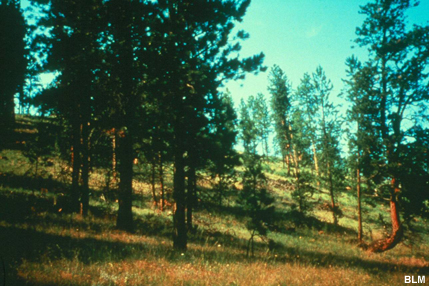
In a fairly open pine stand, as shown above, grass is the primary carrier of fire.
Question 5: In spring 2006, year-to-date precipitation for the region was below normal and ERC values were above normal over much of the area. Based on this information, what is your assessment of the current environmental setup and what would you monitor for the remainder of the spring period? Who would be most interested in your assessment?
Answer: Significant antecedent fine fuel loading combined with above normal long-term dryness has increased the potential for fire ignition, spread, and intensity across large portions of the Southwest and Southern Plains. Considerations for the rest of spring include gauging the green-up and post green-up periods in these regions. Good sources for this information are WFAS products, the Growing Season Index, and National Fuel Moisture Database. Continual consultation with land agency fuel specialists and attention to GACC products is necessary and, in some parts of the country, required. Monitoring short-term weather effects is also prudent. Unusually strong storm system passages that bring significant amounts of precipitation in the form of snow and/or rain during the spring period can mitigate fire danger levels over short and long timescales. The National Weather Service precipitation analysis page offers a good, one-stop source for tracking this information.
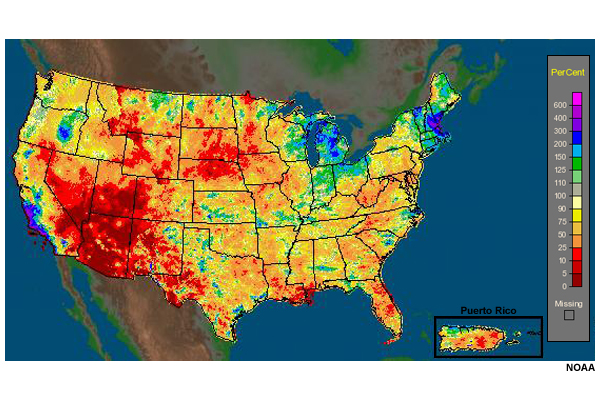
Percent of normal precipitation for May 2006 is shown by the color coding on the map. Dry conditions can change the timing of the green-up period and cause fine fuels to dry out very quickly.
Passing your assessment along to the rest of the forecast staff, particularly during green-up, curing, and other dynamic time periods, will allow for more focused forecast efforts across the area. Special attention to critical weather thresholds affecting different fuel types will allow the forecast staff to draw customer attention to the significant weather concerns of the day.
Examine the following set of conditions, including weather, fuels, and other information. Identify the prevailing weather pattern and the area that is most affected. Describe this pattern's effect on fuels and assess whether the environmental setup favors the development of fire conditions.
Background: You are working in the Albuquerque Weather Forecast Office and evaluating environmental setup conditions for fire danger in mid-May 2004. Temperatures during the first five months of the year have been near to above normal, with much above normal temperatures occurring in January and March. The year 2004 started with a continuation of drought conditions experienced in 2003, with precipitation having been below normal for much of that year at the same time that temperatures were above normal. April 2004, in contrast, was the second wettest April on record for the area. These wet conditions helped grasses to flourish immediately following green-up in late April/early May. May has so far been very dry and warm, accelerating the curing of fine fuels. May 2004 will end up being the ninth warmest on record for Albuquerque.
Fuels in central New Mexico are mainly pine forests intermixed with brush and grasses. The Data/Guidance Product Matrix links you with sources that will help you determine which fuel models represent these fuels and how easily the fuels will burn.
Forests made of pine with a grass understory burn fairly easily when dried. Given this information regarding weather and fuels, what additional guidance would you seek in determining whether the environment poses a potential for critical fire weather? Where would you look for this guidance?
Products from WFAS and the GACCs confirm that fuels are dry in your area.

Many areas of New Mexico, particularly lower elevations, were significantly below average greenness.
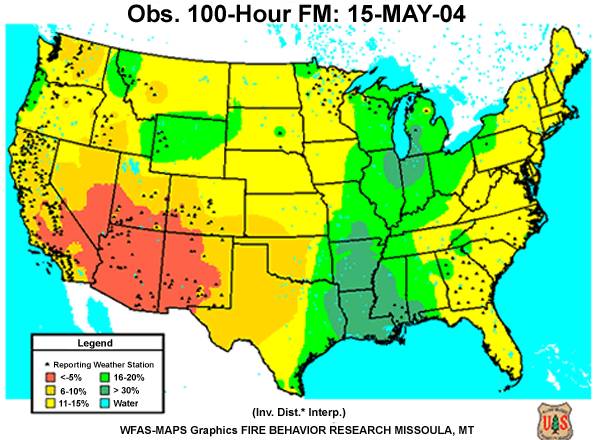
By mid May, 100-hour fuel moisture values were below 5% throughout much of central New Mexico.
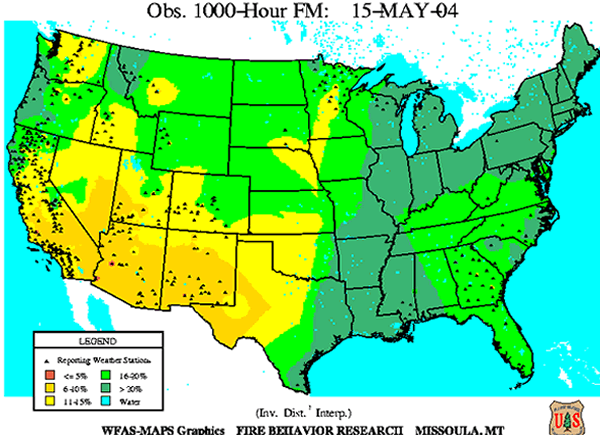
1000-hour fuel moistures had fallen to levels below 10%.
Question 1: Given what you know about meteorology in the western United States, what should you watch for in terms of patterns that would cause additional drying and/or increase the likelihood of significant fire behavior?
Question 2: Given the conditions, a fire weather focal point would want to carefully gauge curing during the post green-up period for varying elevations. An early green-up can result in an early curing of fuels. In central New Mexico, pronounced green-up usually occurs in May at higher elevations. In 2004, a very warm May followed abundant moisture in April, resulting in an earlier green-up phase at some high elevations and causing fuels to cure out earlier than in normal years.
What happened? (Click to see expert responses)
Fuels in this part of New Mexico are primarily Ponderosa pine forests intermixed with grasses and oak brush. These fuels can dry out quickly under warm conditions, as had been experienced for most of the month of May. In central New Mexico, May typically marks the transition to the main fire season although sometimes this transition can occur as early as April. During the transition period, local agencies aren't yet at full fire season capacity so vigilance by fire weather program leaders is particularly essential.
In mid-May 2004, the already low fuel moisture values and forecasts of drier air accompanying a front moving into the area resulted in very high to extreme fire danger ratings. Despite burning restrictions in wilderness areas and forests, a campfire was not properly extinguished and started a wildfire in the Cibola National Forest on May 20. During a period of seven days, this fire consumed over 4600 acres and involved the efforts of more than 550 firefighters. The environmental setup also favored lightning-ignited fires, as occurred in the case of the Peppin Fire. The Peppin Fire began on May 15 and scorched more than 10,000 acres in the Capitan Mountain area. It had been almost contained on May 22, but the dry conditions and strong winds caused it to reflare during the week of the 24th.
5. Situational Awareness
The previous exercises offered practice in assessing fire danger conditions. In real-life scenarios, it is important to know what questions to ask, how to find the answers, and how to interpret and respond to the information quickly.
Situational awareness requires recognizing the many different variables affecting a situation. It is a constantly evolving process requiring preparation and attentiveness. Preparation can be built in part by going through “what if” scenarios. In a fire, this preparation can help you respond correctly in a situation where lives could be at risk.
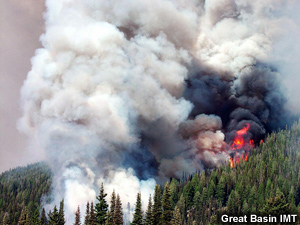
Fires can blow up quickly when fuels and weather conditions are favorable.
In a fire weather forecasting situation, situational awareness can be developed through a combination of objectives:
- understanding the policies that are in place as well as the classic fire weather situations for the area,
- monitoring fuels conditions and conveying that information to the rest of the forecast staff,
- daily preparation and information gathering for self-briefings on fire activity, and
- plans for managing the high intensity and workload of fire events in the area.
It is one thing to understand the elements of situational awareness and another to be able to achieve it.
Understanding policies
The first objective, related to familiarity with existing policies and procedures, is particularly important. These policies have been carefully developed to protect fire weather forecasters and their customers who use the information. The forecaster must be aware of National Weather Service Policy Directive 10-4, the Annual Operating Plan, Station Procedures, and any other policies affecting the situation or area. Not following these procedures can lead to trouble and complaints by fire weather customers.
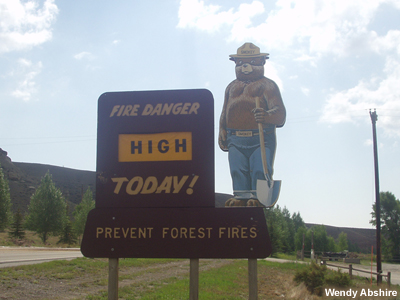
High fire danger can mean high anxiety operations for a fire weather forecaster. Following established policies can help ensure that things go smoothly and that customers receive the information they need.
One major pitfall for fire weather forecasters concerns the “gray area” regarding Red Flag policies. To avoid confusion by all parties involved, the fire weather focal point should make sure everyone has a consistent interpretation of the Red Flag Warning criteria. In this way, personnel working the fire can be kept oriented toward “event driven” Red Flags. In addition, the forecaster will be able to talk in Red Flag terms 24 hours a day, both with fire weather customers and with other offices.
Monitoring Fuel Conditions
The second objective, land/fuel conditions monitoring, requires that the fire weather program leader or IMET work to keep staff up to date. Assessing conditions is typically a weekly or biweekly procedure, and the items to monitor depend on locale. Contacting and communicating with user agencies is a critical component that cannot be left out. The Data and Guidance Product Matrix lists good places to look for fuels and other information.
Daily Fire Intelligence
The third objective involves a daily self-briefing in which the forecaster determines the “problem of the day” based on fire intelligence. Fire intelligence includes information on fuel conditions, fire activity regionally, and knowledge of services provided the previous day. Knowing about current fuel conditions, for instance, is important because as fuel conditions vary, the weather required to create extreme fire conditions will vary. Knowledge of regional fire activity is important as calls for briefings or spot forecasts come in. Other fire activity in the region also influences what resources go in or out of a particular area. Finally, knowing what types of information customers are requesting for what locations helps forecasters prepare and provide the best service. This information can also help create a seamless service, despite staff rotations and shift changes.
How do you determine critical items in your area and nationally? If there are fires currently burning in the region or in other regions, how do you find out? From the Fire Weather Data and Guidance Matrix, you will find that a quick resource to check is the Incident Management Situation Report, issued by the National Interagency Coordination Center (NICC). You can also access national views of fuels and wildland fire behavior advisories through the NICC. Other helpful links include Inciweb , which provides detailed reports about large fires. The individual Geographic Area Coordination Centers (GACCs) and certain state agencies provide situation reports offering additional information on wildfires as well as on wildland fire use and prescribed burning.
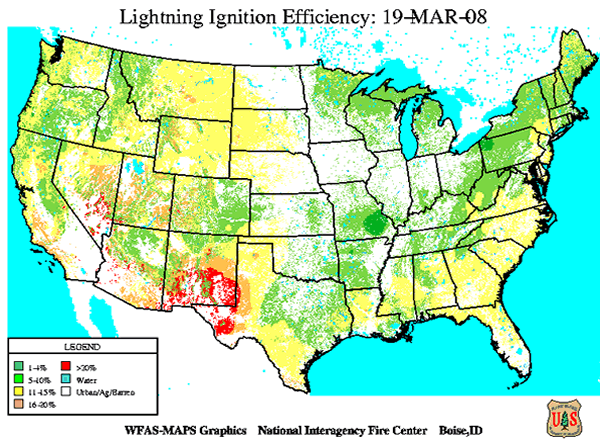
Lightning ignition efficiency, provided through WFAS, alerts the fire weather forecasters to areas where danger of fire ignition by lightning is particularly high.
Developing good situational awareness requires practice. Here are some high intensity operational examples that will help you think about responses and develop skills to quickly address similar situations.
1. A short Type II team is conducting a two mile burnout in the evening as soon as winds decouple. There is a forecast shift change and you inherit the forecast that was issued a few hours earlier to support this operation. You notice a stronger thermal trough than forecast moving towards the area possibly causing winds to shift and pick up.
2. You are assigned to an incident and the local district has designated initial attack responsibility to the management team. Thunderstorms are increasing in coverage and smoke has already been sighted within the initial attack area. A crew has been sent to investigate and work the fire. You notice a large outflow boundary approaching from the north.
Question 1: What are the operational concerns you should consider in these scenarios?
Question 2: What are the critical weather needs for these operations?
Answer: In the first example, the fire behavior analyst (FBA) needs to know about the incoming trough. The FBA can typically be contacted
- by cell phone,
- through the comms unit assigned to the fire, or
- through the local dispatch zone if other possibilities fail.
In the second example, the crews on the line should be informed of the approaching boundary. This message can be sent through the comms unit at the incident or via radio to the crew chiefs. The outflow boundary is a critical fire weather situation, so be prepared to rebroadcast the message and also request that all divisions acknowledge this update.
In many instances, including the first example scenario, the person submitting a spot forecast request will provide a list of critical needs within the remarks section of the request. These needs might include alerting them to significant wind direction changes from fronts, outflows, or other phenomena. The fire weather customer will also sometimes provide weather thresholds requiring special attention. They might need to know, for example, if relative humidity levels fall or rise above a certain threshold. Crews will ask for forecast information during a burnout or prescribed burn, but alerting them to possible changes in critical variables is also necessary. For instance, if relative humidity will rise more quickly than expected and reach the critical threshold by 1900 rather than 2100 as originally forecast, the crews need that information. This fine-tuned information might be requested from a forecaster working in the office or in an IMET scenario.
Being aware of the current situation will help you respond appropriately and effectively when critical fire weather information is needed.
Is it going to burn?
Question 1: It is mid-August 2003 and you are monitoring the potential for fire weather conditions in southern Montana. Fuels in this region tend to be mixed, including lodgepole pine, douglas fir, limber pine, white bark pine, sub-alpine fir, and spruce fir mix. Dead fuel moistures in the region are typically low at this time of year, but because of ongoing drought conditions, the values are much below normal. You decide to check on the status of live fuel moisture values. Where do you find the information?
View Data/Guidance Product Matrix
Answer: Live fuel moisture values are available from the Wildland Fire Assessment System and can also be accessed through the Geographic Area Coordination Centers. A check of the data reveals that both live fuel moistures and greenness in the southern part of Montana are much below normal.
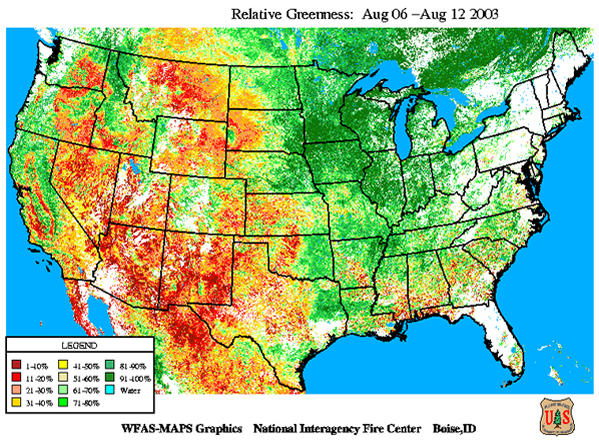
Relative greenness data available through the Wildland Fire Assessment System (WFAS) indicate extremely low greenness percentages over central Montana.
The region has been experiencing hot, dry weather. In fact, NOAA climatologists are currently rating the drought conditions as extreme. Based on this combination of weather and fuels data, you determine that the fire danger is likely quite high for much of the region.
Question 2: Where is a good source to determine which areas within the region have the greatest potential for fire danger? How does this information affect your efforts to monitor critical fire weather conditions?
Answer: You can locate the areas likely to be most significantly affected by fire by checking the National Fire Danger Rating System available through the Wildland Fire Assessment System. The Northern Rockies Coordination Center reports this information as well, in addition to providing more tailored for the region in which you are interested. Overall, it appears that the environmental setup is ripe for fire ignition and growth, requiring you to be extremely vigilant monitoring critical fire weather patterns in the region.

The Fire Danger Rating over a large segment of Montana and Wyoming is very high to extreme.
Question 3: By August 16, you observe a large system moving southeastward across the Northern Rockies. Ahead of the front are high-based thunderstorms with outflows generating strong gusts and shifting winds. Explain this weather pattern and whether it can be considered critical for fire weather.
Answer: A cold front is moving across the region, greatly increasing fire potential in areas that are already very highly conditioned to burn. These cold fronts can play a role in increasing the potential for ongoing fire spread and intensity. Additional ignitions can result from higher-based thunderstorms ahead and along the frontal passage, and gusty and erratic outflow winds provide periods of uncertainty for both forecasters and fire behavior analysts.
What does this weather and fuel combination mean, and what do you do next?
This case now becomes one in which good situational awareness will help you work most effectively.
Question 4: To whom should you provide information about this fire weather pattern? Are there existing fires in the area? How do you communicate with the personnel working them?
Answer: Luckily, you have been keeping a keen eye on the situation and recognize that the current weather conditions greatly increase the danger of fire ignition and rapid spread. You know that you should alert any crews in the area about the approaching thunderstorms and accompanying winds. Due to storm dryness and the lightning associated with the storms, the possibility of new fire ignitions is high. You can track the progress of the storms across the region and give fire personnel the information they need. If working a shift in the office, you also follow through on disseminating information about the potential for severe weather to the public. You have done your research, stayed aware, and thought about how to proceed so that you can now put all that you have learned into action.
Fire danger relates to the ignition, spread, and intensity of a fire. This module summarized key fuel drying mechanisms related to the transition from low to high fire danger for regions throughout the U.S. It also explored a range of data sources that fire weather forecasters can use to find information for assessing fire danger. Forecasters completing this module should now have an understanding of the fire "setup" stage as well as weather patterns that lead to fuel dryness. Fuel types cover a range from grasses to large timber, and the various fuel types differ in their response to drying conditions. The National Fire Danger Rating System (NFDRS) takes these differences into account and provides an overall estimate of current fire susceptibility.
The most effective fire weather forecasters are those who have a good handle on the environmental setup for fire conditions at both the local and larger scales. Fire danger depends on both long-term and short-term weather patterns affecting a region, as well as fuel loading and conditions in the area. A number of sources provide information on various parameters—from fuel type to drought indices to fire ignition, spread, and intensity—that can help forecasters assess the current fire setup situation. The Fire Weather and Fuel Data and Guidance Matrix offers an easy-to-use resource for locating these types of information.
Good fire danger assessment requires keeping aware of the aspects affecting a situation and knowing what actions to take as the situation changes. For fire weather forecasters, elements of situational awareness include knowing the classic fire situations for an area and understanding and acting according to operational policies. The fire weather forecaster should keep apprised of fuels information and fire activity and convey that information to the rest of the forecast staff. This communication will help ensure that critical weather conditions are recognized and monitored, particularly during the transition period to main fire season. Fire events bring a high intensity workload requiring good planning and task management on the part of the fire weather program leader, IMET, and all other parties involved. Implementing these practices can reduce the chance that you are caught off guard in a fire weather situation. Maintaining good awareness also helps you assess and respond to fire danger conditions correctly.

