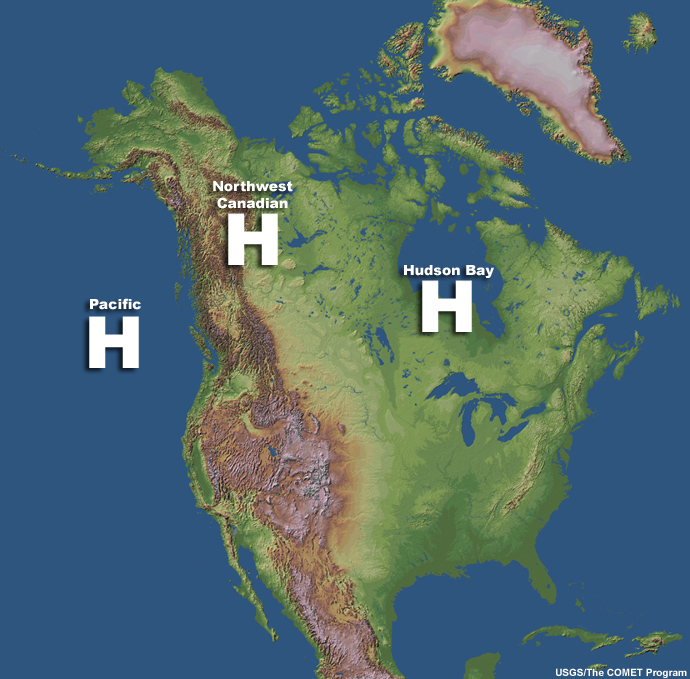
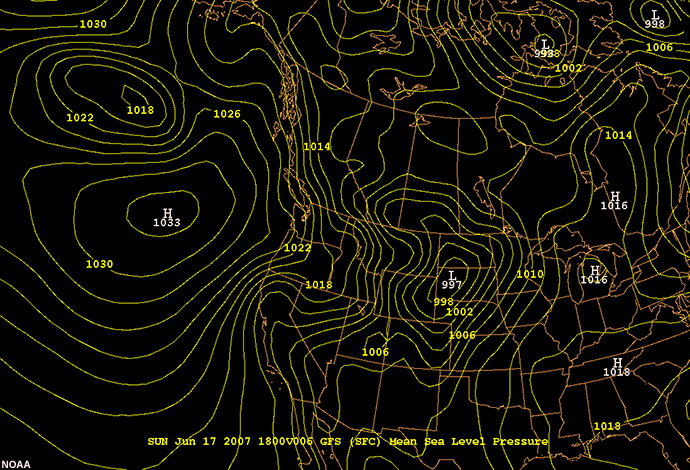
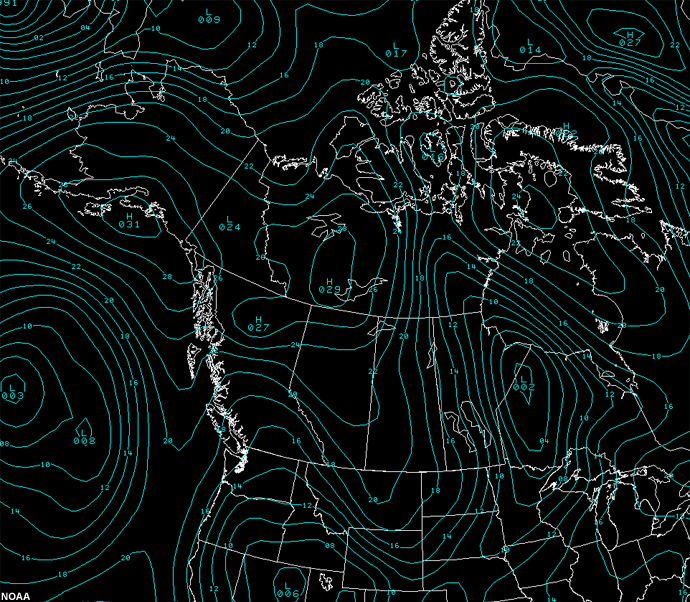
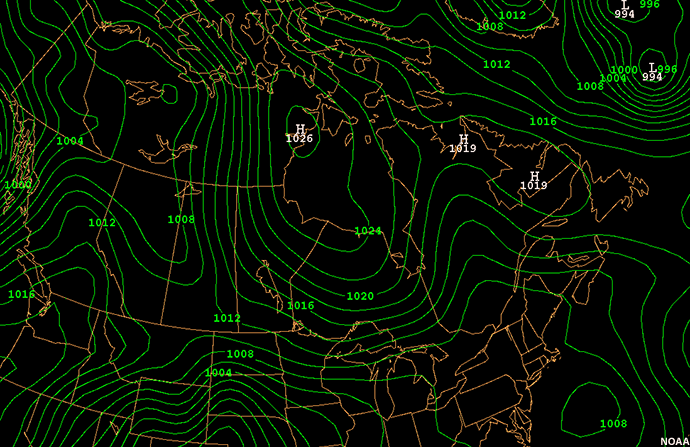
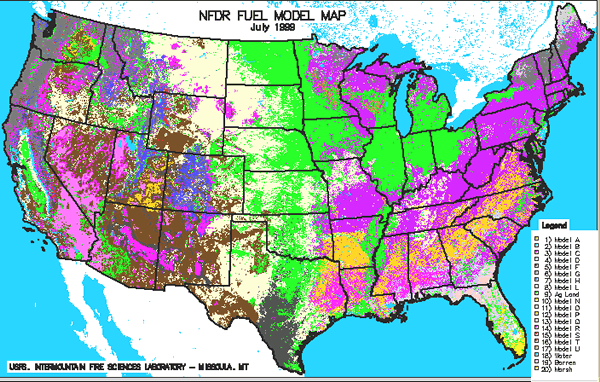
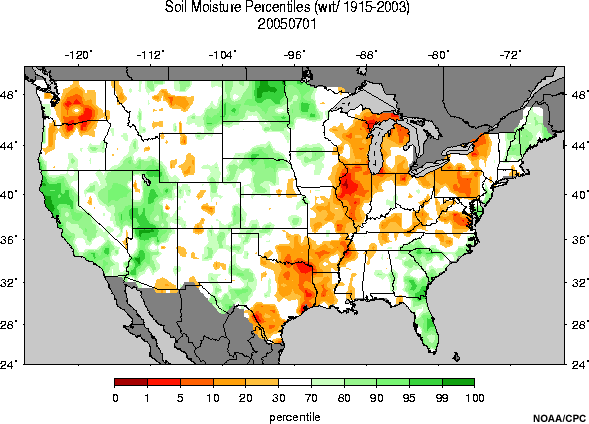
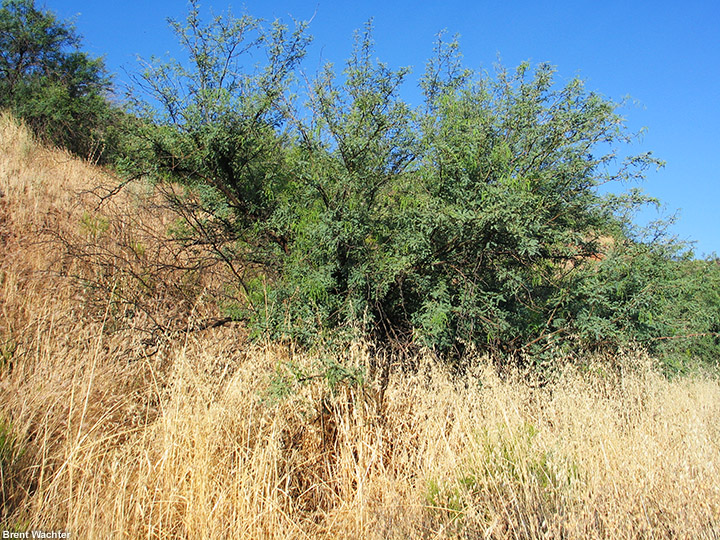
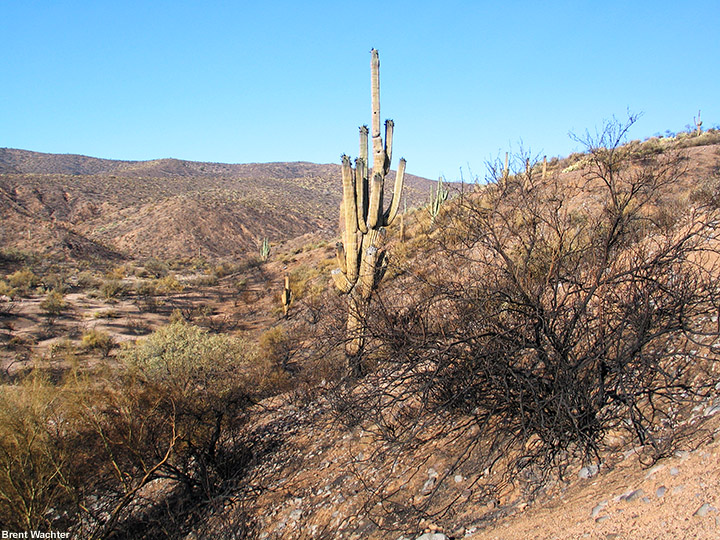
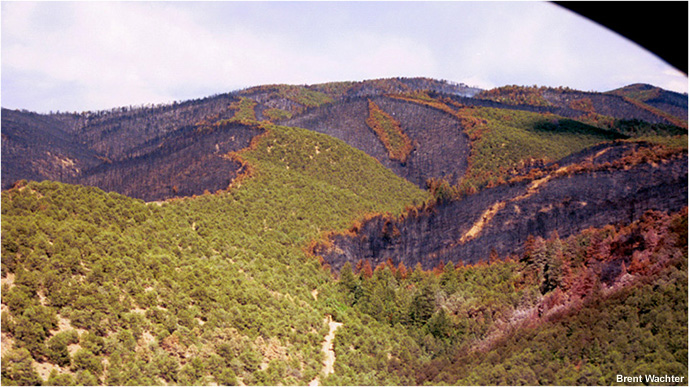
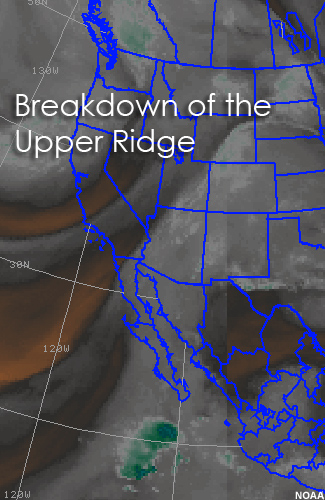
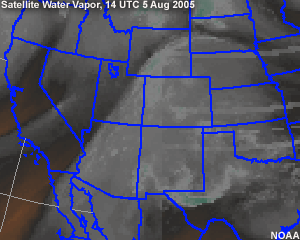
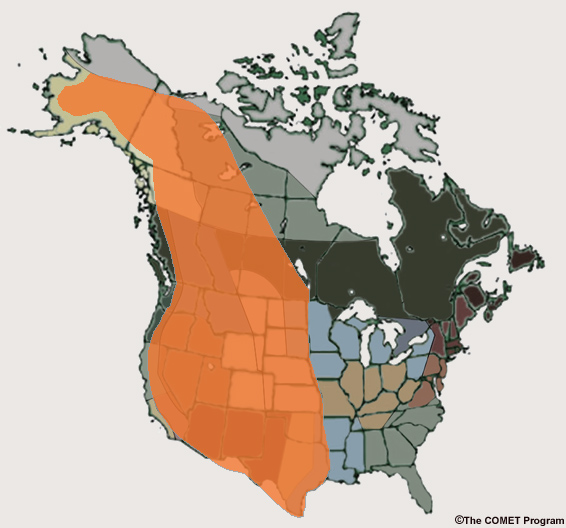
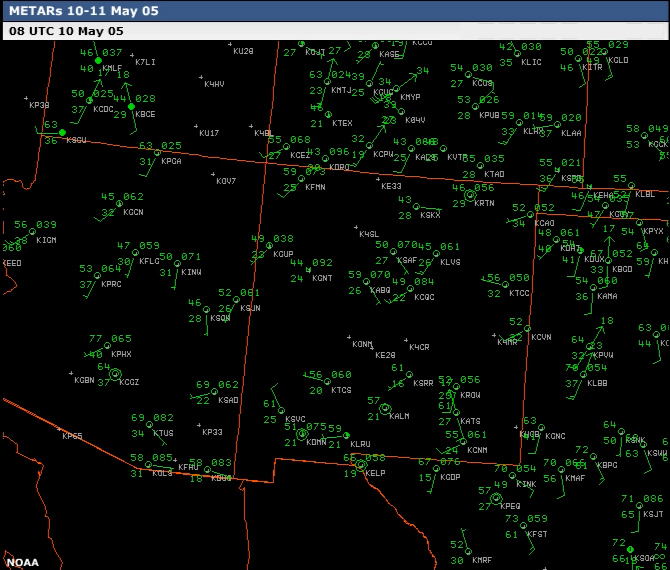
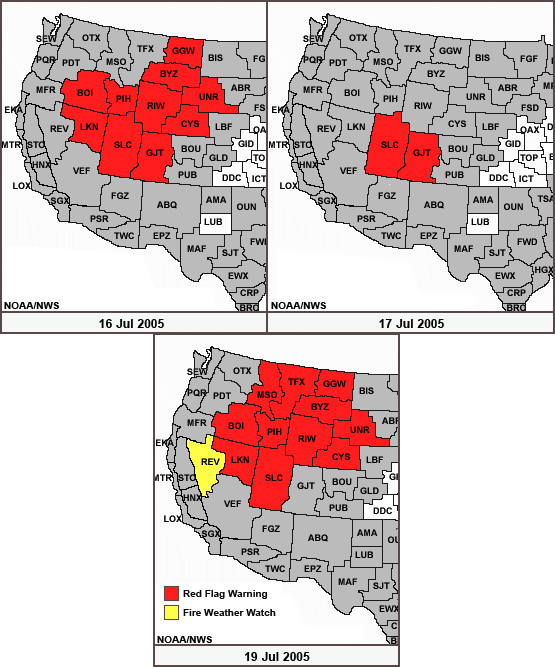
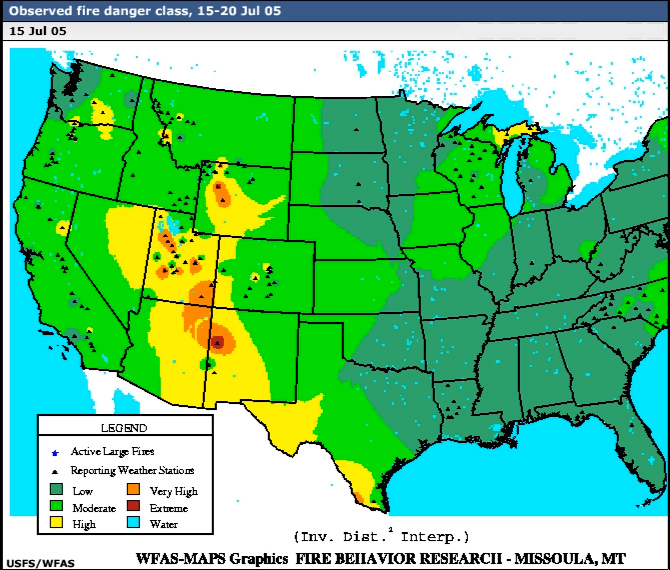
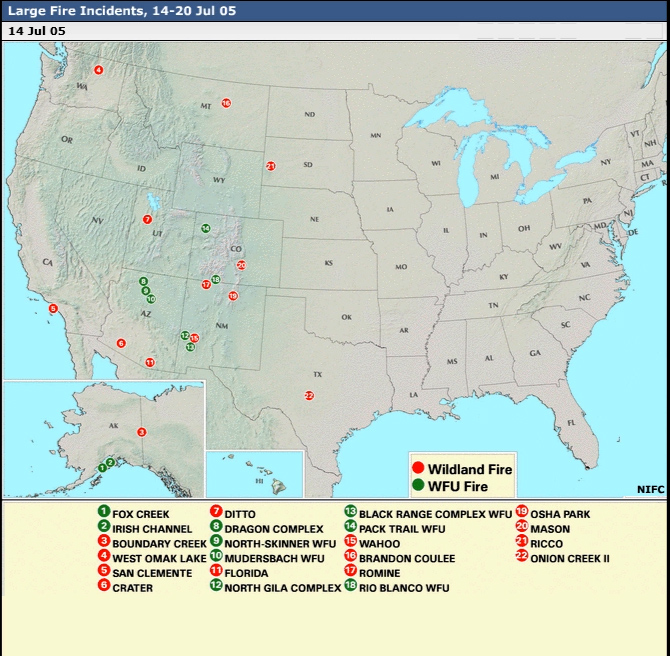
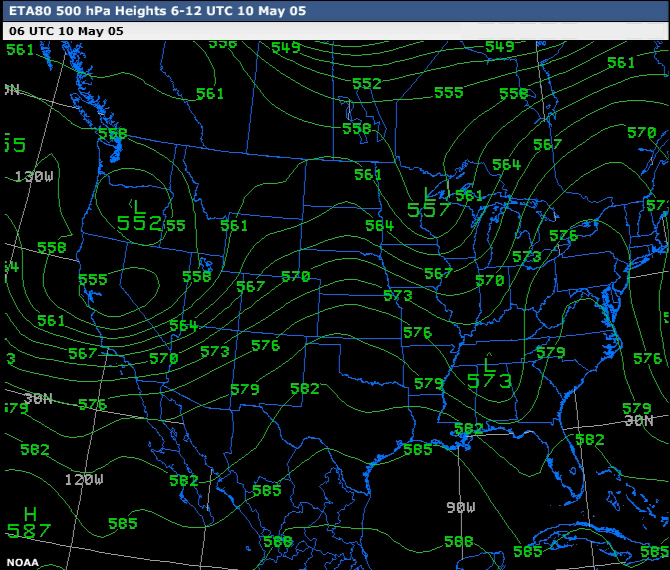
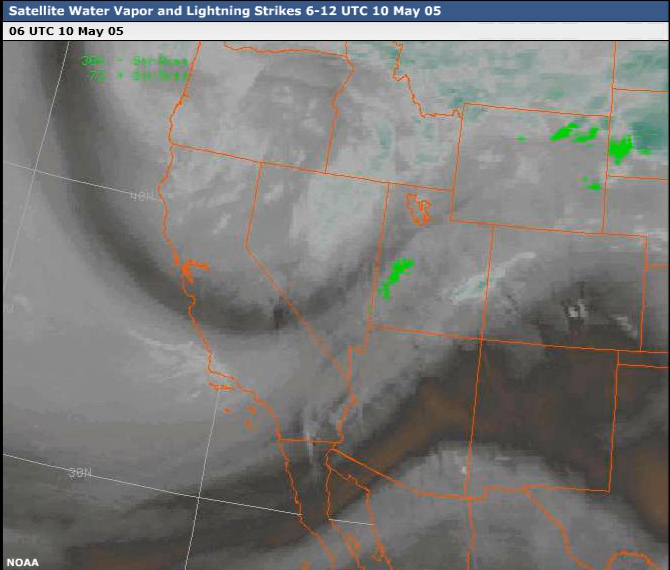
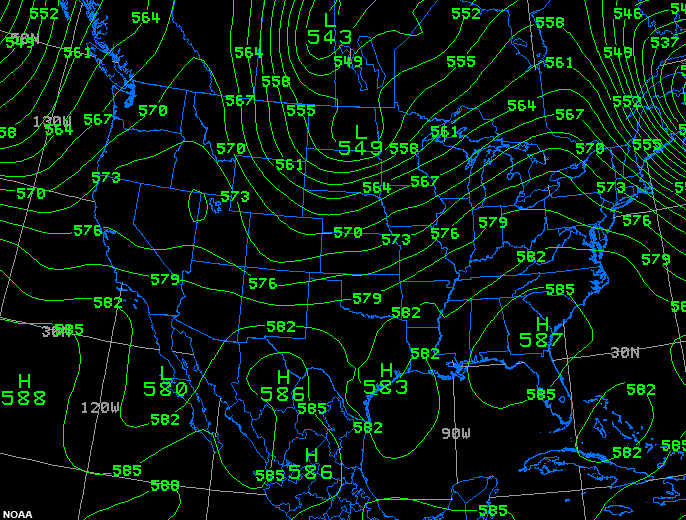
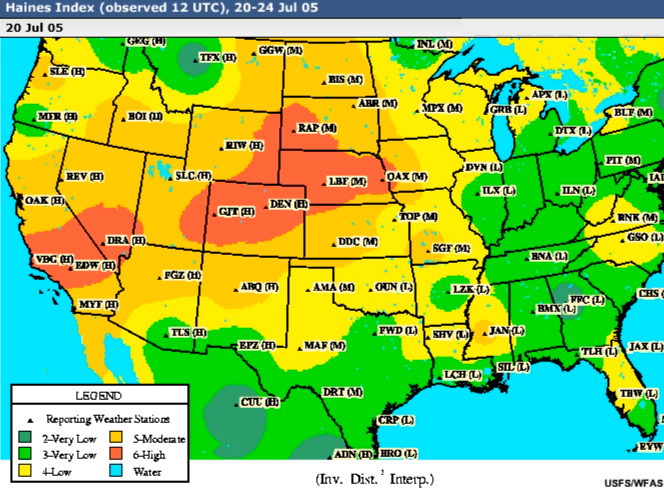
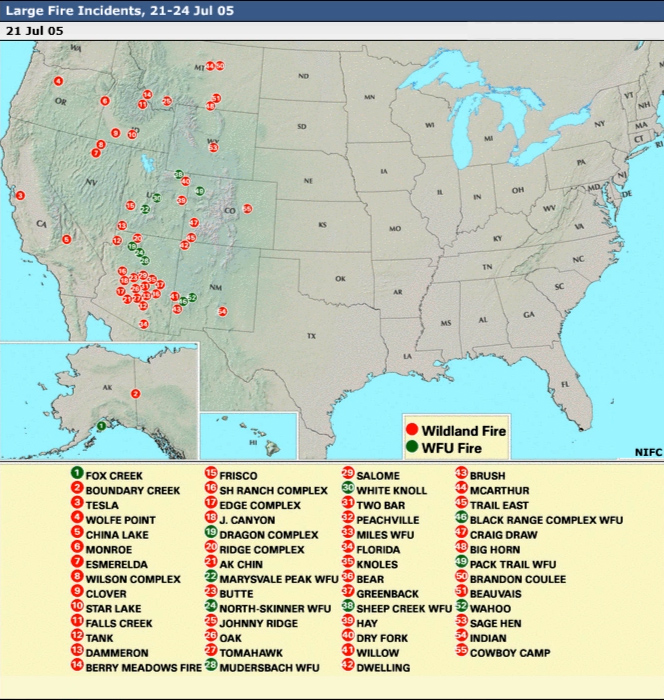
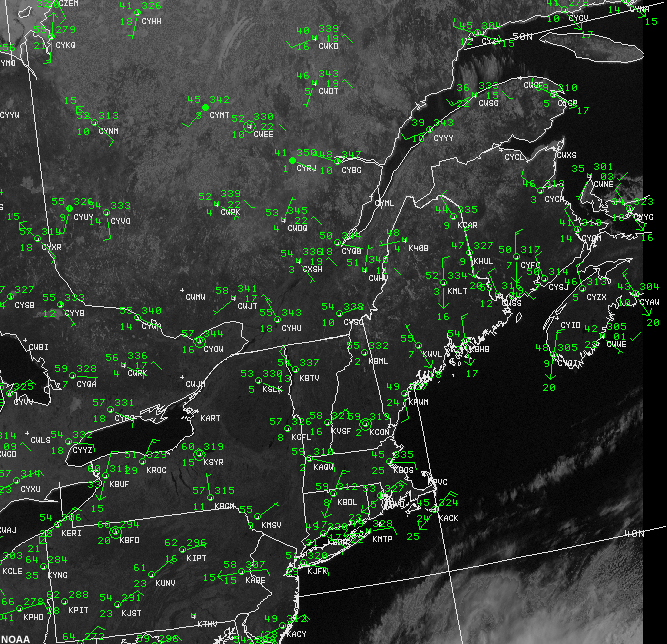
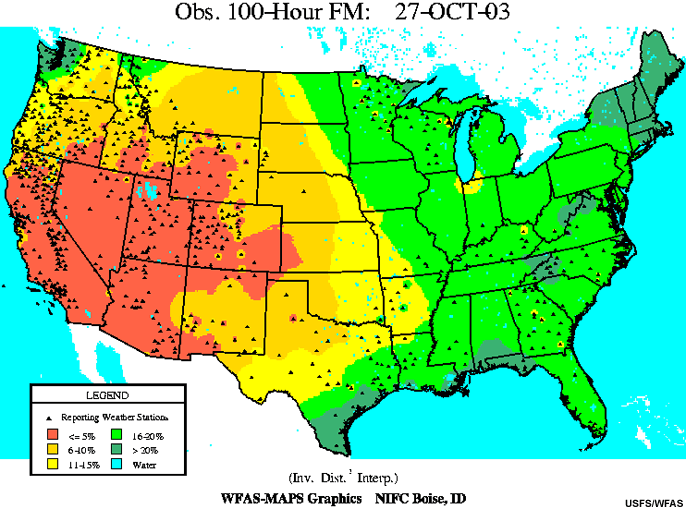
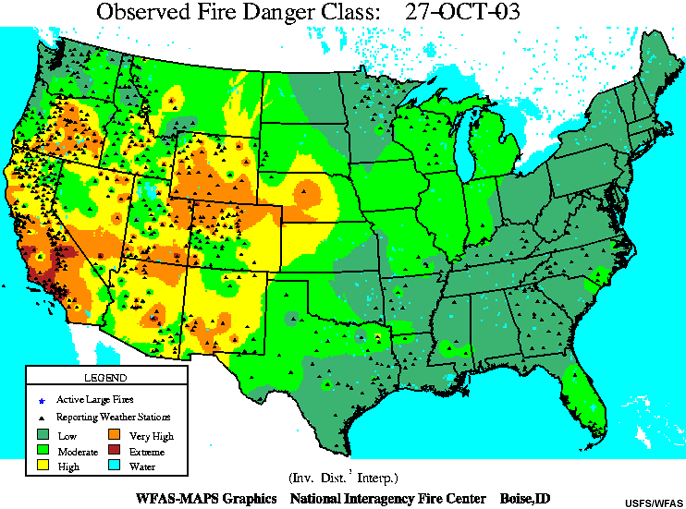
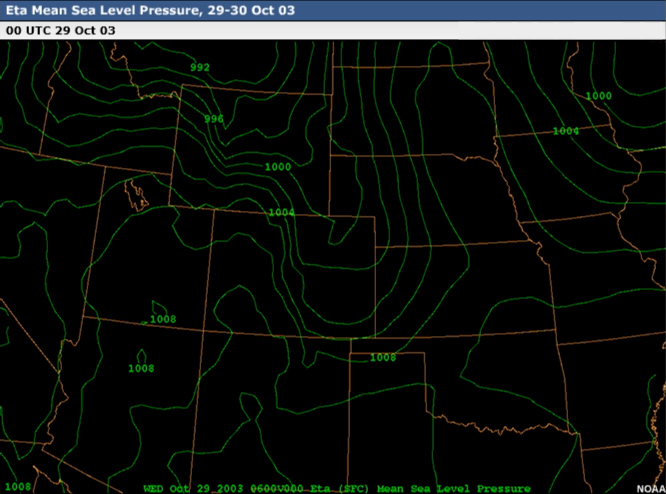
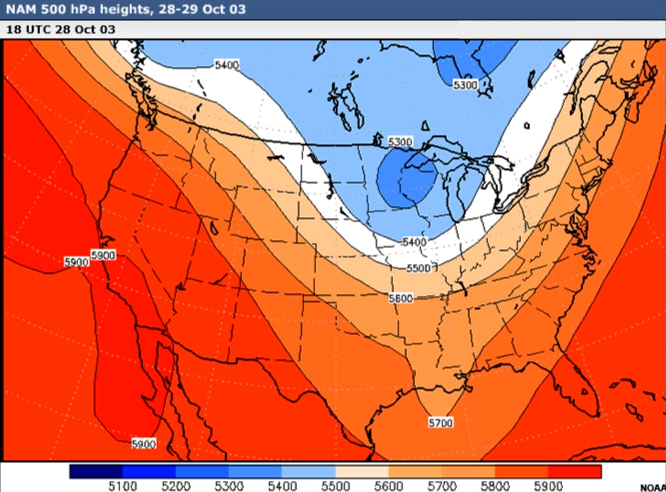
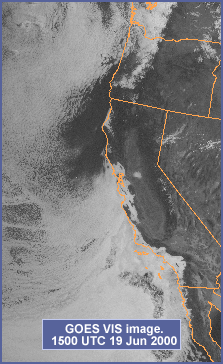
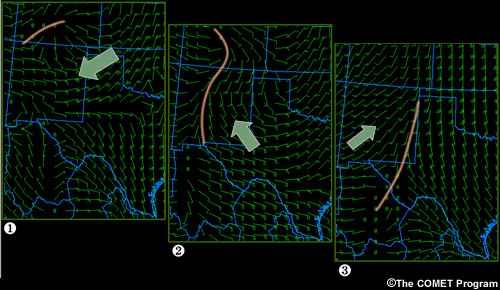
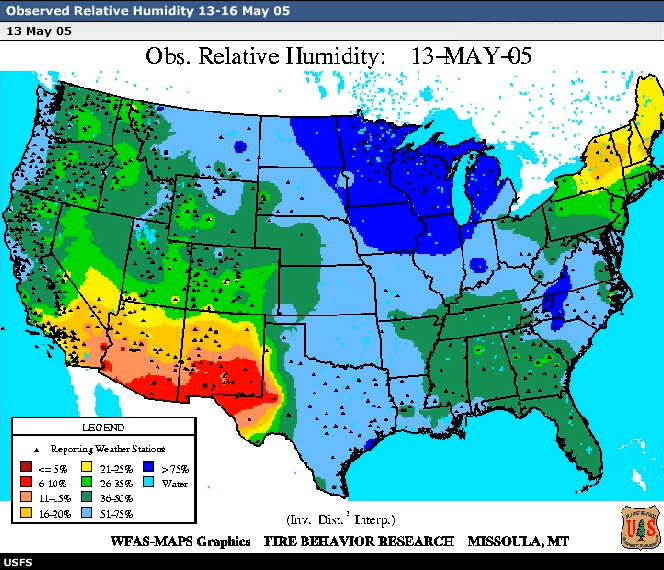
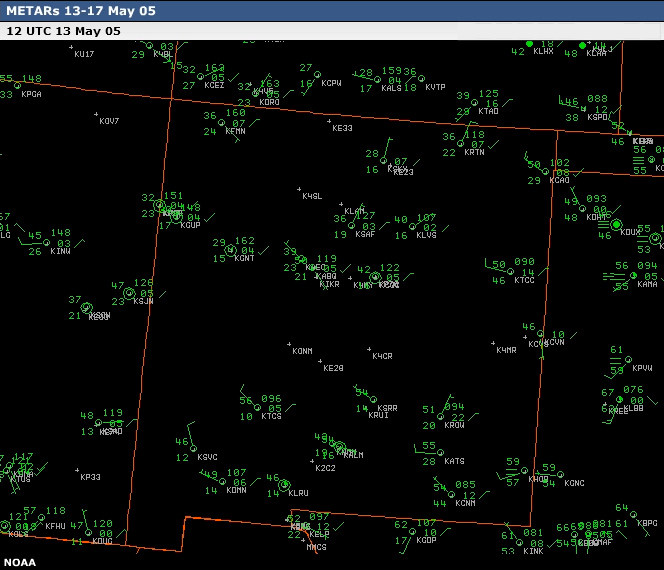
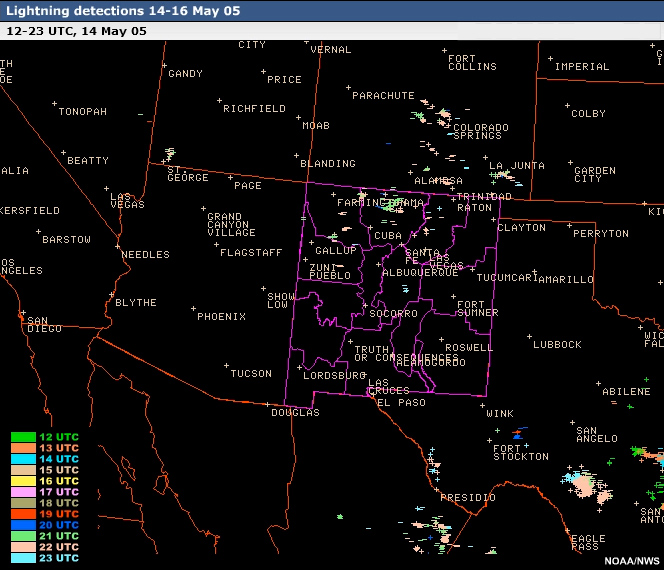
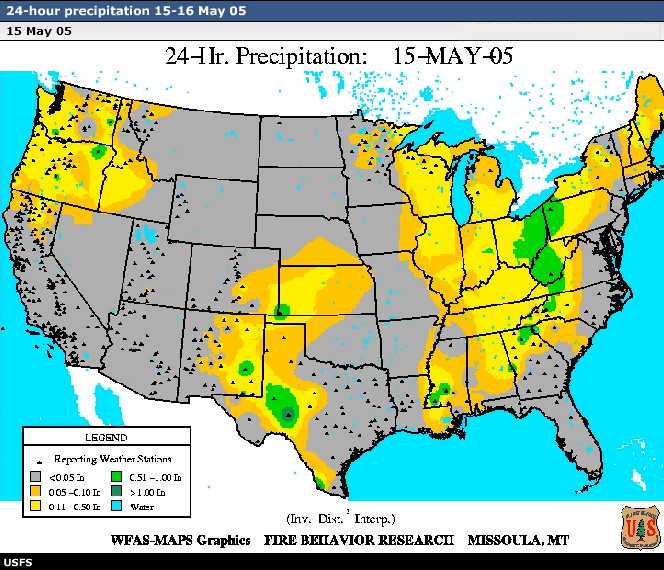
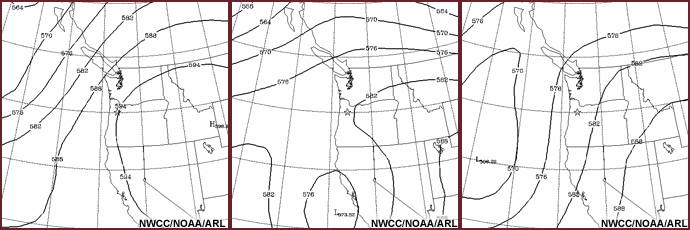
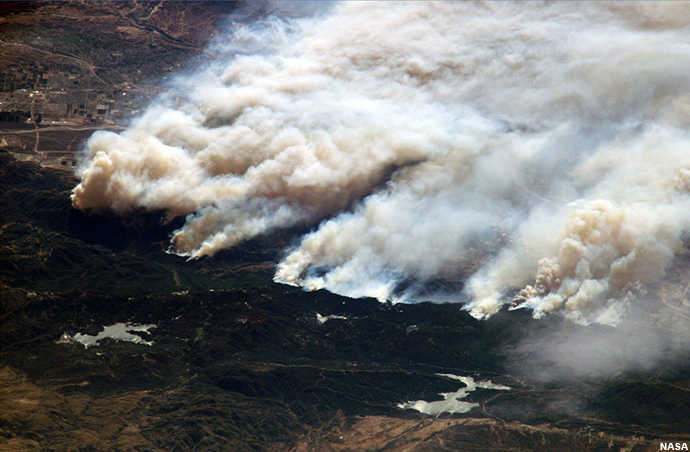
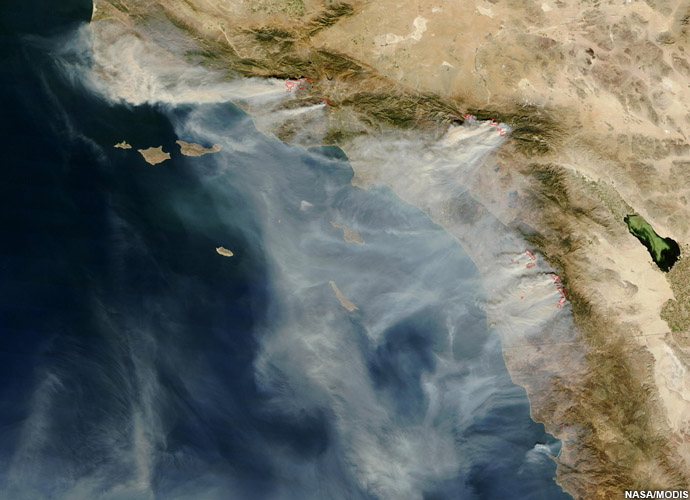
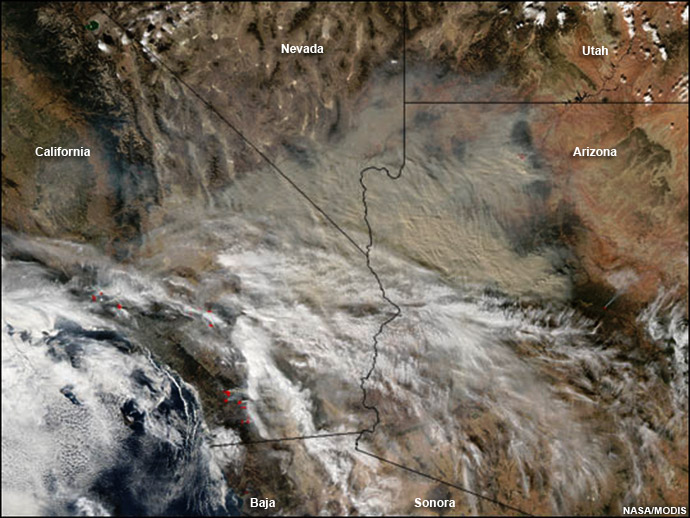
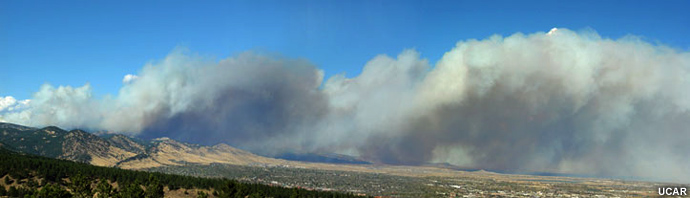
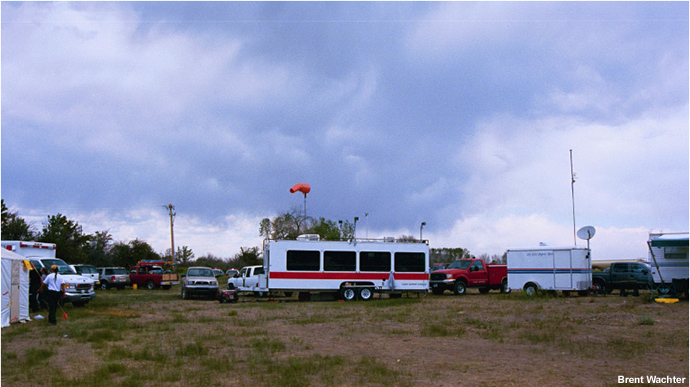
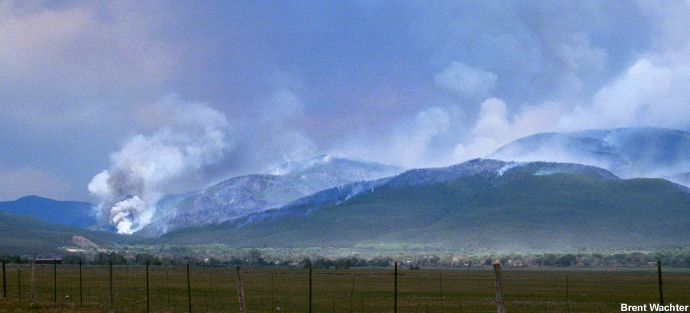
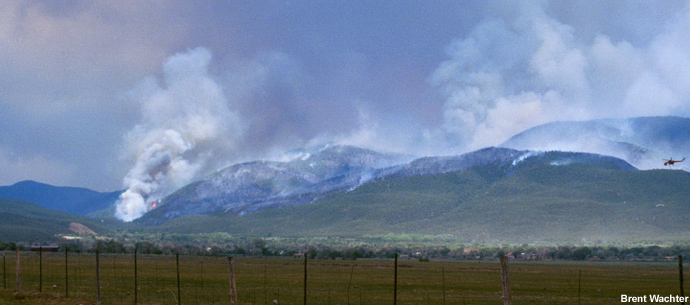
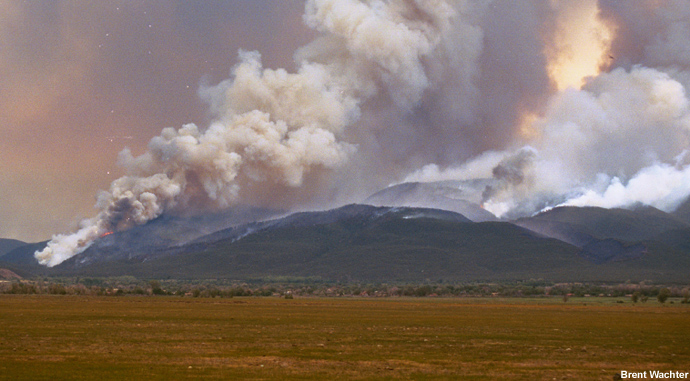
Set-up
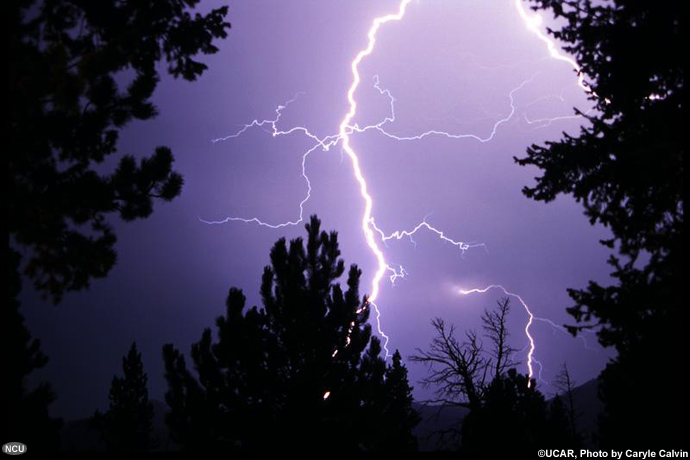
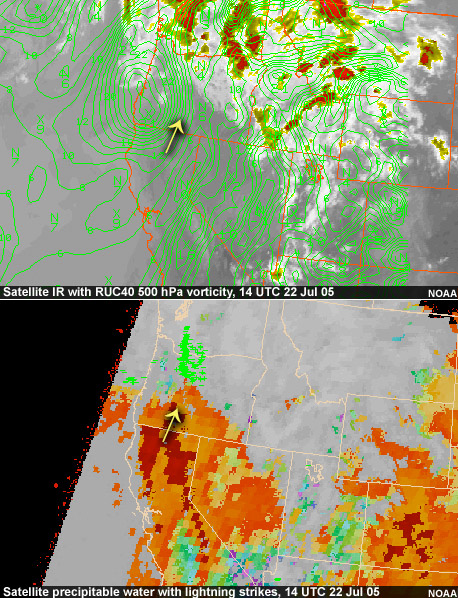
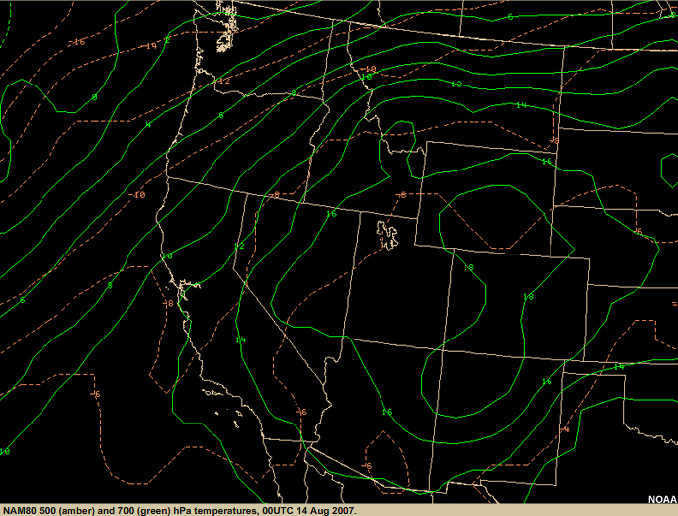
This practice case study represents an example of a rapid upper-ridge breakdown event over the western U.S. on 10
May 2005.
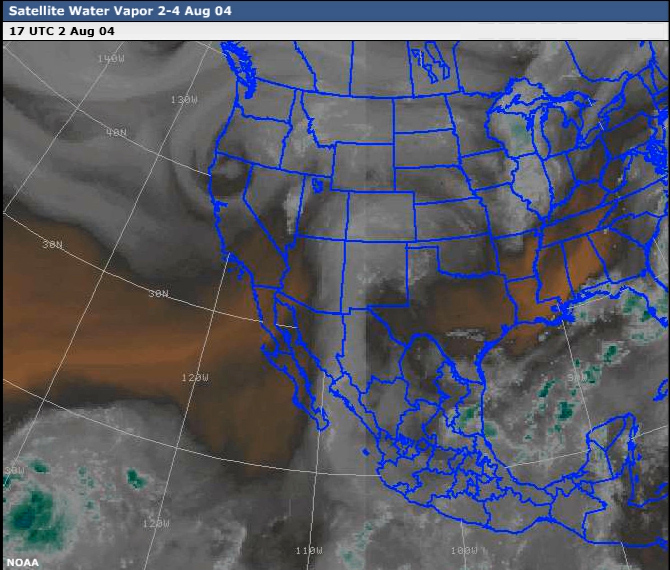
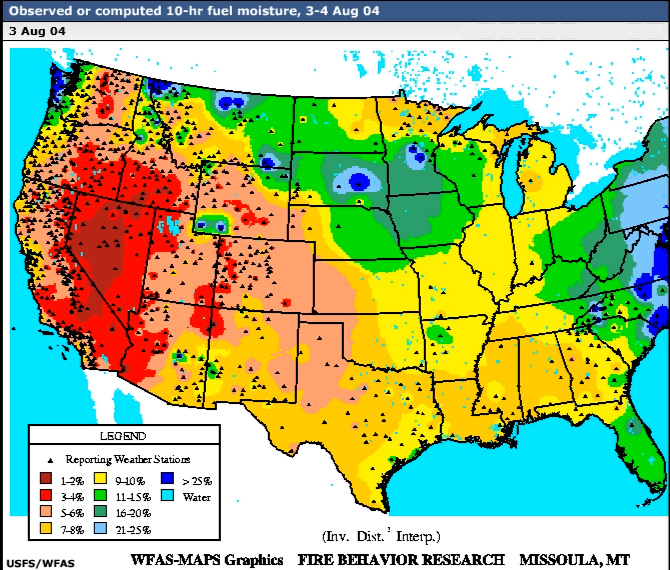
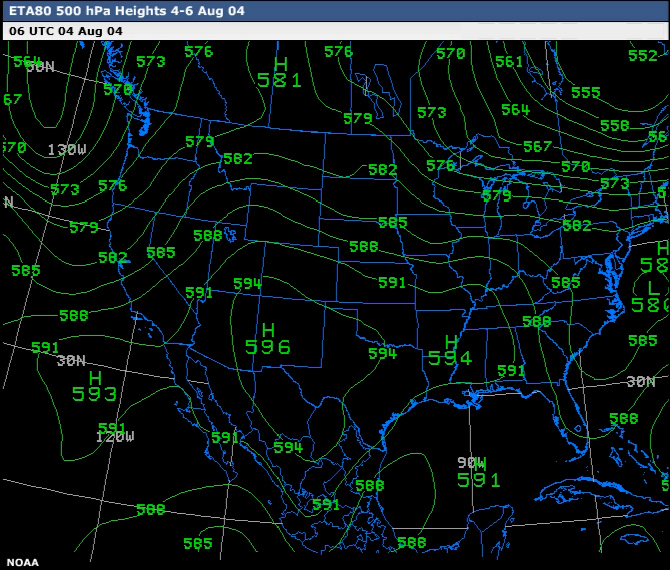
Examine the data products in the box below (check images to see the data products), then answer the
question that follows.
Question
Which of the following describe the situation during the morning of 10 May 2005? (Choose all that apply
then click Done.)
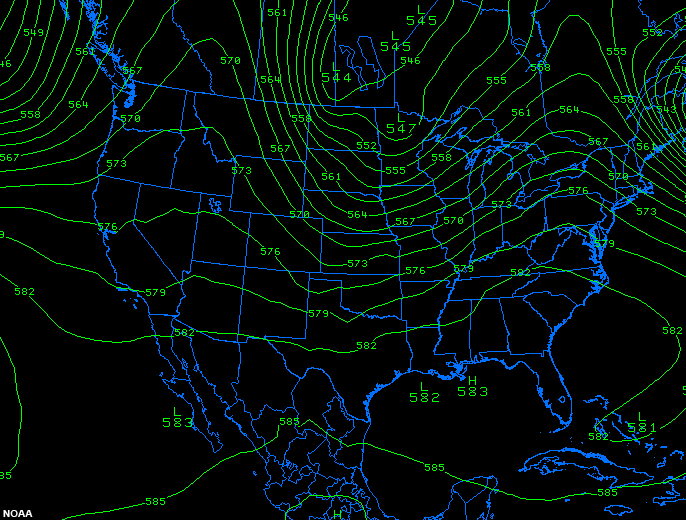
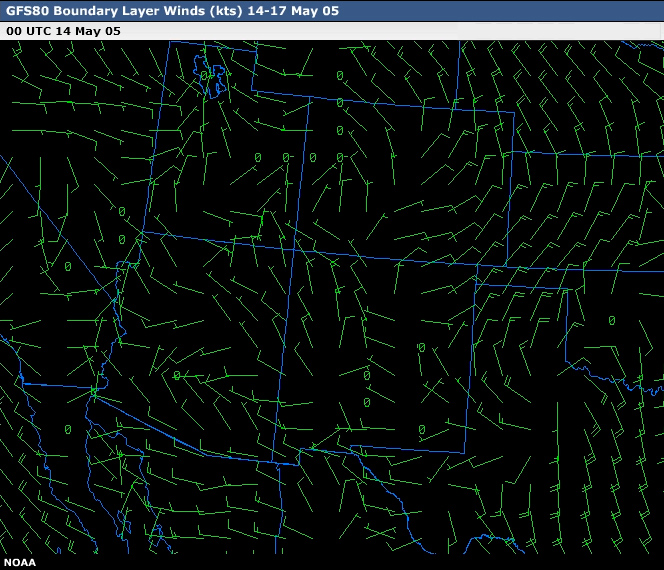
Evolution
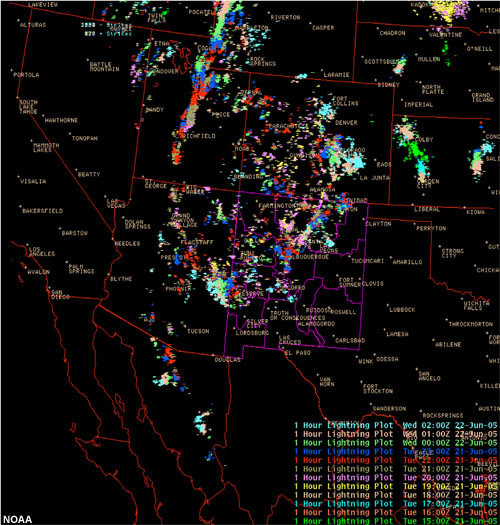
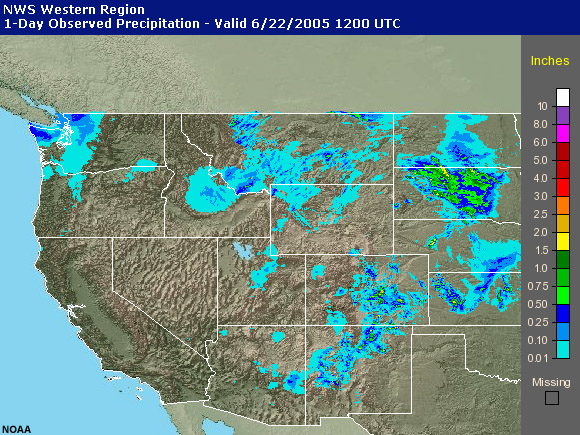
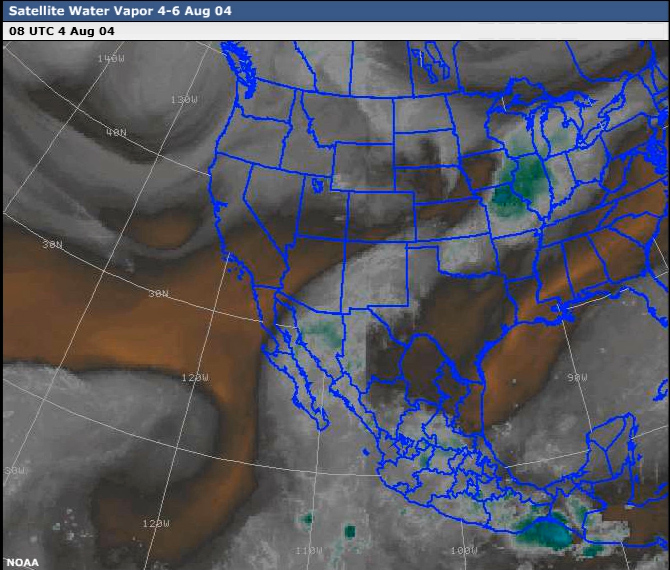
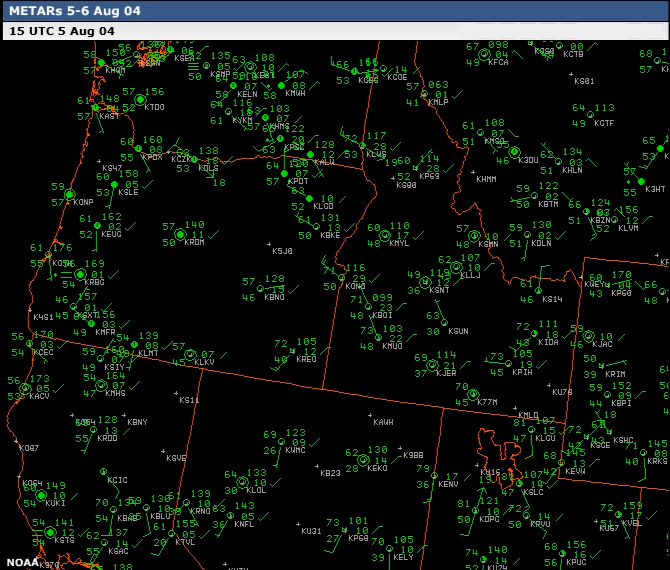
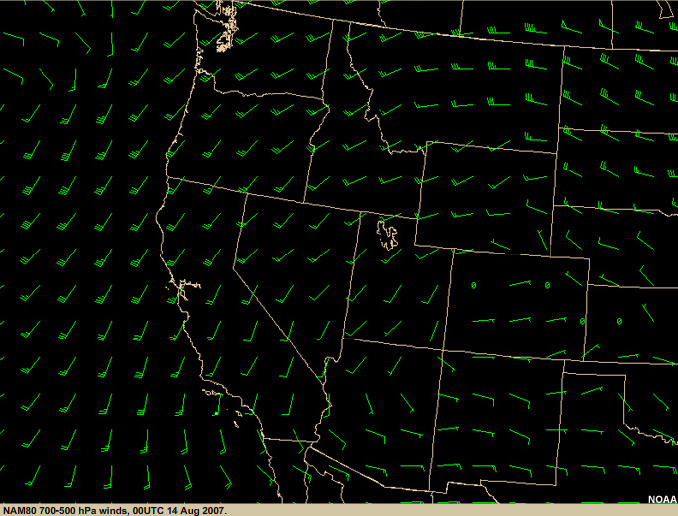
How did this event unfold? Examine the data products below (check images to see the data products).
Then complete the exercise that follows.
Question
What was the sequence of events? (Decide the order for each event, then click Done.)
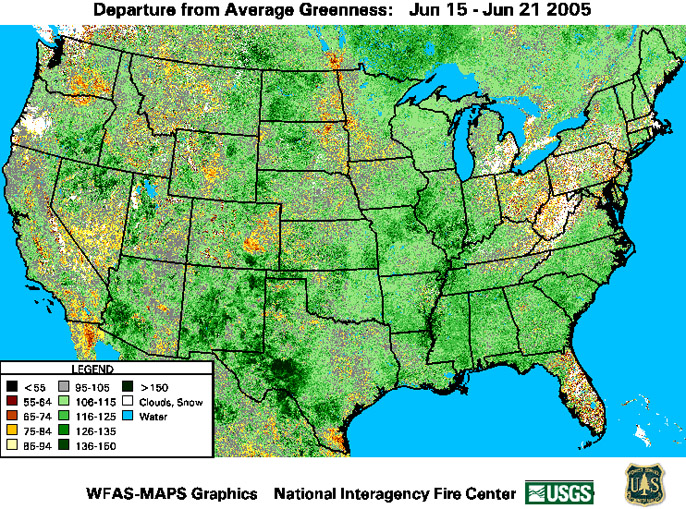
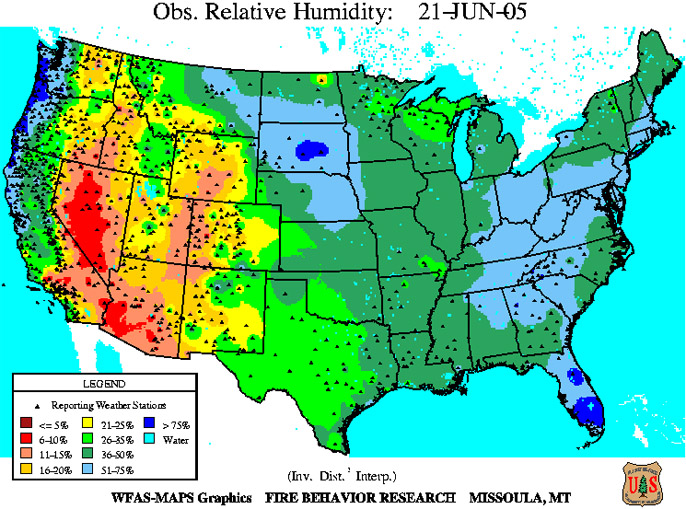
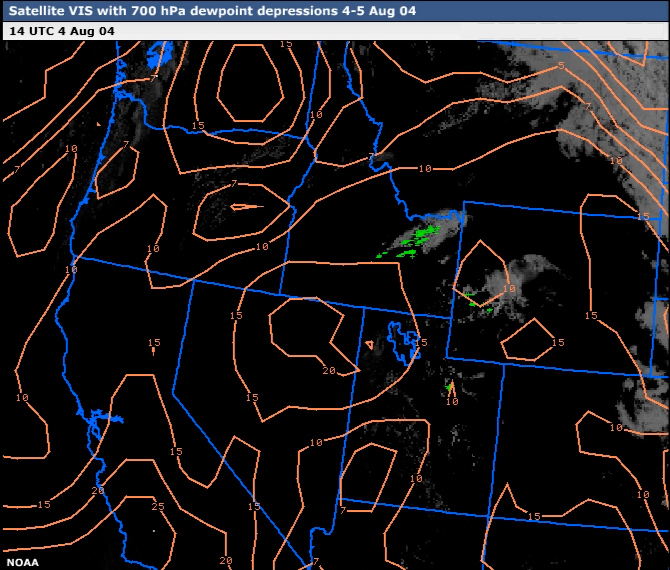
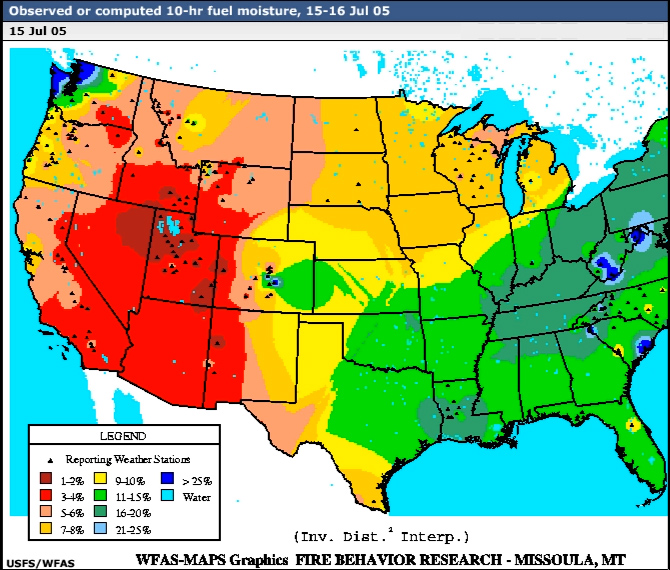
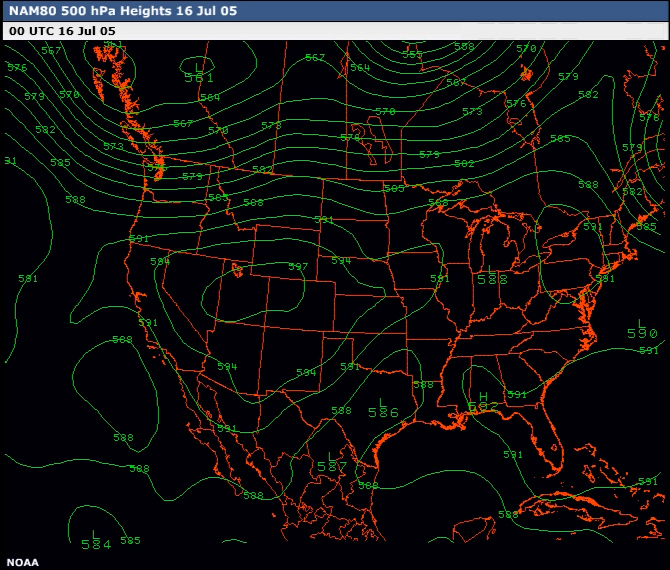
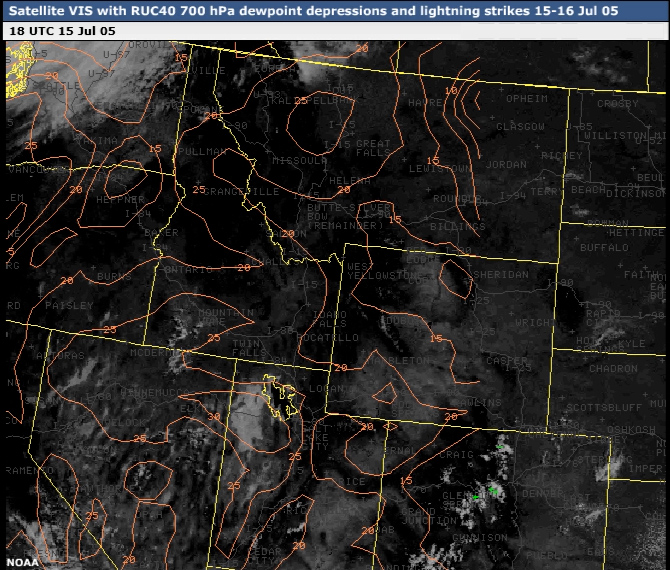
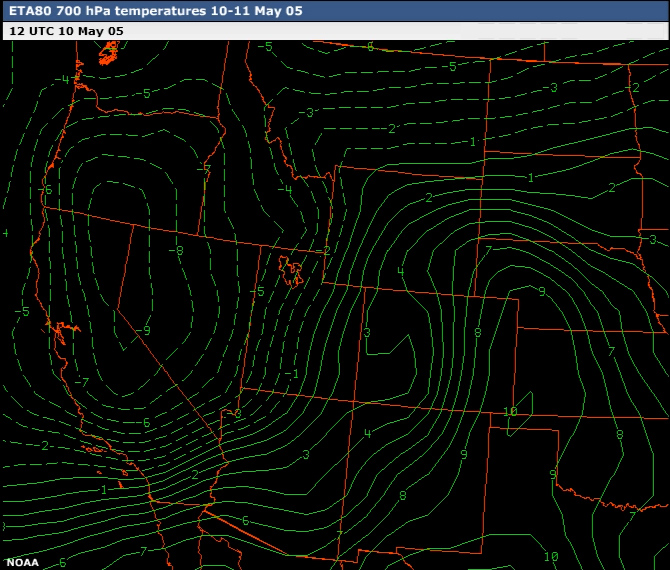
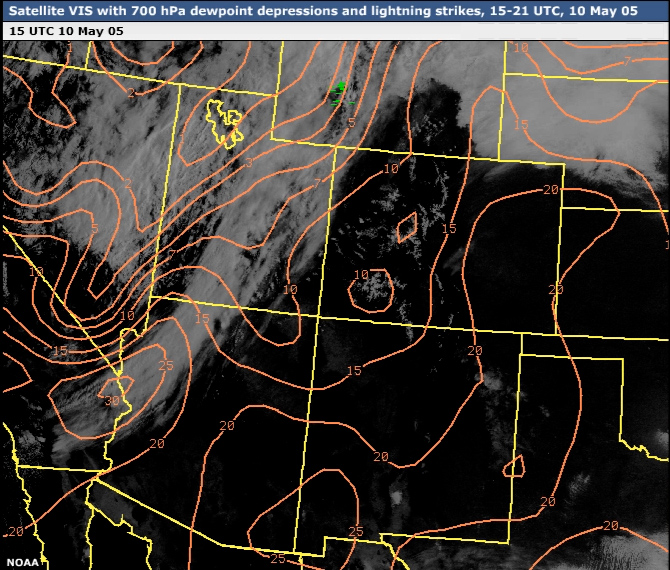
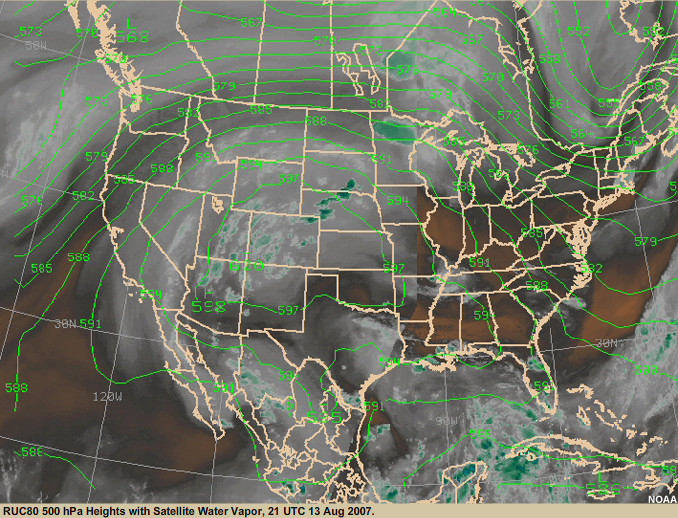
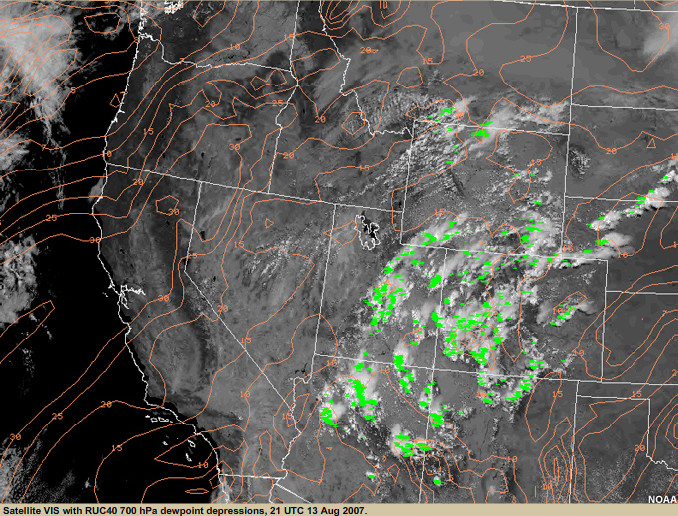
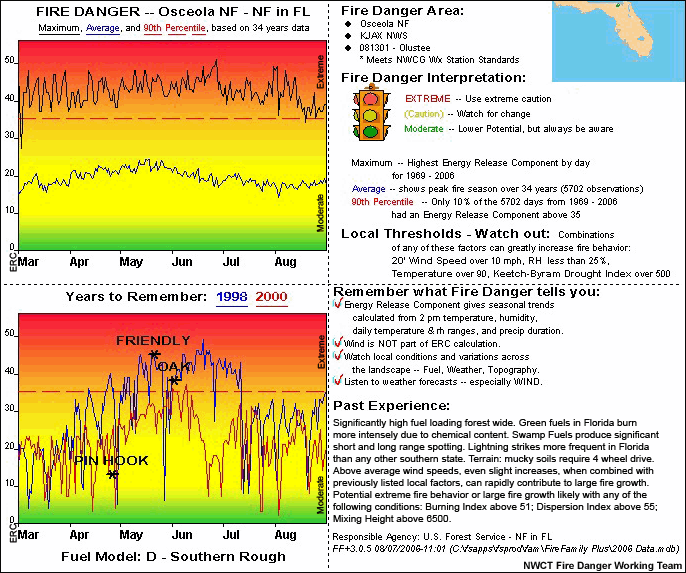
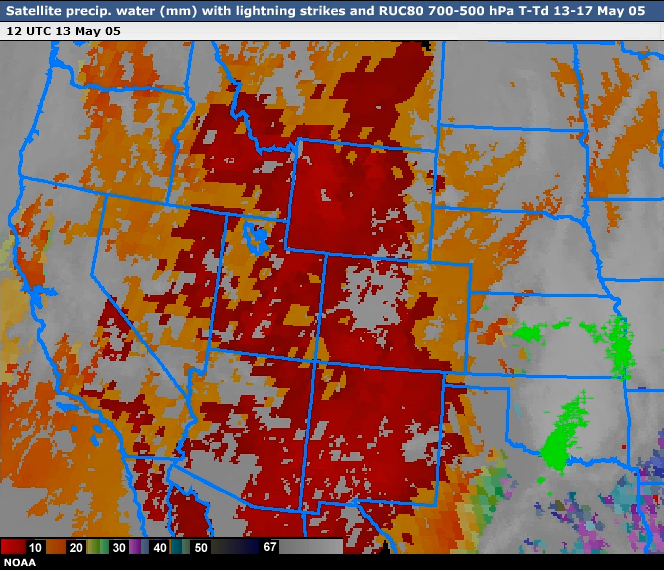
Fire Weather
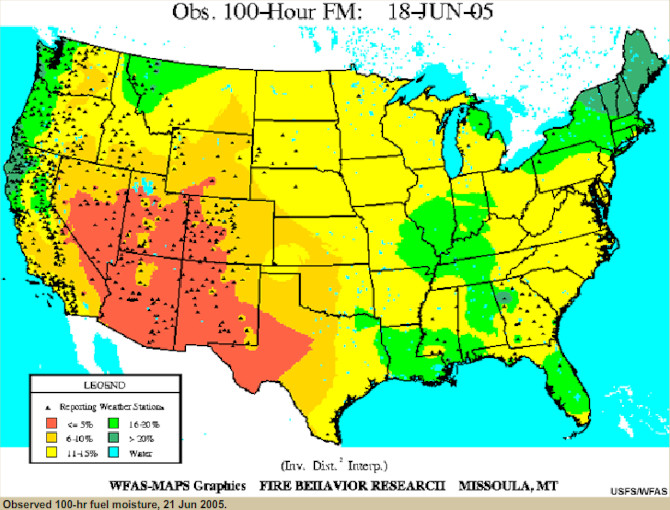
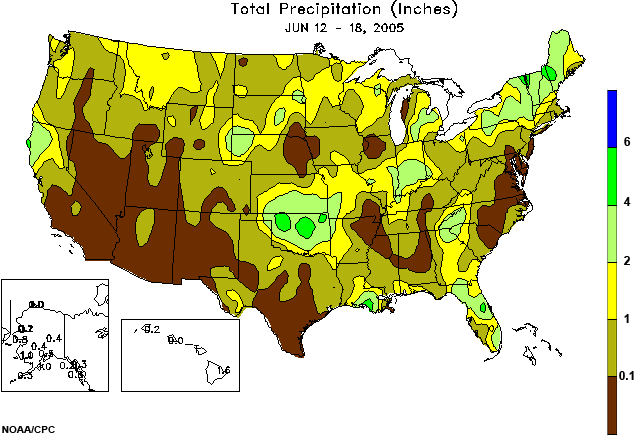
Take a second look at the loops of 700-500 hPa winds, 700 hPa temperatures, and satellite VIS with overlaid 700
hPa dewpoint depressions (checkimages to see the data loops). Try to decide which of the following
statements accurately identify key weather elements and transitions in this case study.
Question
Which of the following statements is/are true?(Choose all that apply then click Done.)
Outcomes
Strong mid-level flow associated with the translating closed low affected portions of the Southwest and west
Texas during the period of interest. As mixing progressed during the daylight period, this band of strong
southwesterly winds, coincident with a robust mid level dry slot and thermal ridge, brought gusty winds, low
humidity, and warm temperatures to the surface.
The southwesterly flow also prevented the dry line from progressing very far into eastern New Mexico during the
afternoon period. For a time, it was pushed a significant distance into west Texas, creating high fire danger
conditions across far west Texas. This type of east-west oscillation of the surface dry line across portions of
the Southern Plains can be difficult to forecast during the primary fire season.
Cooler temperatures and higher humidity levels followed the vigorous cold front, which reduced fire danger
levels across portions of the Four Corners area.
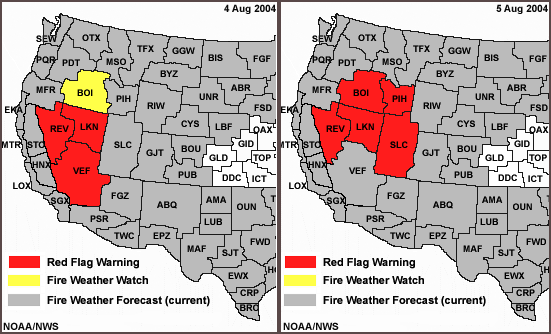
NWS offices in Albuquerque, El Paso, and Tucson all issued Red Flag Warnings for 10 May.
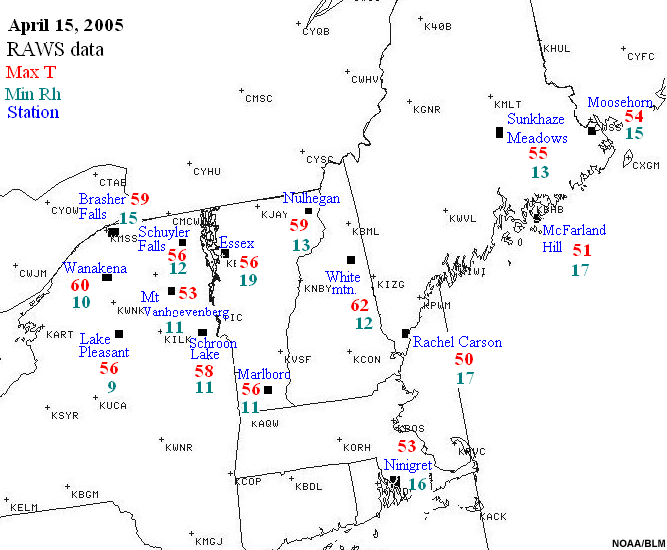
You have now completed this case study. Additional data, including the Red Flag Warning and fire danger class
maps and 24-hour RAWS summaries are included for your interest below.
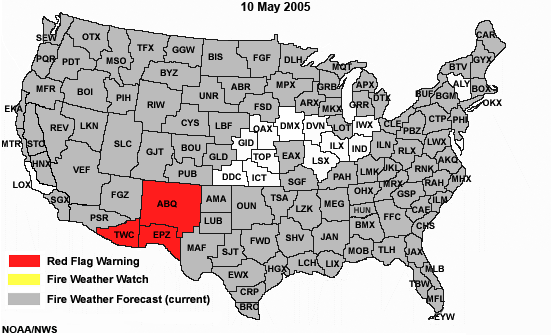
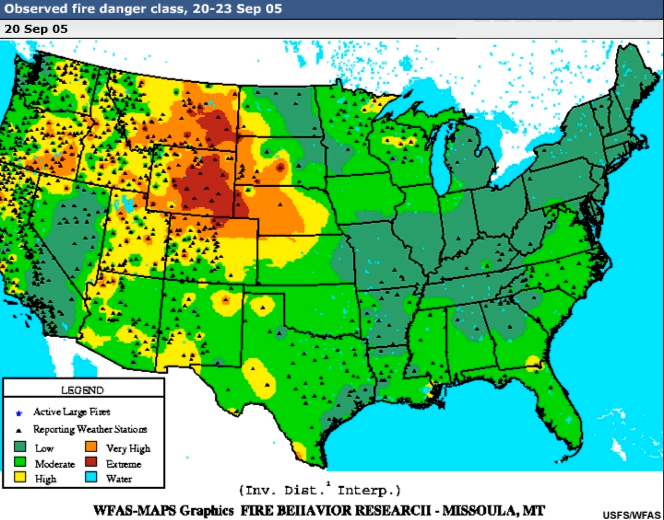
Red Flag Warnings issued by the National Weather Service 10 May 2005.
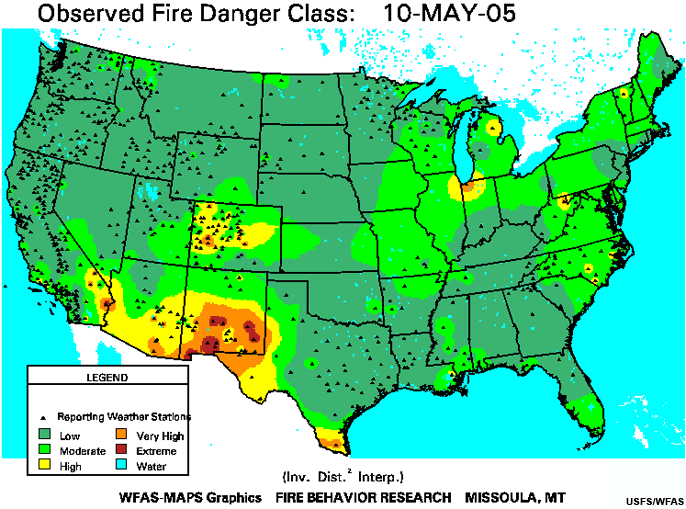
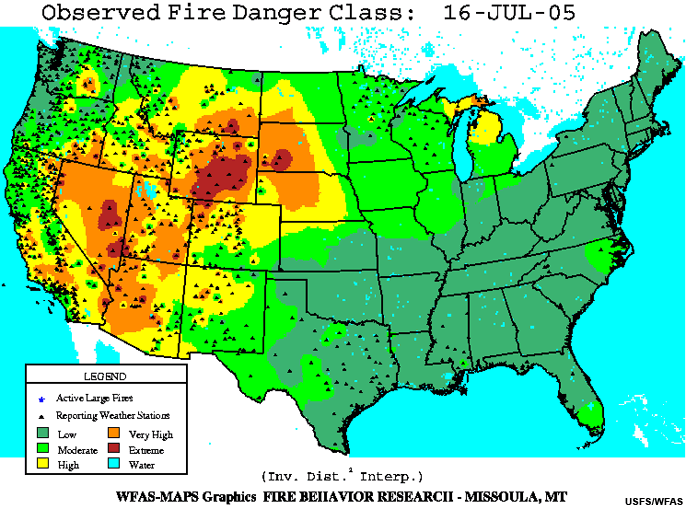
Observed Fire Danger Class for 10 May 2005. Fire danger ratings ranged from high to extreme
across southern Arizona & New Mexico and west Texas.
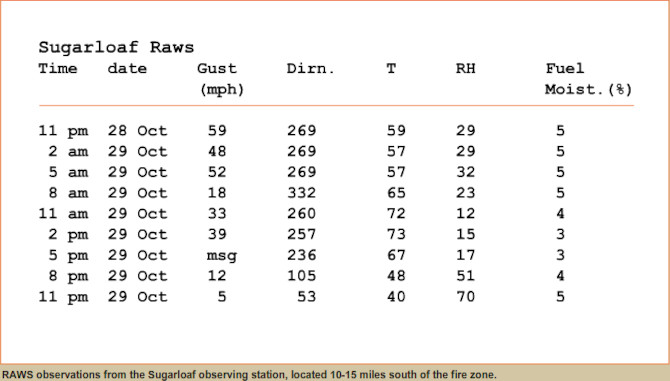
24-Hour RAWS Summaries
Arizona RAWS 24hr Summary Ending:  Wed May 11 2005 14:03Z
Use with caution.  Data may be incomplete or contain errors.  Times are GMT.

State                        Newest  Oldest   Total                       Peak
ID Name                 Elev Time    Time     Obs   Tx  Tn  Rx  Rn  Pcpn  Gust
==============================================================================
AZ ALPINE               8031 11/1306 10/1306  23    68  27  80  15  00.00  38
AZ AZSCA_PORT1          5600 11/1305 10/1305  23    76  35  65  14  00.00  26
AZ BLACK HILLS          3300 11/1331 10/1331  23    86  47  34  11  00.00  27
AZ BLACK ROCK           7080 11/1301 10/1301  23    42  30 100  56  00.08  27
AZ BRIGHT ANGEL         8134 11/1311 10/1311  23    46  28  72  29  00.00  39
AZ BUCKSKIN LO          7400 11/1322 10/1322  24    61  36  63  26  00.00  43
AZ BUCKSKIN MTN         6400 11/1310 10/1310  23    54  33  73  24  00.00  37
AZ CARR                 5400 11/1319 10/1319  24    76  42  44  15  00.00  25
AZ CARRIZO              6832 11/1319 10/1319  24    64  37  55  22  00.00  56
AZ CHEDISKI PEAK        7323 11/1322 10/1322  24    60  35  69  26  00.00  39
AZ CIBECUE RIDGE        6725 11/1320 10/1320  24    66  37  45  16  00.00  39
AZ CIBOLA               250  11/1348 10/1348  24    83  44  68   9  00.00  19
AZ COLUMBINE            9521 11/1302 10/1302  23    54  31  56  27  00.00  34
AZ CORONADO #1 PORTABL  5483 11/1324 10/1324  23    80  43  47  15  00.00  21
AZ COTTONWOOD RIDGE     6860 11/1400 10/1400  23    66  37  44  20  00.00  41
AZ CROWN KING           5900 11/1354 10/1354  17    60  36  52  12  01.90  28
AZ DEER SPRINGS         7211 11/1320 10/1320  24    61  36  58  21  00.00  43
AZ DRY LAKE             7428 11/1336 10/1336  23    68  35  48  18  00.00  32
AZ EMPIRE               4650 11/1302 10/1302  23    79  37  52  12  00.00  27
AZ FLAGSTAFF            7000 11/1306 10/1306  23    52  23  87  24  00.00  38
AZ FORT APACHE RX#1     5400 11/1314 10/1314  23    64  26  81  21  00.00  31
AZ FOUR SPRINGS         6560 11/1340 10/1340  24    55  33  82  19  00.00  54
AZ FRAZIER WELLS        6770 11/1315 10/1315  23    48  33  76  27  00.00  36
AZ GILA RIVER           1093 11/1322 10/1322  24    83  48  41  12  00.00  24
AZ GLOBE                3560 11/1306 10/1306  23    79  39  54  20  00.00  23
AZ GOODWIN MESA         4200 11/1303 10/1303  23    64  39  76  18  00.00   0
AZ GRASSHOPPER          6390 11/1320 10/1320  24    64  40  51  21  00.00  68
AZ GREENBASE            6923 11/1316 10/1316  24    52  20  86  19  00.00  35
AZ GREER                8200 11/1308 10/1308  23    62  23  61  14  00.00  37
AZ GUNSIGHT             5280 11/1303 10/1303  23    58  34  70  15  00.00  33
AZ GUTHRIE              6340 11/1304 10/1304  23    73  46  33  13  00.00  52
AZ HAVASU               475  11/1304 10/1304  23    84  38  71   9  00.00  14
AZ HEADQUARTERS         5400 11/1312 10/1312  23    79  39  45  11  00.00  44
AZ HEBER                6635 11/1305 10/1305  23    65  24  65  23  00.00  40
AZ HILLTOP              5720 11/1305 10/1305  21    70  24  89  23  00.00  24
AZ HOPI                 5602 11/1313 10/1313  22    66  26  77  17  00.00  40
AZ HOPKINS              7120 11/1319 10/1319  24    73  40  39  16  00.00  31
AZ HORSE CAMP CANYON    4040 11/1305 10/1305  23    79  49  32  14  00.00  40
AZ HOUSEROCK            5400 11/1305 10/1305  23    60  38  73  18  00.00  42
AZ HUMBUG CREEK         5250 11/1306 10/1306  23    59  43  53  15  00.00  38
AZ HURRICANE            5445 11/1306 10/1306  23    52  34  77  29  00.00  18
AZ IRON SPRINGS         5000 11/1306 10/1306  23    57  30  75  18  00.00  32
AZ JUMP-OFF RIDGE       7090 11/1322 10/1322  24    60  37  49  20  00.00  58
AZ JUNIPER RIDGE        6920 11/1320 10/1320  24    65  37  46  17  00.00  45
AZ LAKESIDE             7000 11/1400 10/1400  23    65  26  80  20  00.00  37
AZ LIMESTONE CANYON     6800 11/1336 10/1336  23    64  36  45  19  00.00  45
AZ MICRO 6-FM           5837 11/1321 10/1321  24    78  44  35  15  00.00  19
AZ MORMON LAKE          7400 11/1303 10/1303  23    53  26  79  24  00.00  40
AZ MOSS BASIN           5920 11/1308 10/1308  23    55  35  57  20  00.00   0
AZ MOUNT LOGAN          7200 11/1308 10/1308  23    43  30  70  40  00.00  21
AZ MOUNTAIN LION        5483 11/1314 10/1314  23    69  28  77  20  00.00  20
AZ MULESHOE RANCH       4560 11/1309 10/1309  23    80  44  37  10  00.00  40
AZ MUSIC MOUNTAIN       5420 11/1309 10/1309  23    55  32  59  18  00.00  21
AZ NIXON FLATS          6500 11/1302 10/1302  23    52  27  85  34  00.00  17
AZ NOON CREEK           4925 11/1337 10/1337  24    78  48  34  13  00.00  36
AZ O W SADDLE           7300 11/1319 10/1319  24    61  33  59  23  00.00  35
AZ OAK CREEK            4924 11/1303 10/1303  23    63  35  60  18  00.00  29
AZ OLAF KNOLLS          2900 11/1310 10/1310  23    65  44  57  20  00.01  40
AZ PARIA POINT          7235 11/1340 10/1340  24    52  32  72  17  00.00  41
AZ PAYSON               4975 11/1215 10/1215  22    69  37  54  15  00.00  30
AZ PINEY HILL           8102 11/1341 10/1341  24    62  27  66  21  00.00  34
AZ PLEASANT VALLEY      5050 11/1341 10/1341  25    69  32  53  24  00.00  31
AZ PROMONTORY           7800 11/1302 10/1309  23    53  28  74  28  34.38  38
AZ RED LAKE             6200 11/1359 10/1359  23    69  25  83  27  00.00  24
AZ RINCON               8240 11/1357 10/1357  23    66  32  50  20  00.00  33
AZ ROBINSON TANK        5560 11/1311 10/1311  23    57  32  78  22  00.00  30
AZ ROOSEVELT            2180 11/1111 10/1111  25    82  53  45  12  00.00  23
AZ RUCKER               5700 11/1308 10/1308  23    76  38  47  13  00.00  48
AZ SAGUARO              3100 11/1308 10/1308  23    89  46  41  10  00.00  26
AZ SAN CARLOS #1        2840 11/1314 10/1314  23    85  46  50  14  00.00  35
AZ SASABE               3500 11/1333 10/1333  23    82  38  73  21  00.00  33
AZ SCOUT CAMP           7554 11/1337 10/1337  24    66  36  37  17  00.00  26
AZ SELLS                2366 11/1314 10/1314  23    84  47  49  15  00.00  26
AZ SMITH PEAK           2500 11/1331 10/1331  23    72  53  42  11  00.00  26
AZ STANTON              3600 11/1312 10/1312  23    67  51  63  11  00.00  35
AZ STRAY HORSE          7020 11/1319 10/1319  24    70  37  58  18  00.00  17
AZ SUNSET POINT         2960 11/1312 10/1312  23    74  44  43   7  00.00  32
AZ TONTO PORTABLE #2    4905 11/1336 10/1336  24    64  33  64  14  00.00  92
AZ TRAIL CABIN          6279 11/1308 10/1308  23    76  41  47  15  00.00  27
AZ TRUXTON CANYON       5350 11/1314 10/1314  23    54  40  66  24  00.00  32
AZ TUSAYAN              6697 11/1308 10/1308  23    54  22  99  22  00.00  21
AZ TWEEDS POINT         5200 11/1313 10/1313  23    52  39  67  32  00.02  40
AZ TWIN WEST            5936 11/1316 10/1316  24    52  31  81  29  00.00  26
AZ UNION PASS           3520 11/1313 10/1313  23    66  48  34   6  00.00  25
AZ VERDE                3100 11/1305 10/1305  23    73  36  56   7  00.00  34
AZ WARM SPRINGS CANYON  8010 11/1323 10/1323  23    48  26  95  35  33.65  36
AZ YELLOW JOHN MOUNTAI  6160 11/1310 10/1310  23    51  23 100  28  00.00  28
NWS - Boise, Idaho
New Mexico RAWS 24hr Summary Ending:  Wed May 11 2005 14:03Z
Use with caution.  Data may be incomplete or contain errors.  Times are GMT.
State                        Newest  Oldest   Total                       Peak
ID Name                 Elev Time    Time     Obs   Tx  Tn  Rx  Rn  Pcpn  Gust
==============================================================================
NM ALB PORTABLE #2      8140 11/1306 10/1306  23    74  35  54   7  00.00  18
NM ALBINO CANYON        7160 11/1322 10/1322  24    71  36  87  13  00.00  32
NM BARTLEY              8339 11/1304 10/1304  23    66  42  46  16  00.00  27
NM BATDRAW              4425 11/1345 10/1345  24    91  62  80   8  00.00  31
NM BEAR WALLOW          9953 11/1319 10/1319  24    61  30  58  18  00.00  31
NM BEAVERHEAD           6700 11/1321 10/1321  24    71  35  62  15  00.00  34
NM BLUEWATER CREEK      7624 11/1309 10/1309  23    70  22  95  14  00.00  31
NM BLUEWATER RIDGE      8289 11/1305 10/1305  23    68  29  63  15  00.00  24
NM BOSQUE               4500 11/1303 10/1303  23    88  40  67   8  00.00  31
NM BRUSHY MOUNTAIN      8789 11/1349 10/1349  24    70  31  64   7  00.00  35
NM CAPROCK              4210 11/1326 10/1326  23    89  61 100  15  00.00  34
NM CARLSBAD PORTABLE    3532 11/1340 10/1340  24    95  61  60   6  00.00  28
NM CHUPADERA            6520 11/1327 10/1327  23    81  52  25   5  00.00  34
NM CIMARRON             8744 11/1309 10/1309  23    67  40  48  15  00.00  27
NM COSMIC               9100 11/1315 10/1315  23    65  42  49  14  00.00  25
NM COYOTE               8800 11/1240 10/1240  22    67  35  52  12  00.00  23
NM CUBA                 6172 11/1329 10/1329  23    75  43  47   7  00.00  30
NM DATIL                8300 11/1311 10/1311  23    69  31  87  14  00.00  30
NM DEADMAN PEAK         8450 11/1307 10/1307  23    70  35  79   9  00.00   0
NM DRIPPING SPRINGS     6172 11/1314 10/1314  23    78  53  34   7  00.00  37
NM DUNKEN               5500 11/1327 10/1327  23    84  51  31   7  00.00  34
NM EIGHT MILE DRAW      3697 11/1318 10/1318  24    94  53 100   6  00.00  36
NM GILA CENTER RAWS     5600 11/1319 10/1319  24    79  32  60  12  00.00  30
NM GRANTS               8449 11/1316 10/1316  24    67  26  79  13  00.00  24
NM HACHITA VALLEY       4291 11/1319 10/1319  24    87  50  41   7  00.00  31
NM JARITA MESA          8803 11/1316 10/1316  24    67  36  69  15  00.00  19
NM JEMEZ                7999 11/1310 10/1310  23    71  36  69  15  00.00  25
NM LAGUNA               5773 11/1333 10/1333  23    80  46  49   8  00.00  32
NM LINCOLN PORTABLE     7102 11/1330 10/1330  23    73  32  31  13  00.00  21
NM MAGDALENA            8500 11/1249 10/1249  22    70  36  54   9  00.00  28
NM MALPIAS LAVA FLOW    7514 11/1321 10/1321  24    72  28  58   9  00.00  33
NM MAYHILL              6558 11/1301 10/1301  23    77  40  51  10  00.00  26
NM MESCAL               6227 11/1349 10/1349  24    74  43  49  12  00.00  34
NM MILLS CANYON         5856 11/1305 10/1305  23    79  49  91  12  00.00  42
NM MOUNTAINAIR          6500 11/1305 10/1305  23    76  43  52  10  00.00  34
NM OAK FLATS            7550 11/1250 10/1250  22    74  40  62  12  00.00  22
NM PADUCA               3510 11/1328 10/1328  23    95  59 100  15  00.00  31
NM PECOS                8600 11/1220 10/1220  22    73  43  33   7  00.00  34
NM PELONA MOUNTAIN      8080 11/1323 10/1323  23    69  38  44   8  00.00  34
NM QUEEN                5605 11/1313 10/1313  23    83  59  84  11  00.00  26
NM RAMAH                7038 11/1334 10/1334  23    72  28  63  14  00.00  36
NM ROSWELL #1 PORTABLE  3572 11/1344 10/1344  24    80  38  53  10  00.00  30
NM ROSWELL #2 PORTABLE  3572 11/1320 10/1320  25    93  54 100   6  00.00  31
NM SAN ANDRES           6138 11/1304 10/1304  23    79  54  32   7  00.00  29
NM SANDIA LAKES         5000 11/1342 10/1342  24    85  48  67  13  00.00  18
NM SIERRA DE LAS UVAS   5000 11/1330 10/1330  23    84  58  26   6  00.00  41
NM SLAUGHTER            8680 11/1319 10/1319  24    69  30  73  14  00.00  27
NM SMOKEY BEAR          6900 11/1400 10/1400  23    76  46  31  10  00.00  24
NM SOCORRO PORTABLE     7407 11/1343 10/1343  24    70  43  51  13  00.00  38
NM TAOS PORTABLE #2     9122 11/1348 10/1348  24    62  38  61  17  00.00  32
NM TOWER                6500 11/1321 10/1321  24    76  47  38  12  00.00  33
NM TRUCHAS              8340 11/1310 10/1310  23    65  31  85  19  00.00  25
NM WASHINGTON PASS      9370 11/1341 10/1341  24    58  23  76  25  00.00  29
NM zz STONE LAKE        7440 10/1200 09/1300  24    69  38  64  16  00.00   0
NM zz ZUNI              6320 10/1300 09/1400  24    74  37  68  14  00.00   0
NWS - Boise, Idaho
NWS/BLM
You have completed this section on Breakdown of the Upper Ridge pattern.
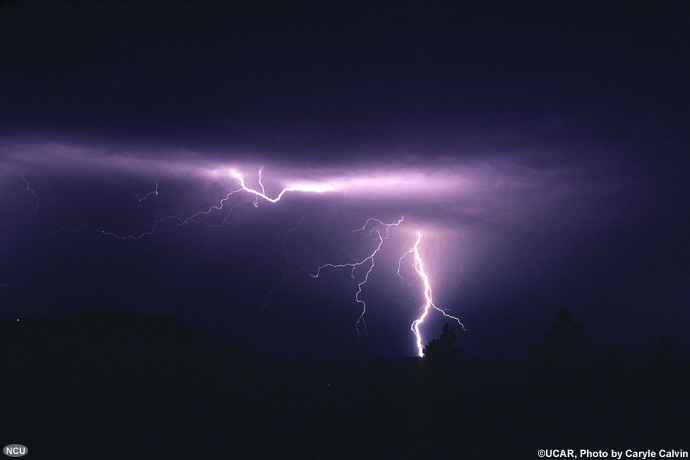
Moisture Surges
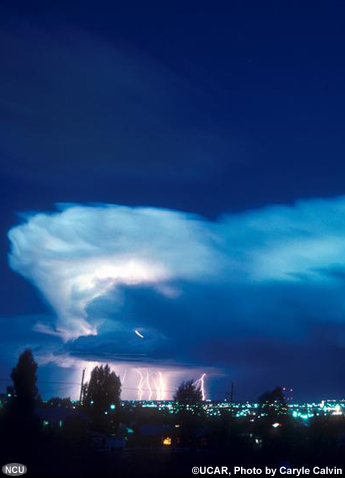
Moisture surges can produce both wet and dry lightning.
Dry lightning is frequently generated on the peripheries of moisture plumes as they surge northward from their
source regions, the Gulf of Mexico and the Gulf of California. This section introduces two common moisture surge
patterns and presents case study examples of each.
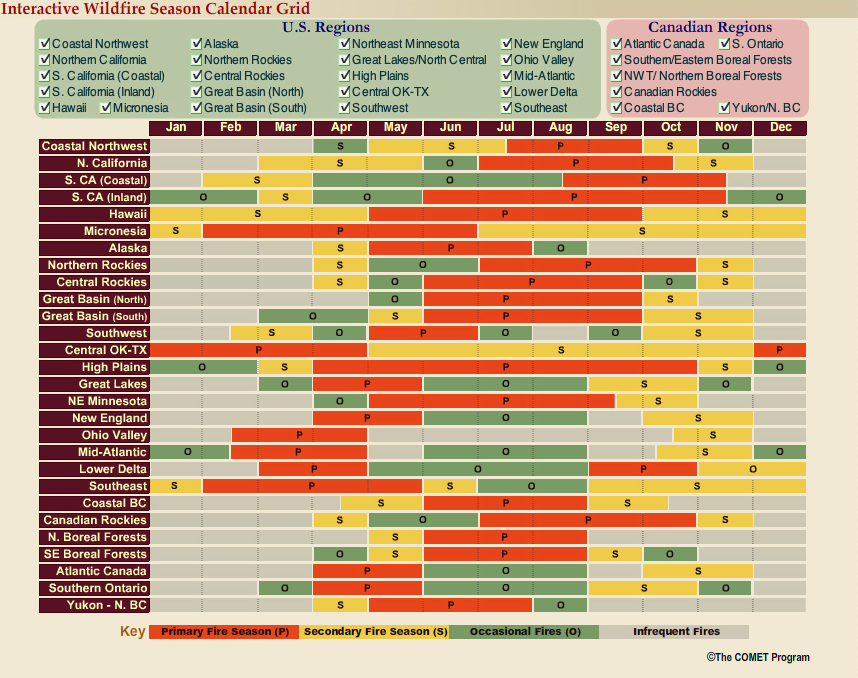
Overview
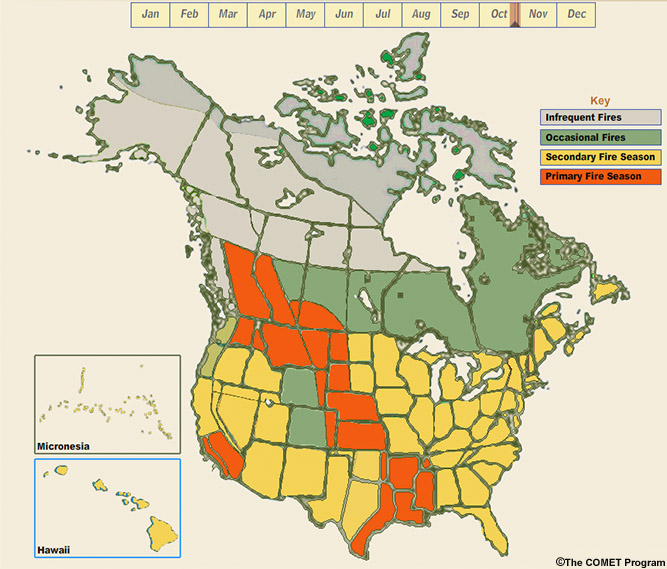
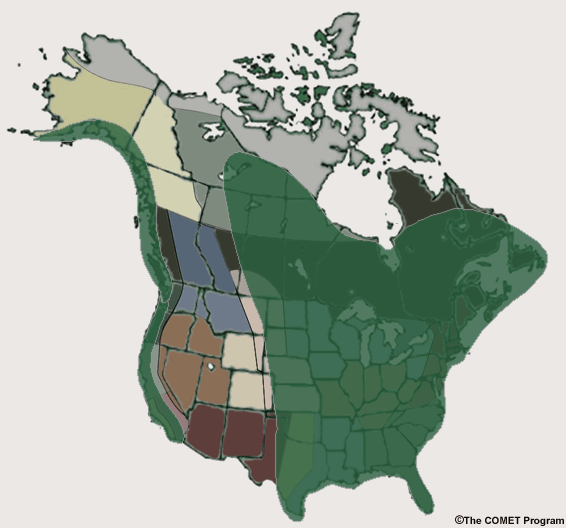
Introduction
The moisture surge pattern is important for the desert southwestern region of the US, not only
for New Mexico and Arizona but also for the southern and central Rockies, southern plains, Great Basin, southern
California, and occasionally the northern Rockies. This pattern type includes both
Pre-monsoon and High Plains surges. These two phenomena typically impact the
desert Southwest early in the Western fire season. As fire season spreads northward these two moisture surge
patterns affect areas farther to the north and evolve into another pattern called the Hybrid (described in a separate section).
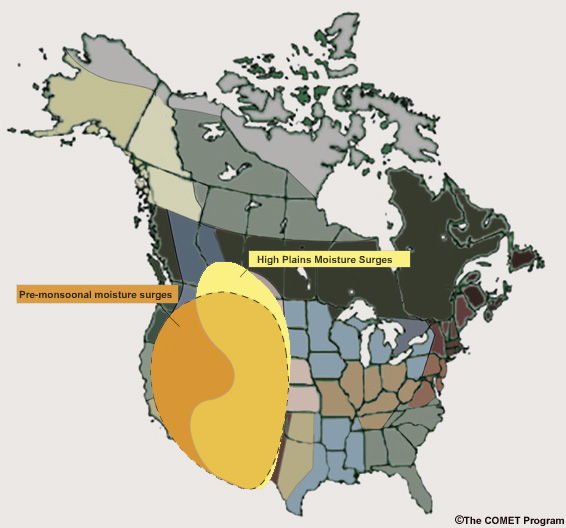
Regional distributions of the two main categories of moisture patterns. The High Plains
moisture surge occurs as a distinct pattern earlier in the season and contributes to the pre-monsoon pattern
during the critical fire period across southern latitudes of the western U.S.
Seasons
The High Plains pattern can affect the western US fire potential between late February and mid-autumn, but is
most common between April and October. Events generally last 2-5 days.
May is the month during which the High Plains surge, as a distinct pattern, generates the most significant
lightning fire starts.
Critical lightning fire events are also highly correlated with the pre-monsoon period which extends from late
May into early July. This period coincides with the time of year when fuels are generally driest.
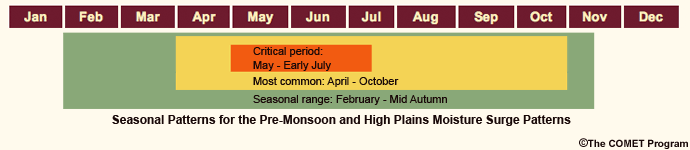
Seasonal ranges for the moisture surge patterns.
Trigger
The key triggers are increasing boundary layer-700 hPa moisture combined with increasing instability. Moisture
in High Plains surge events originates in the Gulf of Mexico.
Pre-monsoon surge events are a combination of the High Plains surge with additional moistening from the Gulf of
California. Moistening, within the atmospheric profile, occurs from the boundary layer upward.
Reference
For more background on High Plains moisture surges see:
Monthly Weather Review, 1995: The structure and evolution of cold surges east of the Rocky Mountains. Vol.
123, pp. 2577-2610.
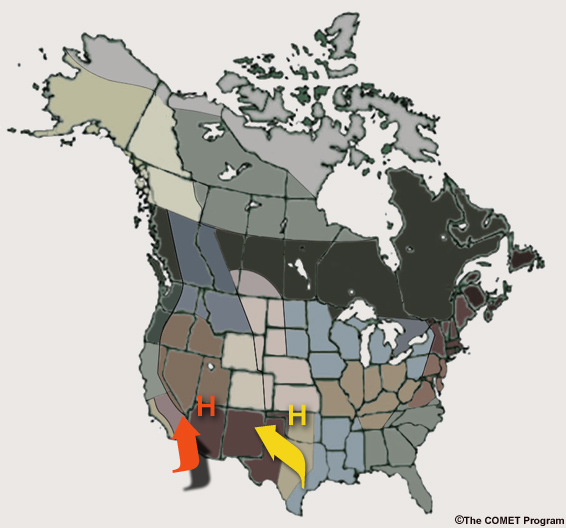
High Plains Moisture Surges
Increased fire danger from this pattern typically occurs in the southwest, but can also occur occasionally in
the Northern Rockies.
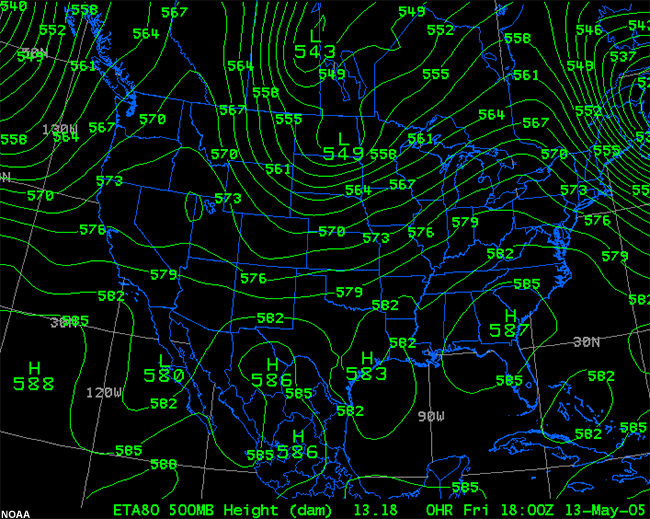
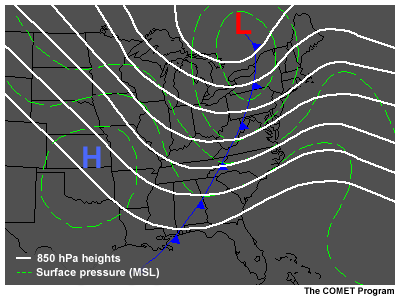
This plot shows a shortwave at 500 hPa moving southeastward into the Great Plains, during the
early stages of this pattern. Accompanying this wave is a cold front diving southward along the east slope of
the Rocky Mountains. This front will travel all the way through the eastern New Mexico/western Texas region,
setting the stage for subsequent return, or easterly, flow and moisture.
Stages of Development
- First, a cold front attached to an eastward translating shortwave or upper-level trough pushes southward
along the Front Range of the Rocky Mountains (see wind chart 1 below). Higher surface dewpoints advected by
northeast to easterly flow follow the front. Moisture subsequently drives westward, penetrating the gaps found
along the Front Range. This general advection pattern is often complicated by storm-scale convective
outflows in the late spring and summer months.
- Next, low-level moisture advection or “return flow” from the Gulf of Mexico reinforces the
initial instability, creating a significant moisture convergence boundary (see wind chart 2). Numerous
lightning strikes eventually develop along this boundary.
- Finally, a dry cold front and upper-level trough from the northwest push the moisture convergence boundary
eastward again. Gusty southwesterly winds behind the dry cold front bring clearing from west to east. The
winds and lower surface humidity levels cause previously ignited lightning fires to flare up.
This plot shows the boundary layer winds during the various stages of the high plains surges
process: (1) postfrontal upslope, or easterly flow, (2) return flow from the southeast, and (3) dry intrusion
after the return flow subsides. Approximate moisture convergence boundaries are indicated in orange.
Identifying the Pattern
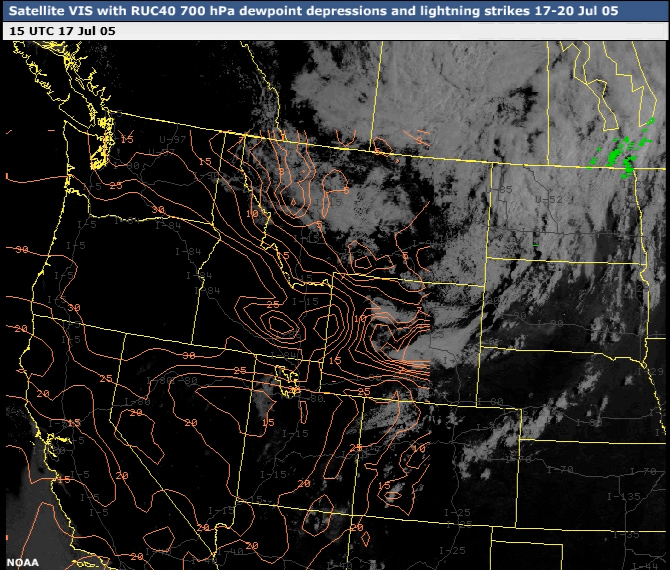
Tracking low-level moisture advection is key to identifying this pattern. An example of such advection is shown
in the following loop of surface observations. Moistening occurs from the surface upward, enhanced by daytime
mixing.
METARs from 13-15 April 2005. Several important features are highlighted. Note the position of
the back-door cold front at 21 UTC on the 13th. This push is further indicated by the easterly-component gap
winds at Taos (SKX), Albuquerque (ABQ), and Alamogordo (ALM) 09 UTC on the 14th. Finally, notice the moisture
convergence boundary draped across western New Mexico by the 15th of May. Such boundaries are important focus
points for thunderstorm formation.
Also, monitoring the steering flow for thunderstorms can help you anticipate the direction of thunderstorm
complex outflow propagation. Some storm outflows act to enhance the overall moisture advection pattern.
Pay close attention to thunderstorms found along the primary moisture convergence boundary. Drier storms are
found along the western edge. The High Plains moisture surge sequence sometimes precedes a breakdown of the
upper-ridge pattern, creating an extremely potent fire danger situation.
Pre-monsoon Moisture Surges
The pre-monsoon surge pattern occurs during a period when there is sufficient moistening to produce
thunderstorms, but lesser amounts of precipitation are generated. Most common from June into early July, the
pre-monsoon pattern can develop relatively quickly with a zonal jet stream oriented over the northern tier of
the western US.
Stages of Development
- First, the subtropical ridge progresses northward during late spring or early summer as meridional flow
aloft increases over and west of the ridge axis. An example of this type of progression is illustrated by the
following loop.
- Moisture associated with thunderstorm complexes in the Gulf of California or Gulf of Mexico advects
northward with the ridge. Moisture spreads downward from the middle and upper levels of the troposphere.
- Mid-level moisture is eventually advected northward under this ridge, overspreading much drier surface
conditions. In initial stages, storms are dry.
- Large thunderstorm complexes driven by significant pooling of Gulf of California and Gulf of Mexico moisture
develop over Mexico. These complexes propagate gradually northward over time. Drier storms are typically found
along the periphery of this moisture surge.
-
As time progresses, deeper moisture is transported northward, increasing thunderstorm coverage and moisture
content.
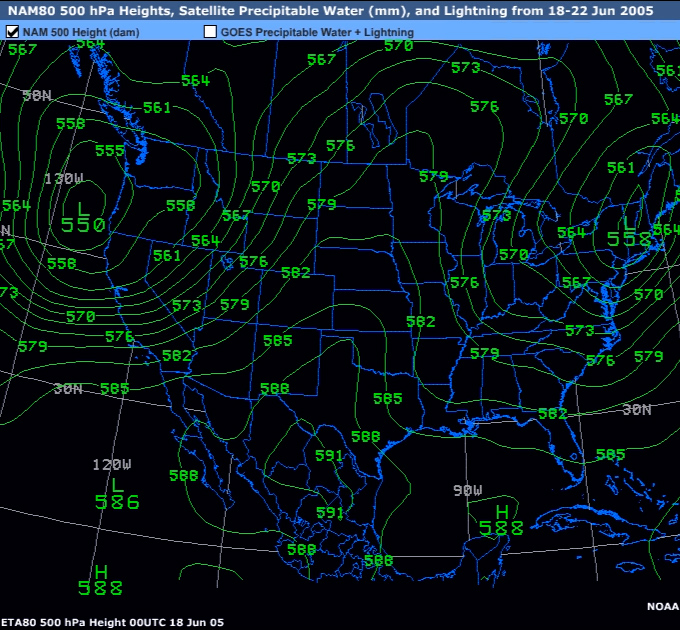
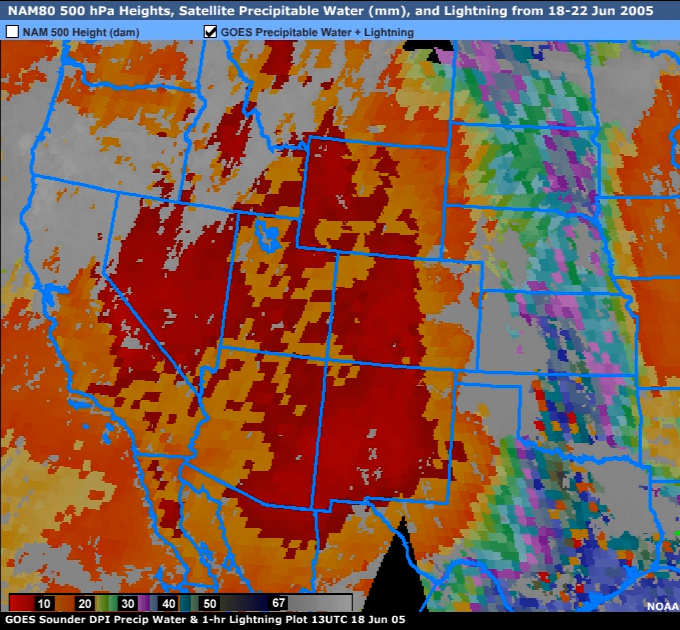
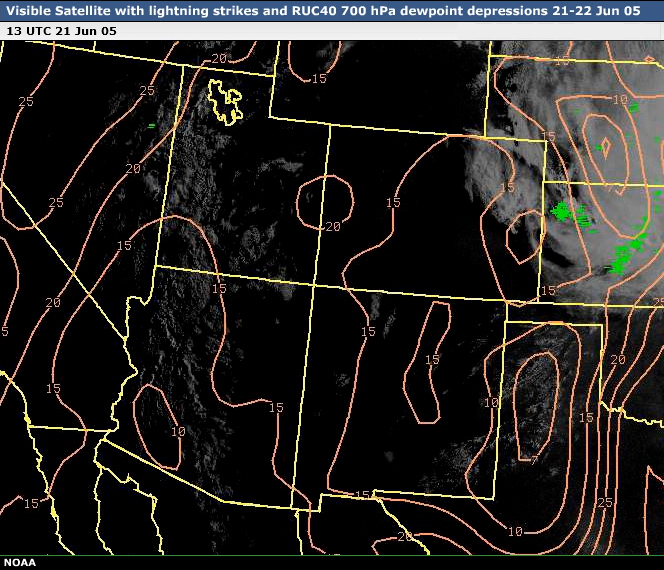
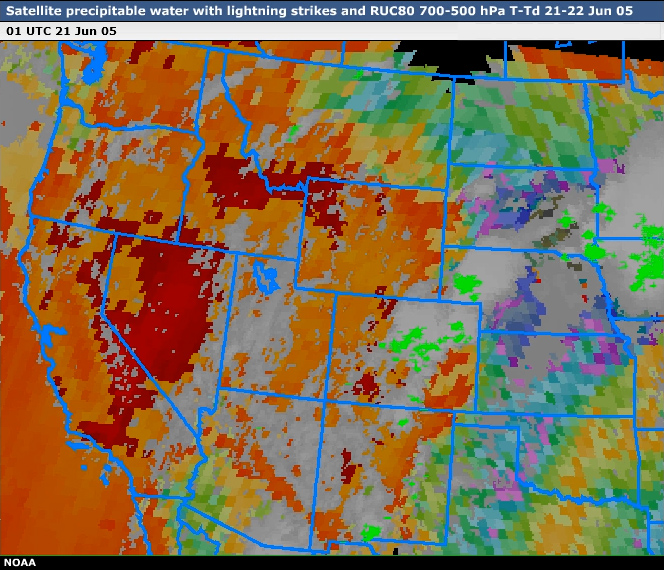
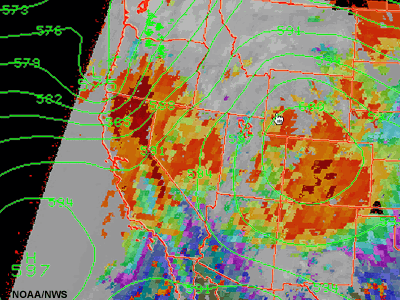
These development stages are illustrated by the following loops of 500 hPa heights and satellite precipitable
water. Note the lightning patterns along the edges of the moisture plume between 20 UTC on 21 June and 02 UTC on
22 June.
Combined/Simultaneous Pattern
Both moisture surge patterns often occur simultaneously. Low-level moisture from the High Plains surge advects
westward across New Mexico into Arizona, while mid- and upper-level moisture initially associated with the
building ridge progresses northward. The combined effect can go on for several days and results in intensified
lightning activity in areas that are dry and prone to fire starts.
Given the right setup, moisture surges can advect over dry areas from both the Gulf of Mexico
and the Gulf of California.
The moisture surges abate as drying behind an eastward-propagating upper wave quickly scours the moisture out
of the southwest and winds strengthen. Pre-existing fires may grow rapidly in this stage.
An example of a drying trend across western New Mexico. Flat cumulus dissipate to the West of
Albuquerque, New Mexico.
Note: The location of the subtropical high governs which moisture surge pattern dominates. In a typical year,
the High Plains surge sets up the pre-monsoon pattern.
Fire Cessation
As atmospheric moisture from the pre-monsoon and high plains surge patterns deepens toward the north, storms
become wetter and precipitable water increases. Unless the pattern is interrupted by a long duration drying
event, a positive feedback response will develop between the fuels and weather.
Increases in daytime and overnight humidity combined with increasing wetting rain coverage moisten the litter
and duff layers. Fire starts from lightning gradually diminish as does fire spread. Moisture levels also
increase within the ladder and canopy fuels, reducing fire intensity. Moistening takes longer in timbered areas
than those where fine fuels are predominant. Some perennial grasses may also green up. This generally occurs
over a period of several weeks across southern California, the Southwest, the southern Rockies, and portions of
the Great Basin.
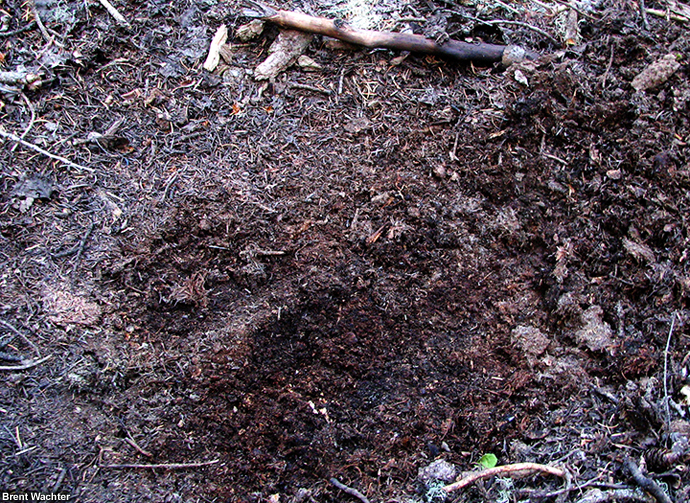
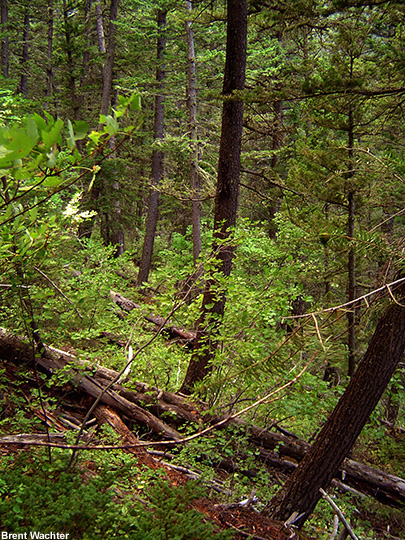
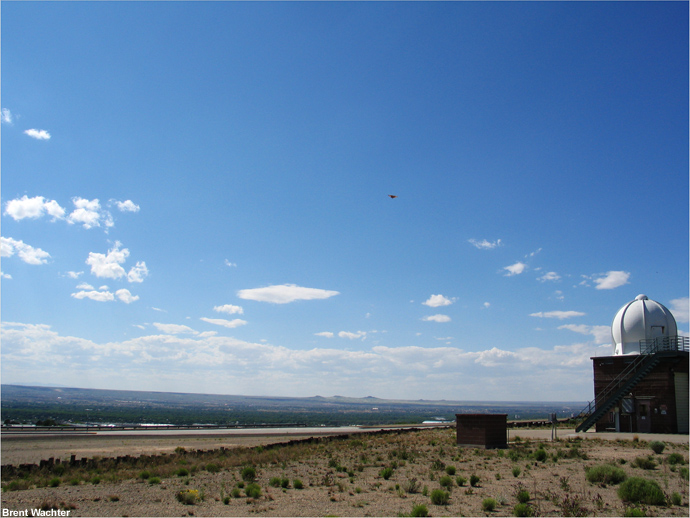
As the moisture surges become progressively wetter, duff layers like this one become
saturated, reducing the likelihood of fire starts. This photo was taken in New Mexico's Sandia Mountains at an
elevation of 10,300 ft on 25 June 2007.
High Plains Surge: 13-17 May 2005
Set-up
This short case study represents an example of a High Plains moisture surge event that generated significant
number of lightning strikes.
Examine the data products in the box below (check images to see the data products), then answer the
question that follows.
Question
Which of the following describes current conditions? (Choose all that apply then click Done.)
Evolution
How did this event unfold? Examine the products in the data viewer (check images to see the data
products) to determine the sequence of the following events. Then complete the exercise that follows.
Question
What was the sequence of events? (Decide the order for each event, then click Done.)
Answer
As the 500 hPa trough progressed southeastward from the northern plains, a cold front pushed southward
along the Front Range, extending all the way into New Mexico. Northerly to northeasterly winds developed
over the eastern plains of New Mexico and increased boundary layer moisture later on 13 May. Surface
moisture was sufficiently deep to pass through gaps along the front range during the overnight period of
13-14 May, extending as far west as Arizona.
Return flow from the Gulf of Mexico, aided by convective outflows from eastern New Mexico, brought
additional moisture into New Mexico on 14-15 May. A moisture convergence boundary developed, with wetter
storms found to the east of this boundary and drier storms to the west. This boundary shifted eastward
during the daytime period and westward during the overnight periods.
On 16 May, a wave moved in from the west, bringing drier and windier conditions to the region. The moisture
convergence boundary translated further east across New Mexico and lightning was not observed as the upper
levels were too dry. This type of clear-out can cause rapid spread of both pre-existing and newly ignited
fires.
Fire Weather
What were the key fire weather elements?
Examine the data products in the box below (check images to see the data products), then answer the
question that follows.
Question
Which of the following statements accurately identify the key fire weather elements and transitions in this
case study? (Choose all that apply then click Done.)
Outcome
Although no large fires were started by this lightning outbreak, it was the type of event that can generate
numerous small fire starts.
Key Points
When tracking this type of event look for the following features and signatures:
Set-up
Pre-existing dry conditions and low fuel moistures in the threat region.
'Back-door Front'
A transition from moist north to northeast flow down the Front Range to an easterly flow of moist air
originating from the southern Plains. The depth of the moisture surge associated with this flow needs to extend
from the surface up to around 700 hPa. Deep outflows originating from thunderstorm complexes can aid low-level
moistening from east to west.
Return Flow
Easterly or southeasterly “return flow” of moist air from Southern Plains and Gulf of Mexico. Deep
thunderstorm complex outflows can aid low-level moistening from southeast to northwest.
Moisture Convergence Boundary
A moisture convergence boundary typically develops within the low- to mid-levels of the atmosphere. Drier
storms are found to the west of this zone; wetter storms are found to the east.
Clear-out
Then look for the mix out as drier southwesterly winds prevail.
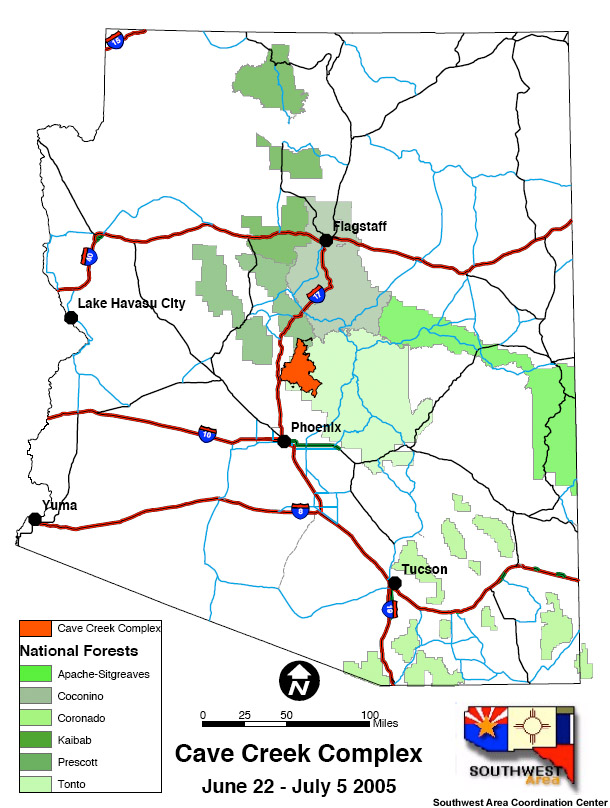
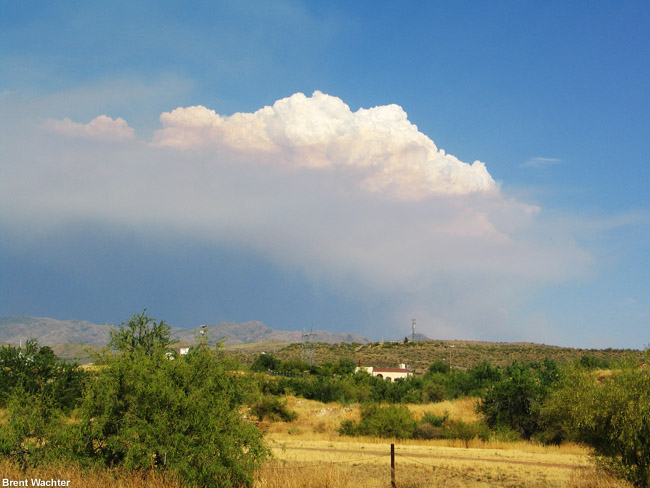
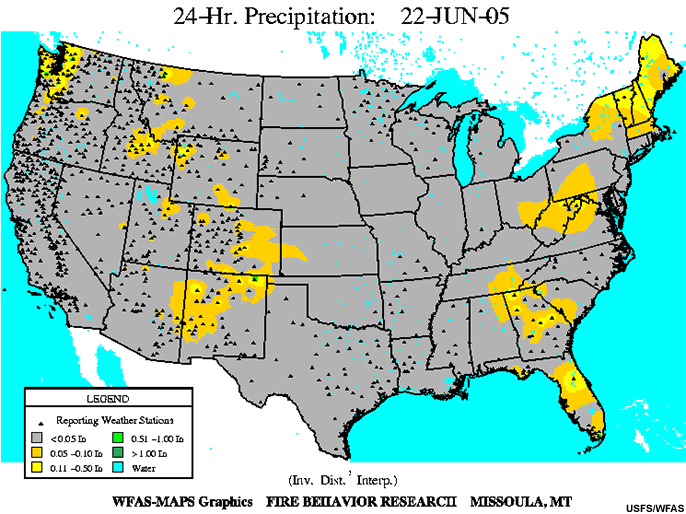
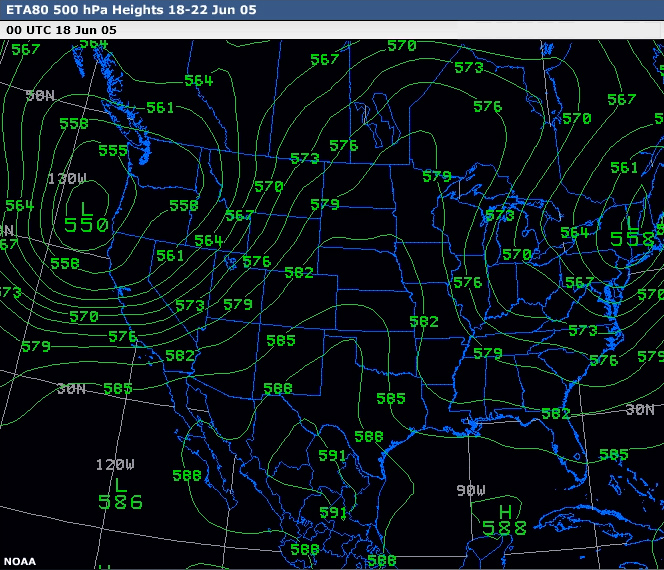
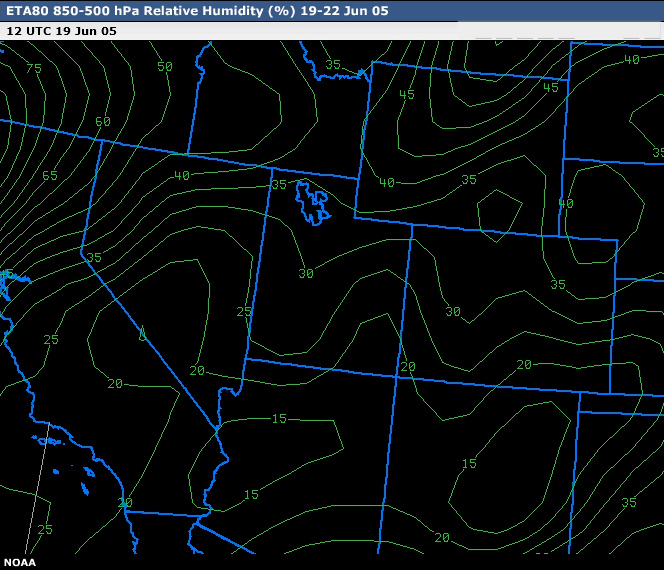
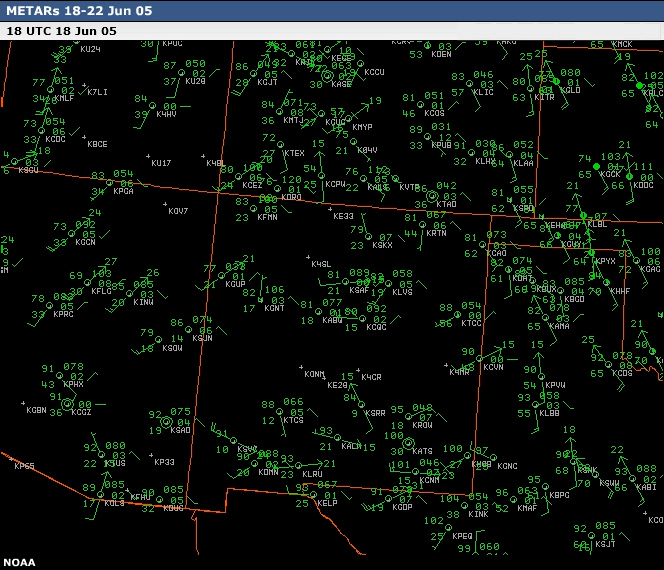
Pre-monsoon Surge: 18-21 June 2005
Set-up
This short case study represents an example of a pre-monsoon moisture surge event over the Southwest and Great
Basin.
Examine the data products in the box below (check images to see the data products), then answer the
question that follows.
Question
Which of the following describe the situation on 18 June 2005?(Choose all that apply then click
Done.)
Evolution
How did this event unfold? Examine the products in the data viewer (check images to see the data
products) to determine the sequence of the following events. Then complete the exercise that follows.
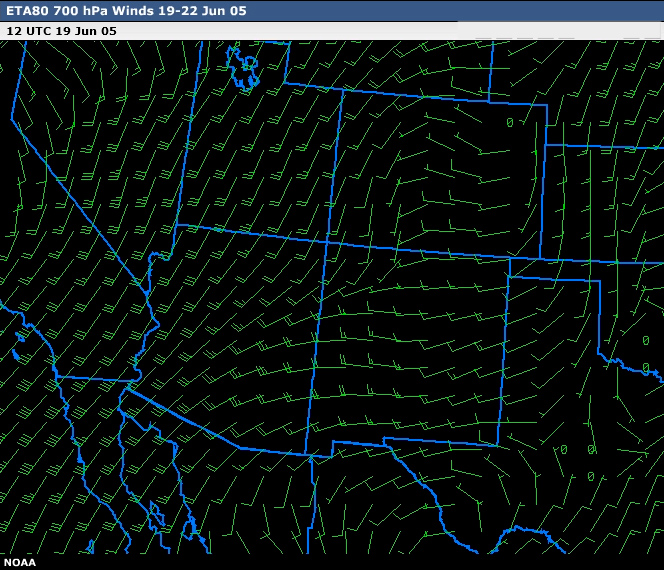
Question
What was the sequence of events? (Decide the order for each event, then click Done.)
Answer
This pre-monsoon pattern example shows the importance of the location of the high in focusing moisture
advection. In addition, the surface level wind flow acts to dry the low levels and decrease the amount of
precipitation reaching the surface.
The moistening of storms was also supported by outflows from large thunderstorm complexes to the south and
east in Mexico, eastern New Mexico, and eventually Arizona and western New Mexico.
Notice developing persistent southeasterly flow within Southwest METAR loop. Dewpoints jump into the mid
40s across portions of western New Mexico.
Notice, within the METAR loop, southerly to southeasterly surface flow developing during the nightime
hours. This flow turns more southwesterly during the daytime hours due to mixing of winds aloft. A battle
zone sets up as Gulf moisture is advected around the subtropical high over Arizona. Southwest flow pinches
off the surface moisture advection. However, mid-level moisture advection continues to push westward and
northward around the subtropical high, eventually creating a moisture layer sufficiently deep to produce
higher based thunderstorms. Initially, the thunderstorms are fairly dry. But, they become wetter in places,
depending on the mid-level moisture flow around the upper high. The storm moistening process was also
dependent on outflows from large thunderstorm complexes to the south and east (in Mexico/eastern New Mexico
and eventually Arizona/western New Mexico). Toward the end of the METAR loop, the pinch off of surface
moisture pushed more northward across southern portions of Great Basin.
Fire Weather
What were the key fire weather elements?
Examine the data products in the box below (check images to see the data products), then answer the
question that follows.
Question
Which of the following statements accurately identify the key fire weather elements and transitions in this
case study? (Choose all that apply then click Done.)
Outcome
Extensive areas of dry lightning developed across the southwest. The SWCC morning intelligence briefing listed
forty-seven new fires reported for 21 June. Some of intelligence briefing locations are indicated on the
lightning strike chart.
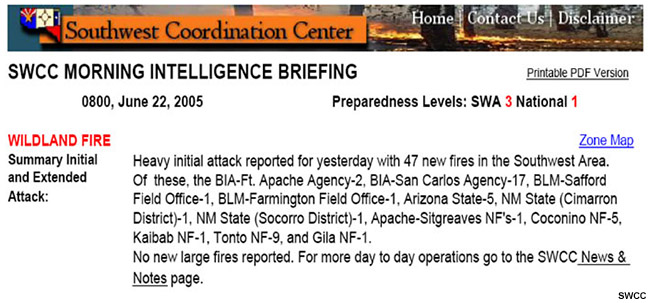
Morning briefing from the Southwest Coordination Center for 22 Jun 2005.
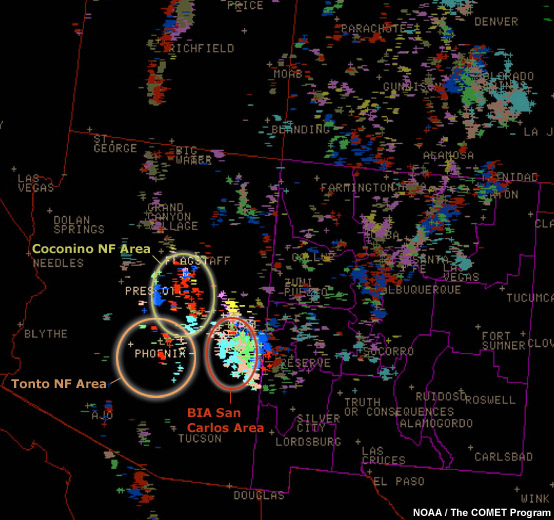
Lightning map with Coconino National Forest, Tonto National Forest, and BIA San Carlos
highlighted.
Key Points
When tracking this type of event look for the following features and signatures:
Set-up
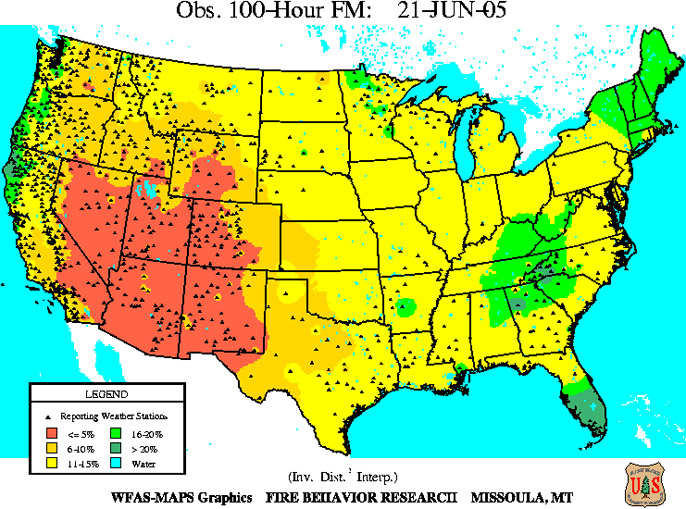
- Subtropical ridge with meridional upper-level flow
- Low 100-hr fuel moistures (increases ignition efficiency)
Moistening
- Advection northward of 700-400 hPa moisture from source regions such as the Gulf of Mexico and Gulf of
California
- Circulation of this moisture around the high
- Significant dry layer below cloud base
- Eventual low-level moistening from rainfall, thunderstorm outflows, and plains surges
Position of Upper High
- Governs which areas receive both a broad and deep moisture surge
You have completed this section on Moisture Surge patterns.
Hybrid
Breakdown with a Twist
This pattern is a variant of the Breakdown of the Upper Ridge and an extension of the
Pre-monsoon Moisture Surge critical fire weather patterns.
Introduction
The hybrid pattern is the interaction between the breakdown of the upper ridge and a significant moisture
surge. This pattern typically affects the inter-mountain West from July through early September. A variant of
this pattern also affects the interior of Alaska.
The catalyst for the upper ridge breakdown is a Pacific cold front/shortwave steered by the mid-latitude jet.
There are two main initial breakdown mechanisms to this pattern:
- The synoptic-scale wave originating from the Pacific translates eastward or northeastward along the
periphery of the ridge
- Weaker vorticity maxima move through the base of the parent Pacific trough and translate eastward or
northeastward along the periphery of the ridge.
The strength of both the upper ridge and the parent Pacific trough shape the overall breakdown processes of
these events.
Examples of three different prototypical 500 hPa height configurations associated with the
hybrid critical fire weather pattern over the Pacific Northwest.

Regional distributions of the hybrid pattern, shown in red.
Typical timescales for this pattern range from 1 to 3 days, depending on the strength of the Pacific trough and
upper ridge.
The critical ingredients are:
- The shortwave from the Pacific
- The moisture plume (wrapped around the subtropical high over the continental interior). This is an extension
of the pre-monsoon moisture surge pattern.
The key area to focus on is the transitional zone, defined as the drier area (mid level dry slot) between the
plume axis and the area of highest cyclonic vorticity.
Weather indicators associated with this feature include:
- Low relative humidity
- Warm temperatures
- Gusty daytime winds
- Instability
Dry lightning often occurs along the edges of this transitional zone and even sometimes within it.
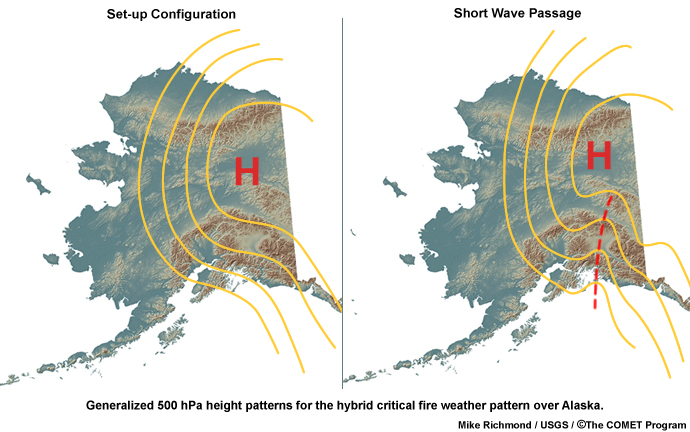
Alaska Variant
A variant of the hybrid critical fire weather pattern occurs in Alaska. During the set-up phase, an upper-level
ridge builds from western Canada into the Alaskan interior. Hot dry weather beneath the upper ridge can allow
fuel moisture levels to become very low.
Subsequently, a westward moving short wave (easterly wave) advects moisture and instability into the Alaska
interior. These easterly waves typically result from mature occluded frontal systems sweeping northwestward from
the Gulf of Alaska.
Either dry or wet thunderstorms can result, depending on atmospheric moisture, potency of the shortwave, and
thunderstorm steering flow. Prolific lightning can be generated. There are typically several days every summer
with more than 8000 lightning strikes. On July 4 2007, 12,388 strikes were detected.
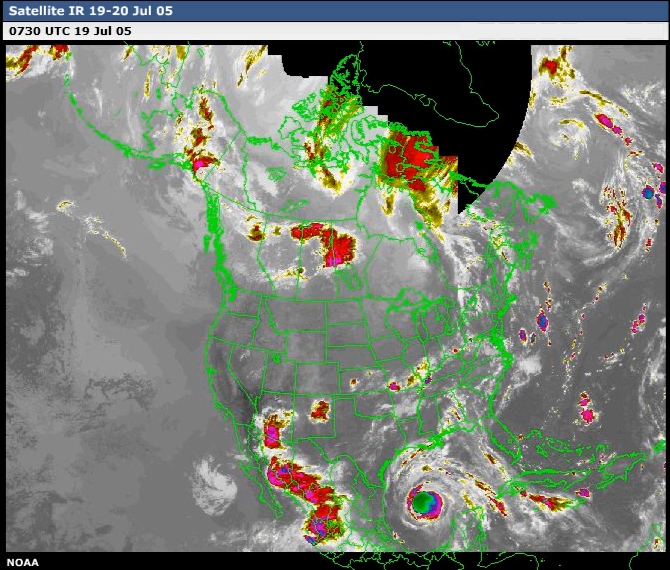
Example Case: 21-24 Jul 2005
Set-up
Examine the data products in the box below, and familiarize yourself with the initial set-up for this case
study.
Upper-level Configuration
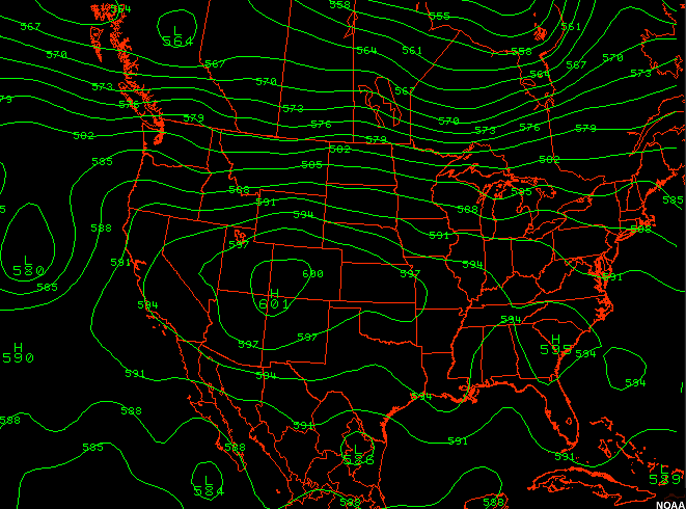
An upper-level ridge was in place across a broad section of the western U.S., with a subtropical high centered
over the Four Corners region. Also, as is typical for this time of year, a loosely defined trough was positioned
off the West Coast.
Pre-conditioning Environment
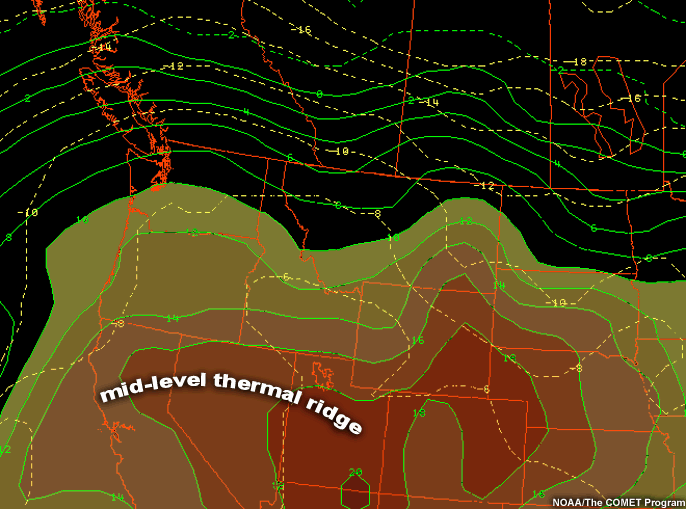
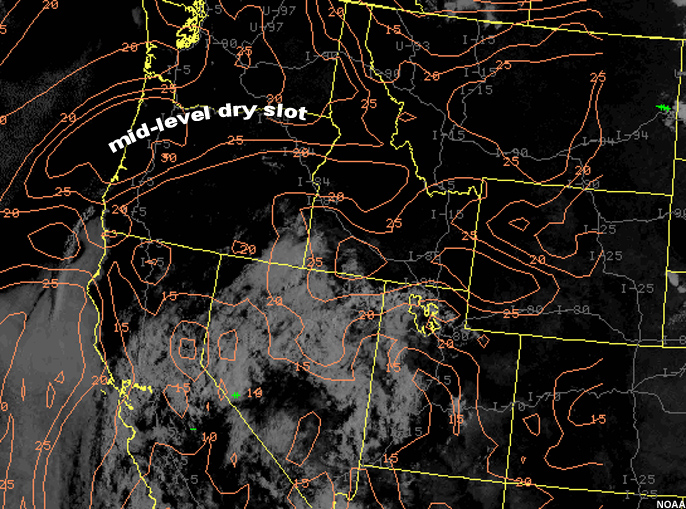
Before the event, the strong ridge and subtropical high supported near-record high temperatures during a
prolonged dry spell. Drying was enhanced by the combination of a thermal ridge and dry slot at mid-levels over
portions of the Great Basin, California, Pacific Northwest and Rockies.
This pattern caused rapid drying of surface fuels throughout a large portion of the Great Basin, Pacific
Northwest and Rockies. With drying, the fuels became more susceptible to lightning ignition and rapid fire
spread.
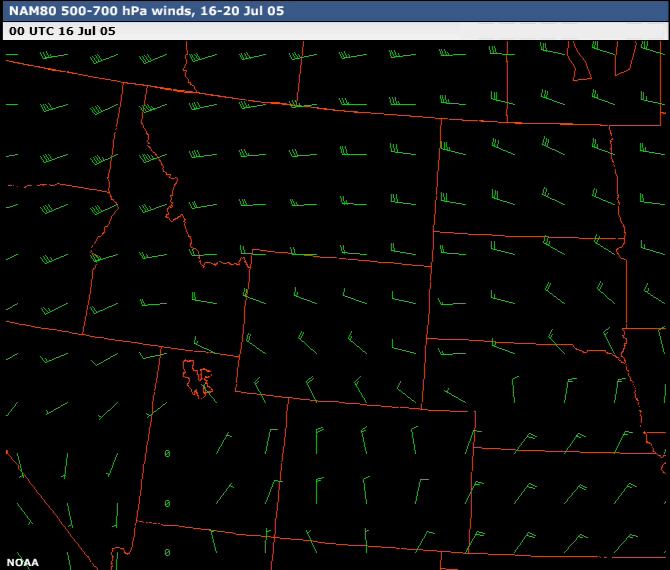
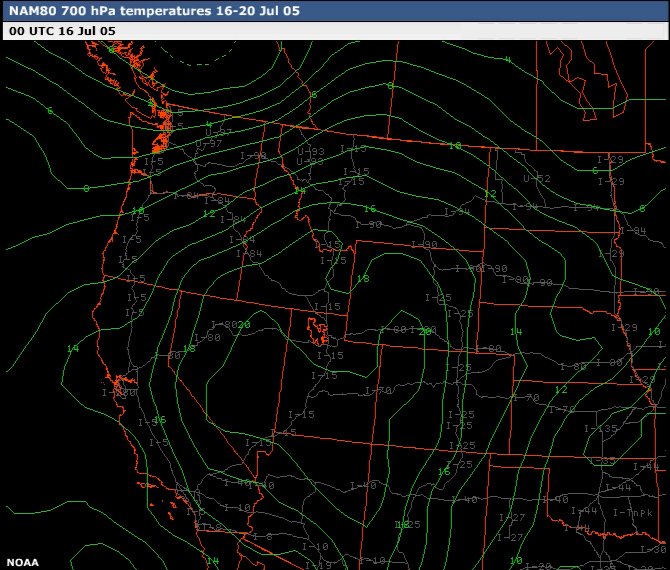
Evolution
This case involved a complex set of interactions between the upper-level ridge, the loosely defined trough off
the West Coast, and associated moisture fetches that advected from both Pacific and southwest monsoon sources.
Examine the data products below (check images to see the data products), and try to find each of the
key features and interactions described below.
Key Stages and Interactions
Initial Stage
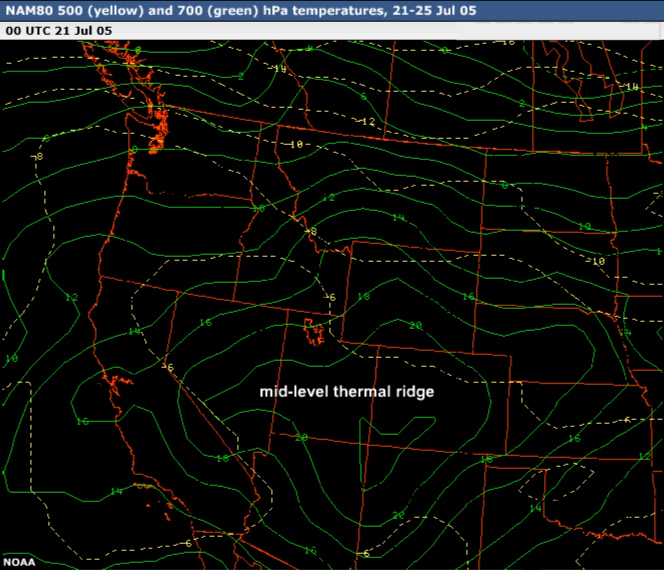
Subtropical High - Thermal Ridge/Dry Slot - Monsoonal Moisture Interactions
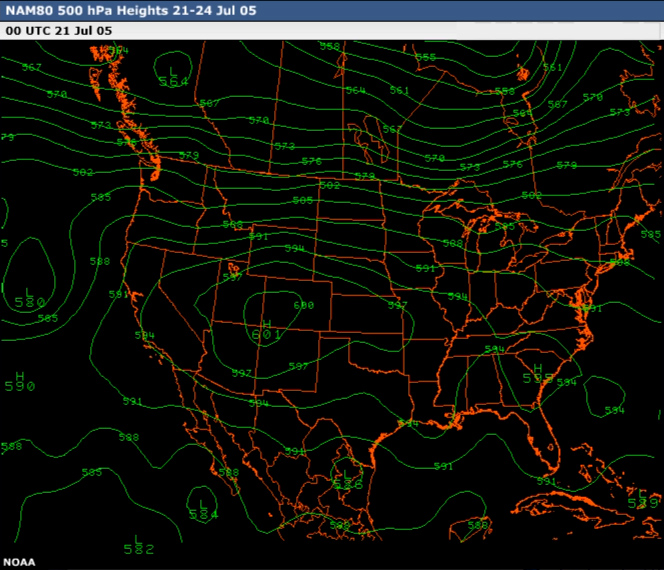
- A subtropical high developed and remained entrenched over the Four-Corners region and portions of the
Rockies on the 20-21 July. Monsoonal moisture, steered by the subtropical high, flowed northward and spread
across a large portion of the Great Basin, including the Sierra mountains of California.
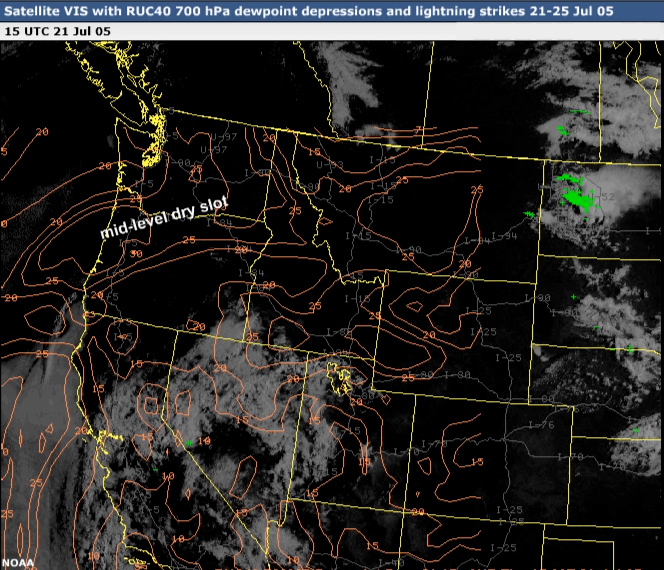
- A mid-level dry slot was evident on the northern extension of the upper-level ridge, generally affecting
northern portions of the Great Basin, California, Pacific Northwest and Rockies. Warm temperatures, low
humidity levels, and some breeziness occurred beneath this mid-level dry slot. Such dry slots are usually
coincident with a stronger mid-level wind gradient found along the edge of the mid-level thermal ridge. Haines
Index values of 5 to 6 can be typically found within this same general area.
- Fueled by convectively induced waves, unstable air, and abundant moisture, wet thunderstorms affected
southern portions of the Great Basin and Sierra mountains. Convective storms were drier in peripheral areas
along the western and northern boundaries of the moisture push.
Pacific Trough - Upper Ridge Interactions
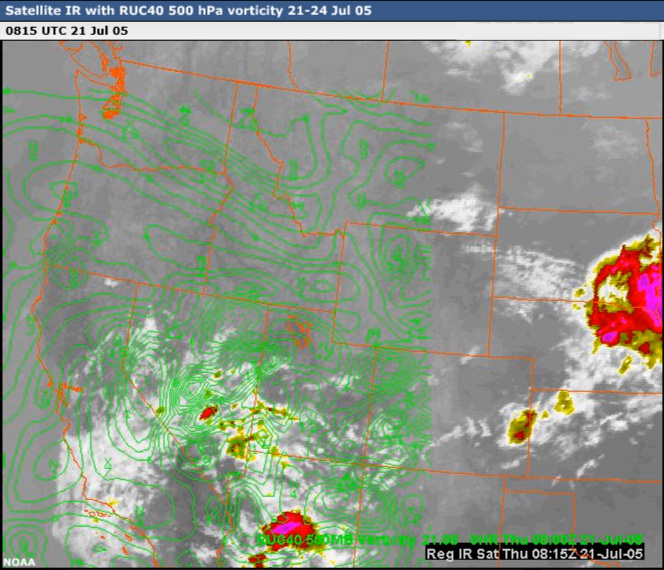
- The breakdown began across the Pacific Northwest later on 21 July, continuing into 22 July as the synoptic
wave translated eastward and northeastward along the periphery of the upper ridge.
- A stronger mid-level wind gradient was found between the wave and the upper ridge over portions of
California, the Pacific Northwest, and the northern Rockies on 20-21 July.
- Mid-level dry slots existed:
- Between the wave and the monsoonal moisture moving northward under the ridge (this was the primary dry
slot)
- South and west of the synoptic wave as it pushed inland across the Pacific Northwest on 22 July.
Breakdown Stage
- The synoptic wave continued its translation northeastward across portions of the Pacific Northwest and
northern Rockies on 22-23 July. This flattened the ridge and re-positioned the subtropical high further east
over portions of the central Plains and mid-Mississippi valley.
- A strong mid-level cold front strengthened surface winds across portions of the Pacific Northwest, Great
Basin, Rockies and northern California during this same period. (This front can be inferred from the tighter
packing of isotherms in those regions at 700 and 500 hPa.)
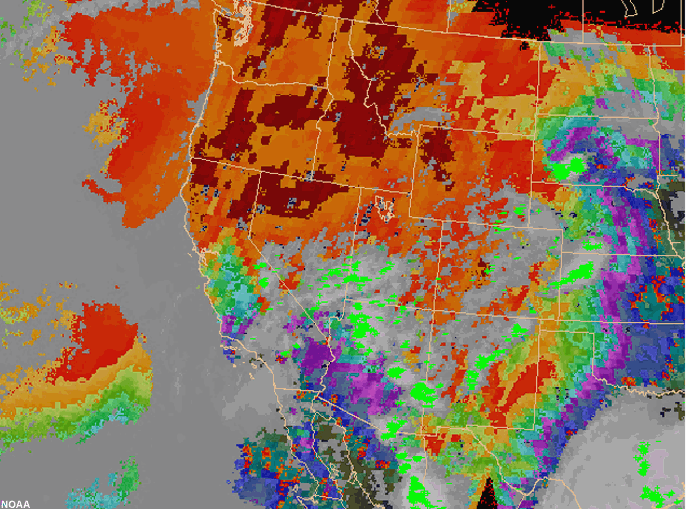
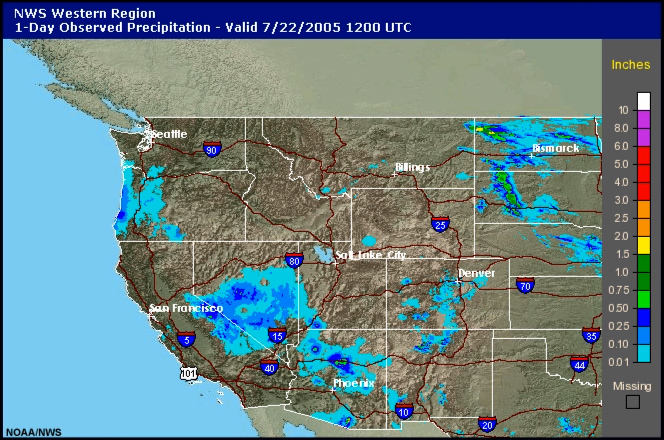
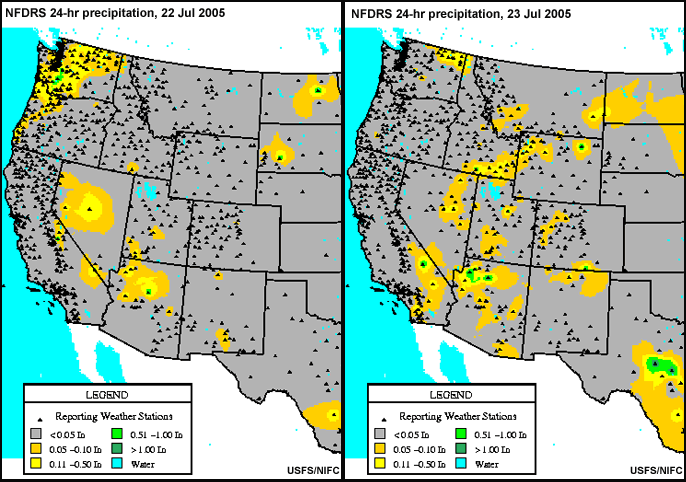
- Thunderstorms (indicated by the hourly lightning data) associated with the synoptic wave translation
affected portions of the Pacific Northwest during the evening of the 21 July and much of 22 July. Storms were
drier along the periphery of this lightning area, as indicated by the observed precipitation graphics.
- Drier storms also developed along the western and northern boundaries of the monsoonal moisture plume,
generally affecting portions of the Great Basin and Rockies.
- The amount of precipitation that fell on a given location was minimized by the speed with which these
convective storms propagated, driven by the strong mid-level wind gradient and cold front. Thus, fires were
likely started even in areas beneath the wetter convection.
- Fire spread after ignition was aided by:
- Gusty surface winds
- Clearing in the wake of individual storms
- Vertical mixing of lower humidity air from the mid-level dry slot down to the surface
- Idaho and western Montana were the main focus areas for lightning ignition and subsequent fire spread on 22
July
After the Breakdown
- Clear skies and low humidity prevailed across portions of California, the Pacific Northwest, the Great
Basin, and the Northern Rockies on 23-24 July, as the mid-level dry slot became fully entrenched over the
region. Look for this in the IR and visible satellite loops.
- Breezy conditions were also supported on these days by the stronger mid-level wind gradient over the Pacific
Northwest, Northern Rockies, and portions of the Great Basin. You can infer this from the spacing of 700 and
500 hPa isotherms over these regions.
- The mid-level thermal ridge became re-established beneath the subtropical high as the upper level ridge
shifted back westward. Heightened Haines Index values coupled with warm surface temperatures affected portions
of California, the Great basin, the Rockies, and the Pacific Northwest on 24 July.
- Sleeper fire starts, ignited by lightning during the earlier stages of the event, began to flare up during
the days following the primary breakdown phase. Such sleeper fires are especially likely in areas with heavier
forest canopies.
Outcomes
During this event, several new large fire starts were reported across portions of the Pacific Northwest, Great
Basin and Rockies over a period of one to three days following the thunderstorm passage.
Fires that show up a few days after the storm event are referred to as sleeper lightning starts. The
time to detect these starts depends on weather conditions after the starts and how long it takes the smoke to be
seen by human eyes. Lightning ignitions are usually harder to detect in forested areas with closed canopies and
minimal human population. When dry air is advected behind a shortwave, these sleeper lightning starts become
particularly important.
The case shown here for Oregon, Idaho, and western Montana was not a massive lightning outbreak but did produce
some large fires. Coincidently, numerous pre-existing large fires were burning across the Southwest and far
southern portions of the Great Basin. Rain produced by this event helped ease fire concerns in parts of the
Southwest and southern Great Basin, but the lightning also created numerous new starts as well.
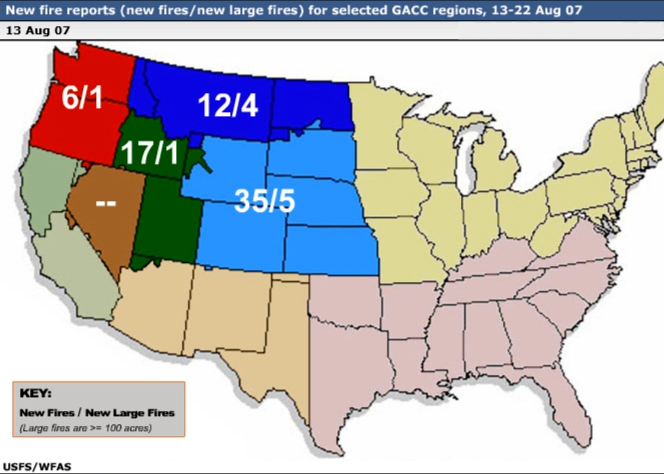
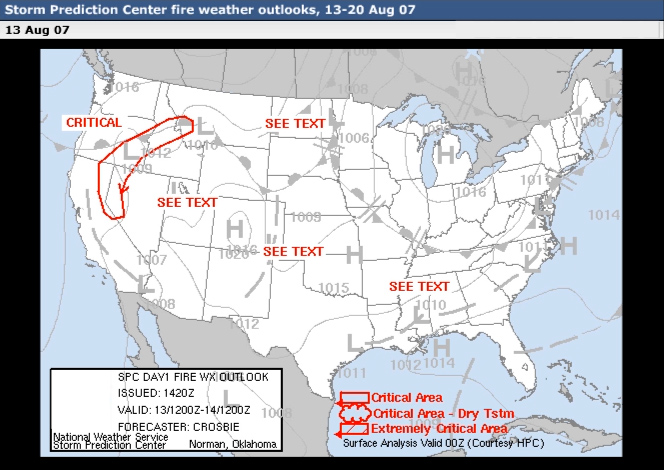
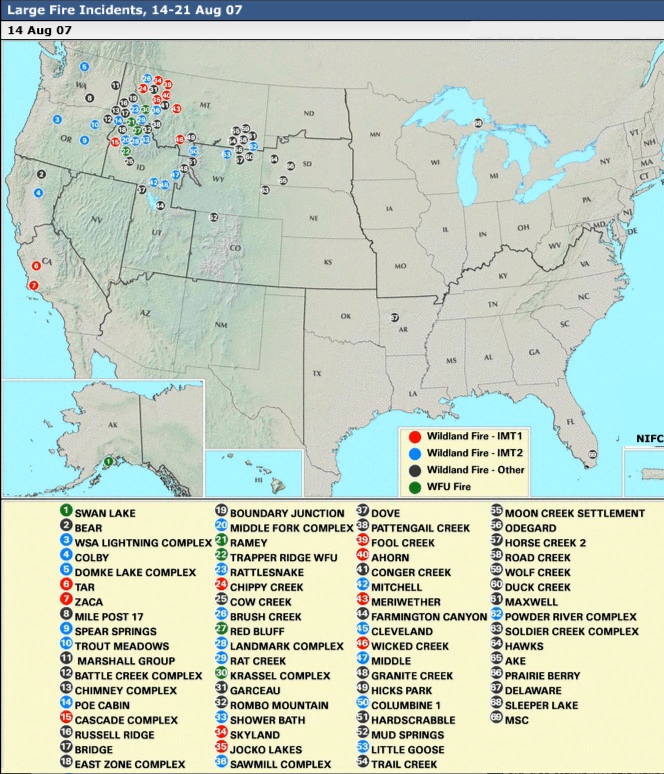
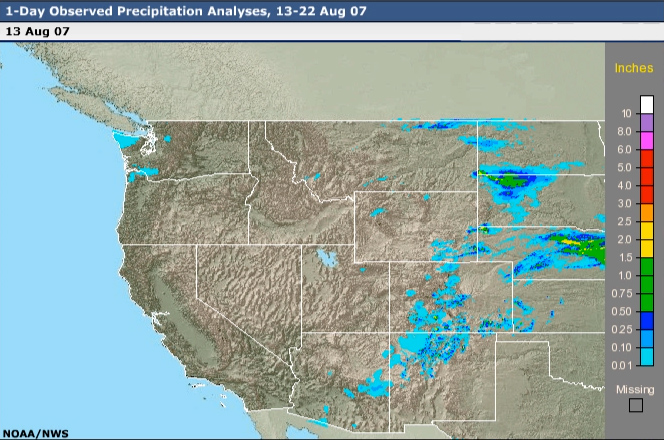
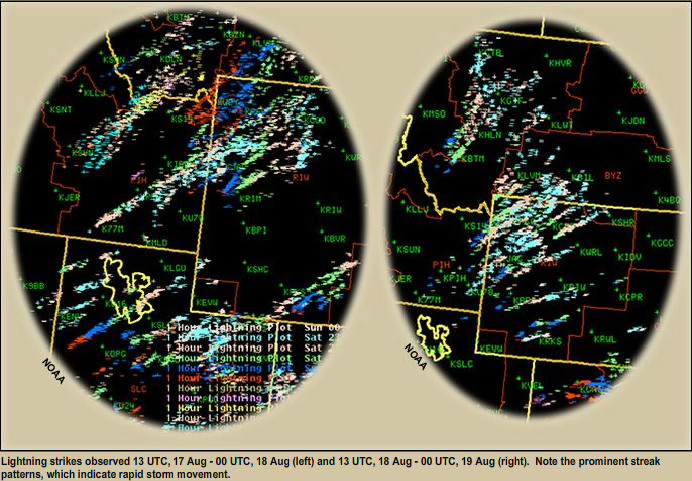
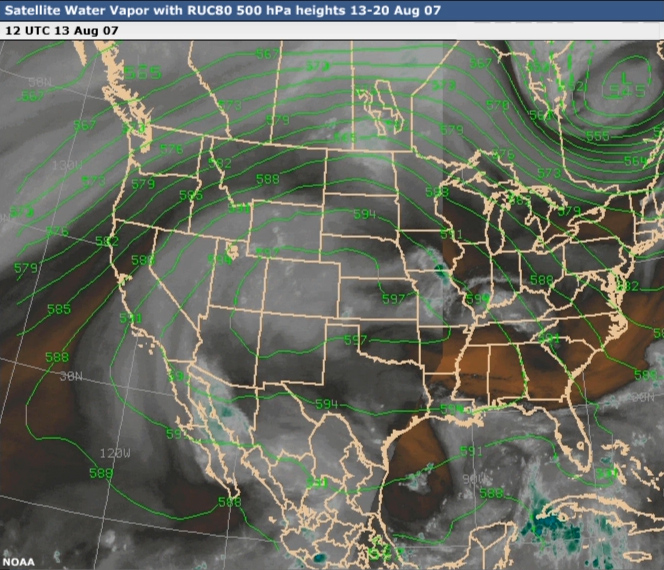
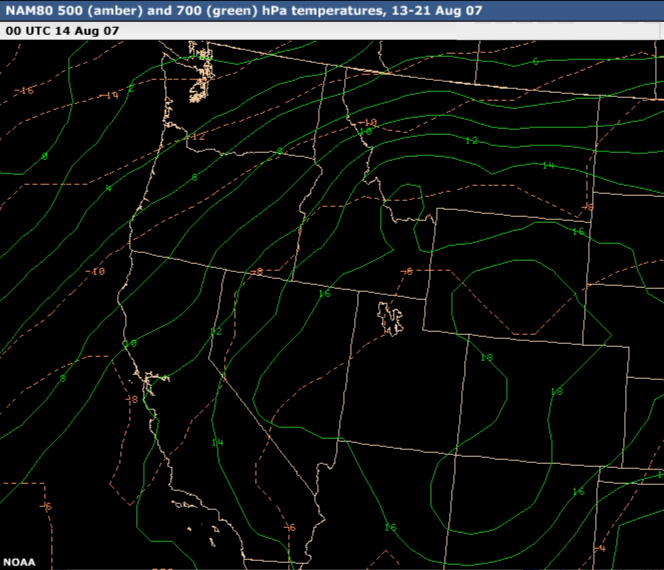
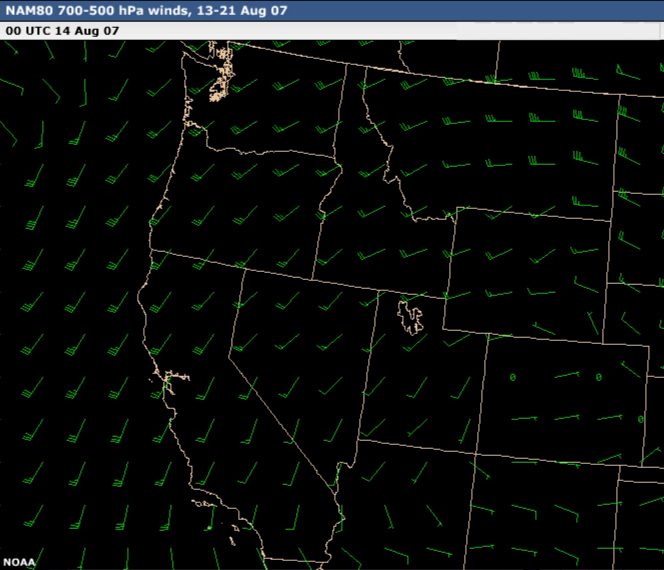
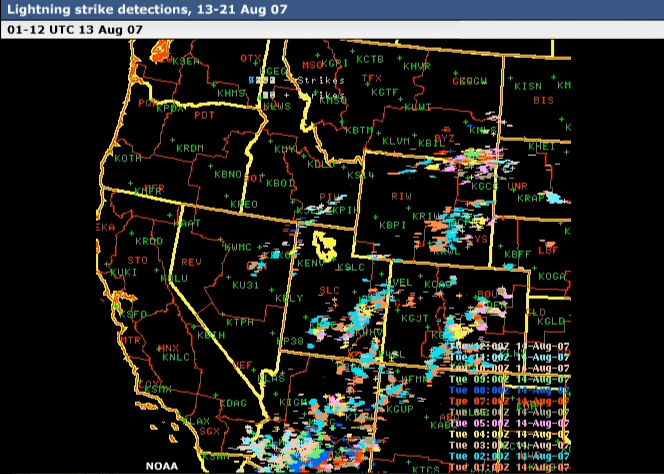
Practice Case: 13-20 Aug 2007
Set-up
This practice case study represents an example of an hybrid critical fire weather pattern over the western U.S.
in mid-August 2007.
Examine the data products in the box below (check images to see the data products), then answer the
question that follows.
Question
Which of the following describe the situation on 13 Augutst 2007?(Choose all that apply then click
Done.)
Evolution
How did this event unfold? Examine the data loops below (check images to see the data products). Then
complete the exercise that follows.
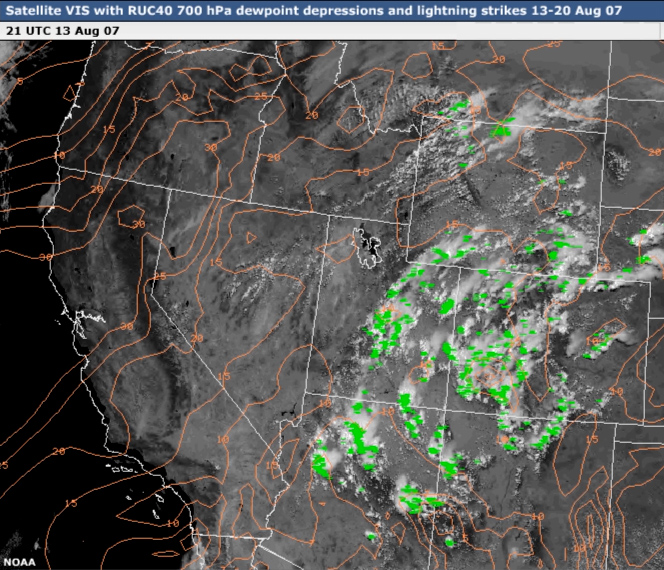
Question
What was the sequence of events? (Decide the order for each event, then click Done.)
Answer
Well done. You have correctly ordered the sequence of events.
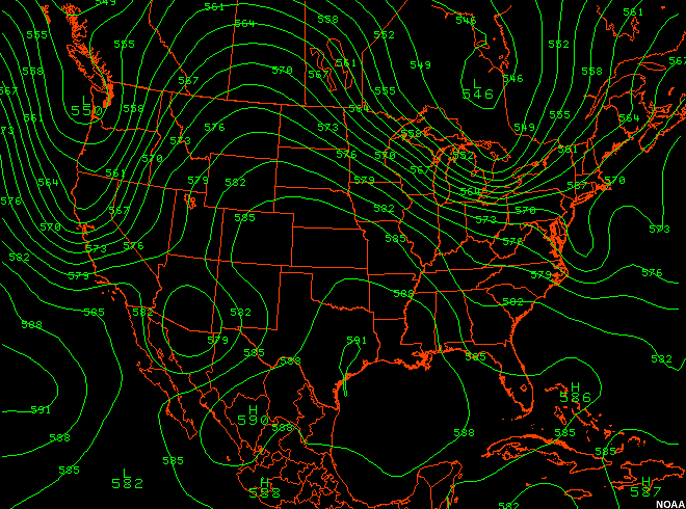
With a trough off the west coast and the subtropical high centered initially over the Four Corners region,
monsoonal moisture flowed northward and affected portions of the Great Basin and Rockies on 13-14 August. At
the same time, the interaction of the mid-level thermal ridge, dry slot and strong wind gradient continued
to dry the surface fuels north and west of this moisture fetch.
As the pattern evolved on 14-15 August, the Pacific trough edged closer to the coast while monsoonal
moisture progressed even further north.
The primary breakdown period initially started later on 15 August, continuing into 16 August, while
monsoonal moisture was transported as far north as western Montana.
As the breakdown progressed on 17-18 August, a vigorous cold front pushed inland across the Pacific
Northwest. The mid-level wind gradient strengthened and interacted with storms along the western and
northern periphery of the monsoonal moisture plume.
The Pacific trough received a reinforcing shot of cooler air from the north Pacific on 19-20 August and
completed the full breakdown of the upper ridge.
Fire Weather
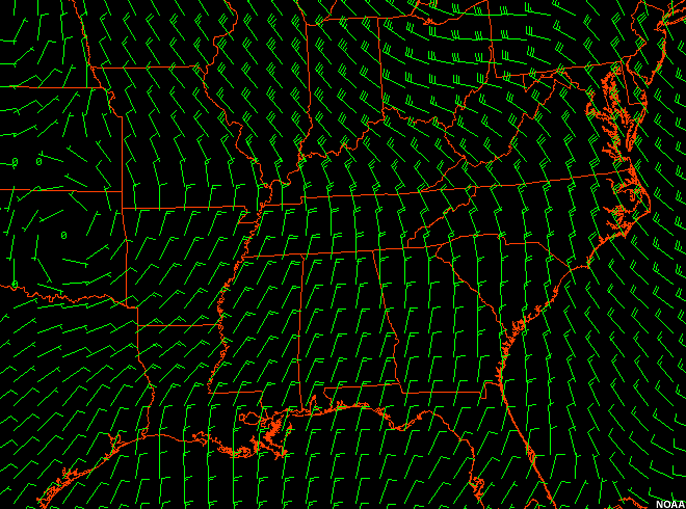
Take a second look at the data loops for this case (check images to see the data products), then try
to answer the questions that follow.
Question
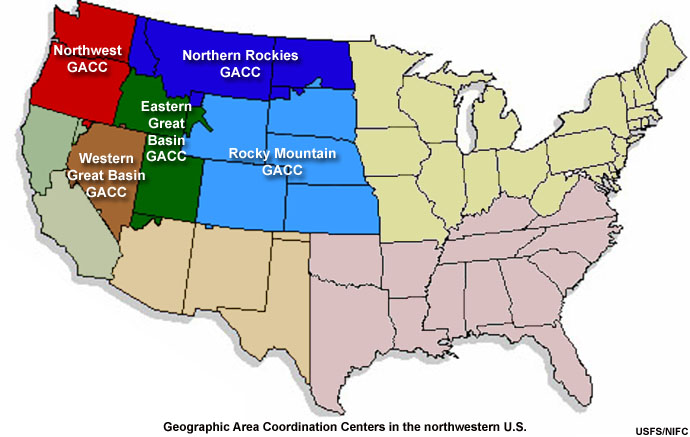
Referring to the map of highlighted Geographic Area Coordination Centers above, choose the best answers to
the questions below. Keep in mind, as you consider these questions, that many fire starts are not noticed or
reported until several days after ignition. (Choose an answer for each question, then click Done.)
Answer
As it turned out, the Eastern Great Basin GACC saw the most new fire reports with 268 new fires and 17 new
large fires over the 10-day period. The Western Great Basin GACC had the fewest new fire reports, with 55,
including 3 new large fires. The largest numbers of new fire reports were made on August 16 (127/5) and
August 17 (105/9).
The following charts show total numbers of new fires and new large fires reported each day during the
event. Keep in mind that fires reported by the individual Geographic Area Coordination Centers include both
lightning and human-caused fires, but considering the time of year and patterns of occurence, it is safe to
assume that most of the fires reported were ignited by lightning.
In forested areas with heavy canopies, such as are found across the northern Rockies, there is often a
significant time lag between the ignition and reporting. This makes it difficult to pinpoint the exact days
or critical weather events that produce fire starts in these regions. (More information about the fire
weather and outcomes is given on the next page.)
New reported fires for selected Geographic Area Coordination Centers in the northwestern
U.S.
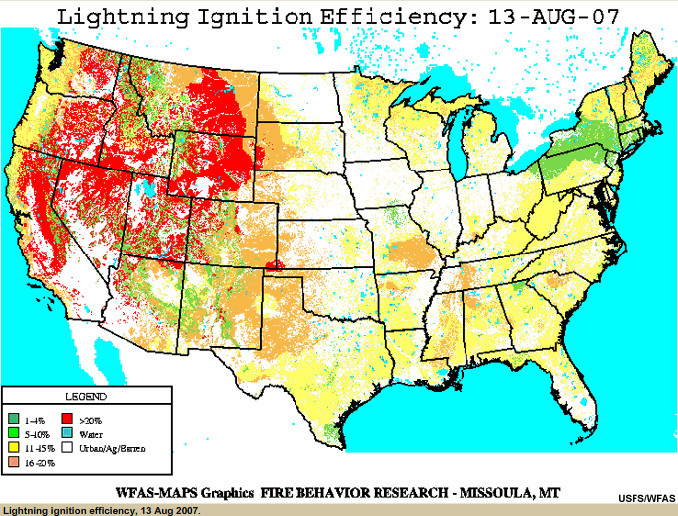
Lightning ignition was highest in areas where there was the right mix of either drier
thunderstorms or abundant lightning over a well-cured and very dry fuel
bed.
Fire spread and intensity was highest in areas coincident with:
- The mid-level dry slot
- The periphery of the thermal ridge
- Strong wind gradients at mid-levels
Outcomes
The hybrid pattern shown in this practice case was the culmination of a breakdown of the upper
ridge combined with a northward extension of the monsoonal moisture plume.
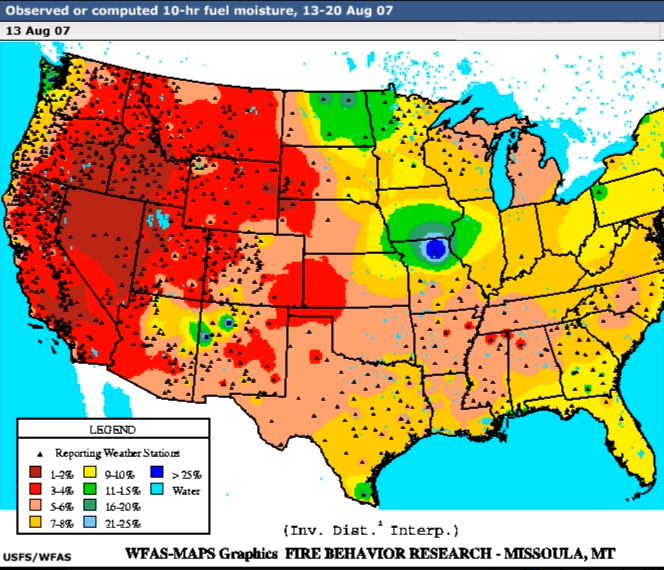
Lightning was primarily associated with the monsoonal fetch but some lightning also affected portions of the
Pacific Northwest and northern Rockies due to the Pacific wave translation. Surface fuel beds found under a
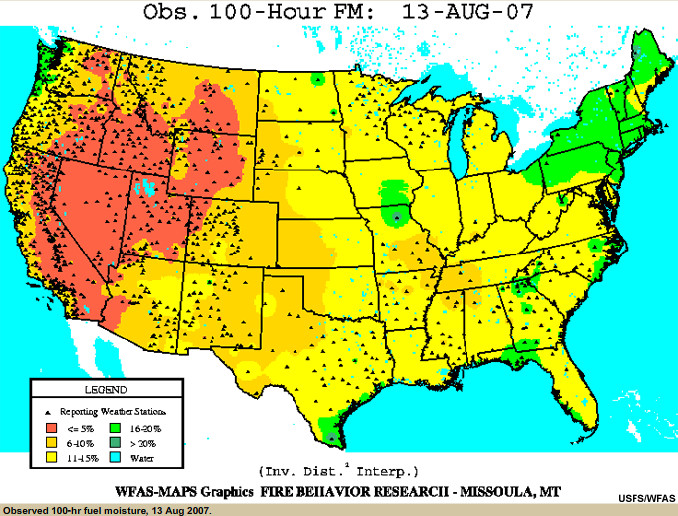
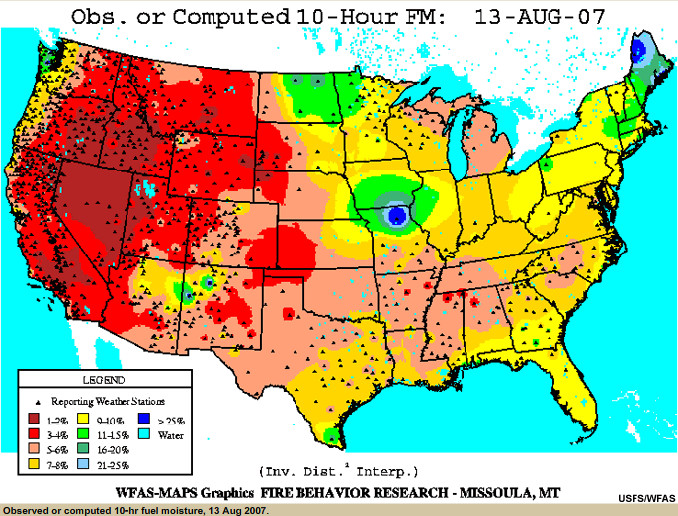
large portion of the lightning-affected areas were dry and prepped for ignitions, as indicated by the 10-hr fuel
moisture graphics. Fire ignitions were most numerous across the Eastern Great Basin due to fuel dryness and the
interaction and residence time of the:
- Mid level dry slot
- thermal ridge
- strong wind gradient
- monsoonal plume.
Review some of the outcomes data loops for this case in the viewer below (check images to see the data
products).
Lightning streaks, as indicated by the accumulated hourly lightning data, also occurred across
this area on 17-18 August, and probably contributed to fire ignitions. Rapid storm movement can mitigate the
effects of an overall wet environment by reducing the time individual storms linger over a given location.
During the primary breakdown phase, critical fire weather conditions, as indicated by SPC
forecasts, included:
- High Haines Index values
- Low humidity
- Strong winds ahead and coincident with the cold frontal passage
These fire weather factors caused both new fire starts and ongoing fires to intensify and spread more rapidly.
Cooler and wetter weather did eventually follow the passage of the vigorous Pacific cold front, increasing fuel
moisture values across portions of the Pacific Northwest and northern Rockies.
You have completed this section on hybrid critical fire weather patterns.
Post-Frontal
A Critical Pattern for the East
A conceptual model of the post-frontal fire weather pattern.
The post-frontal fire weather pattern is the most common and important pattern for much of the eastern U.S.
This section introduces this pattern and presents two case study examples.
Introduction
The post-frontal pattern is the most critical pattern for most of eastern North America. Regions experiencing
critical fire weather in post-front situations include areas east of the Rocky Mountains. Critical fire weather
can also occur behind fronts along the west coast of the US and Canada.
Regional distributions of the post-frontal pattern. This pattern affects fire weather over a
significant portion of the eastern U.S.
Advection of dry air behind the front causes critical conditions associated with this pattern, which generally
range from 6 to 48 hours. A key indicator of this pattern is northwesterly or northerly flow both in upper
levels and surface flow. In the eastern portions of the US and Canada, this flow direction brings drier
continental air into an area.
Changes in the fire weather parameters include below-normal humidity levels, and strong, gusty surface winds.
(Note: This pattern is discussed in the COMET module Introduction to Fire Behavior.)
Example Case: 15-16 Oct 2005
Set-up
This short case study represents an example of a post-frontal fire weather event over the Southeast in October
2005.
Set-up
Strong, persistent high pressure over the eastern U.S. supported above-normal temperatures and northerly
surface flow, which brought drier air to the southeastern U.S. The area of focus for this case includes Alabama,
Georgia, and northern Florida.
Examine the surface and upper-air charts for a quick snapshot of initial conditions (check images to see
the data products).
Evolution
The morning of Oct 16th, foggy conditions in the southeast dissipated with daytime heating. Steady
northeasterly flow was replaced by dry northerly flow as the front passed. The front was mainly tracked as a
wind shift and dew point drop with little change in temperature.
The 925-700 hPa layer winds show steady flow from the north backing to northwesterly flow after frontal passage
indicating that a deep layer of dry air moved into the area of interest. The loop of 500 hPa heights shows
persistent northwesterly winds continuing to steer the dry continental air mass into the southeastern U.S.
Examine the data loops to better understand these processes (check images to see the data products).
Fire Weather
There was little temperature relief following the frontal passage. Instead, post-frontal areas experienced
temperatures in the upper 70s-80s (24-27 C), lower relative humidity, and stronger winds. This combination
created critical fire weather conditions. Relative humidity values of 20% are considered significantly low for
this region of the country.
Outcomes
These dry, breezy conditions resulted in issuance of Red Flag Warnings by NWS offices in Alabama, Georgia and
northern Florida. The next day, rising surface high pressure behind the front caused winds to become lighter,
reducing the risk of critical fire weather.
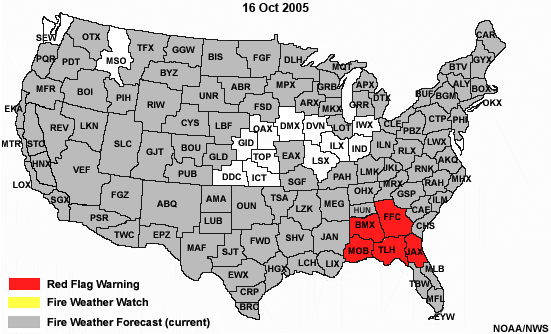
Red Flag Warnings issued by the National Weather Service 16 Oct 2005.
Practice Case: 14-19 Apr 2005
This practice case focuses on conditions behind a cold front that moved through the northeastern U.S. two days
earlier. The area of concern covers Vermont, New Hampshire and Maine.
Set-up
Examine the data products in the box below (check images to see the data products), then answer the
question that follows.
Question
Based on your quick review of the available data, which of the following descriptions is/are likely to be
true?(Choose all that apply then click Done.)
Evolution
How did this event unfold? Examine the data below (check images to see the data products). Then
complete the exercise that follows.
Question
What was the sequence of events? (Decide the order for each event, then click Done.)
Answer
Well done. You have correctly ordered the sequence of events. Pre-existing dry conditions were exacerbated
by advection of dry air in the post-frontal region. With the high pressure, clear skies and greater warming
caused very low humidity for this region (values are considered critical below 30%).
Fire Weather
Re-examine the data products in the box below (check images to see the data products), then answer the
question about fire weather that follows.
Question
Based on your quick review of the available data, which of the following descriptions is/are likely to be
true?(Choose all that apply then click Done.)
Outcomes
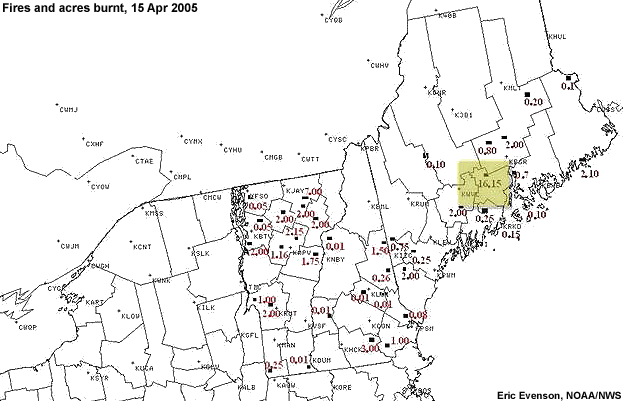
On 15 Apr, numerous fires were reported in Vermont, New Hampshire, and Maine. A 16-acre fire was reported
east-northeast of Waterville, Maine. In this part of the country, fires greater than 10 acres in size are
significant and can impact availability of fire resources.
This pattern persisted in the region with the passage of another relatively dry cold front. Continued warming
and persistent dry air supported new fire activity. However, the absence of strong winds kept the situation
below Red Flag conditions. On 19 Apr, the approach of yet another front with stronger winds resulted in the
issuance of Red Flag Warnings.
Key Points
When diagnosing this type of fire weather pattern, look for the following features:
- Northwest or northerly flow both in upper levels and at the surface, bringing drier continental air into an
area
- Strong post-frontal winds
- Changes in fire weather parameters, including above-normal temperature, below-normal humidity and strong,
gusty surface winds
You have finished the section on the post-frontal fire weather pattern.
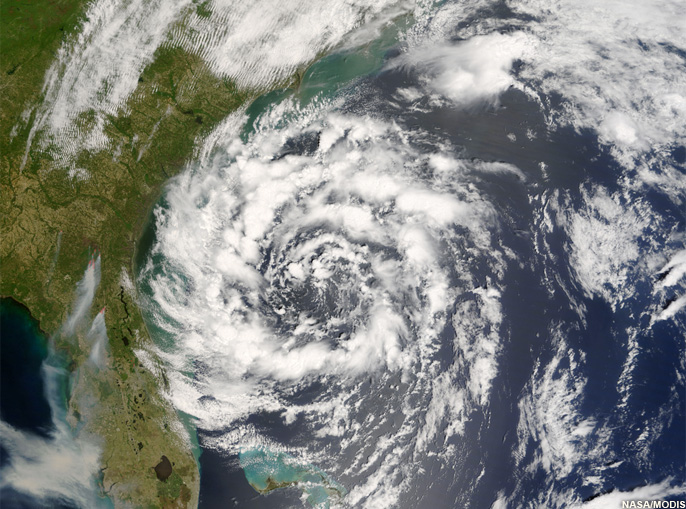
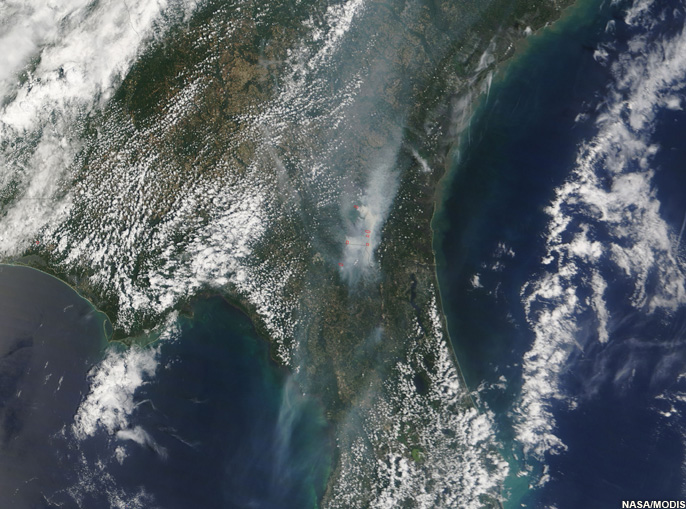
Tropical Storms
Winds associated with subtropical storm Andrea drive large wildfire complexes along the
Florida-Georgia border, 11 May 2007.
Although tropical storms are well-known for their potential to cause heavy precipitation and flooding, they can
also ignite and intensify wildfires. This occurs when lightning in outer bands strikes dry fuel beds and steady,
strong winds associated with the system's circulation extend beyond the cloudy core areas of the storm.
Learn more by reading through the following sections.
Introduction
Tropical storms can trigger fire events along the coastal areas of the U.S. However, these events occur
infrequently because fuels in these areas tend not to be susceptible.
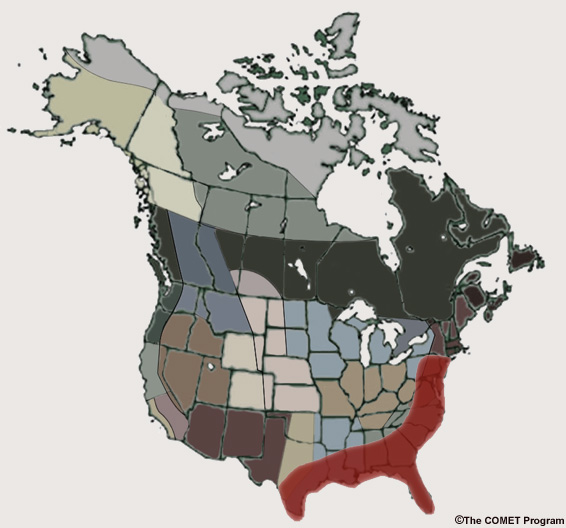
Regional distributions (in North America) of the tropical storm critical fire weather
pattern, shaded in red. This pattern affects fire weather in coastal regions along the Gulf of Mexico and
Atlantic seaboards.
As a tropical storm approaches the coast and later moves inland, fire starts can occur on the western and
northwestern side of the forward-propagating storm. The threatened areas are outside the main
cloud/precipitation shield and coincide with gradient tightening at the surface and aloft. Subsidence aloft adds
to the compressional warming aspect of this event, while the near-surface wind flow advects drier continental
into the fire zone.
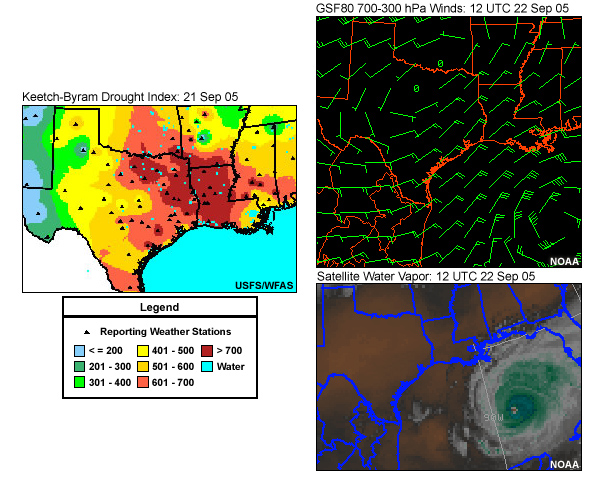
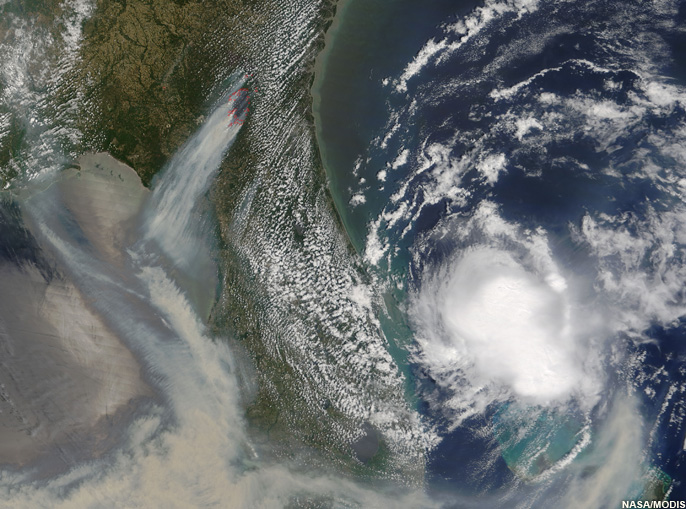
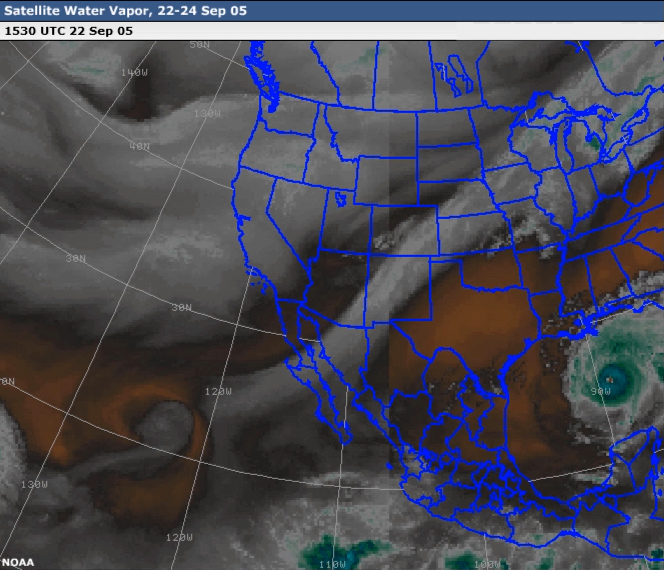
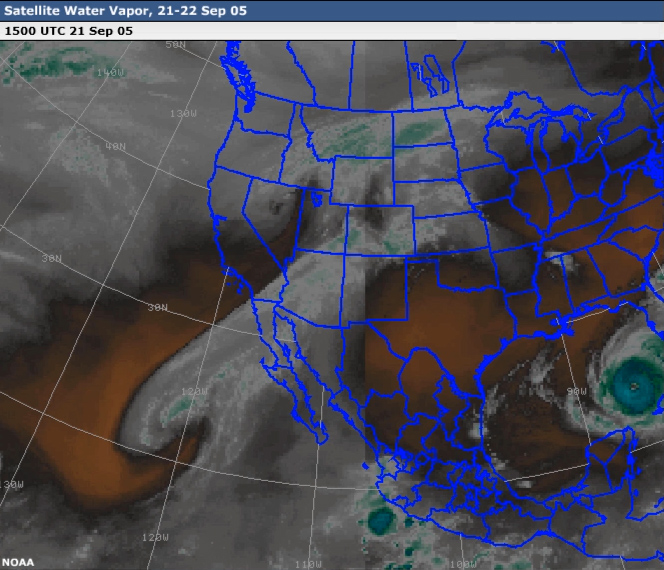
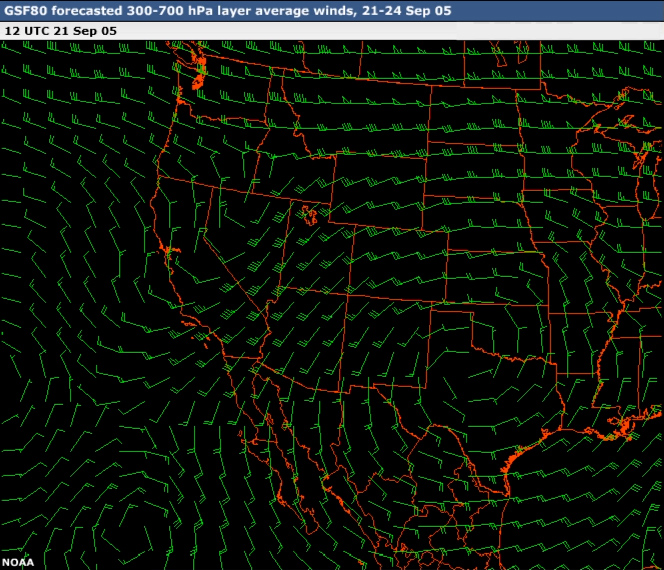
Mid-level winds (upper-right), satellite water vapor data (lower right), and Keetch-Byram
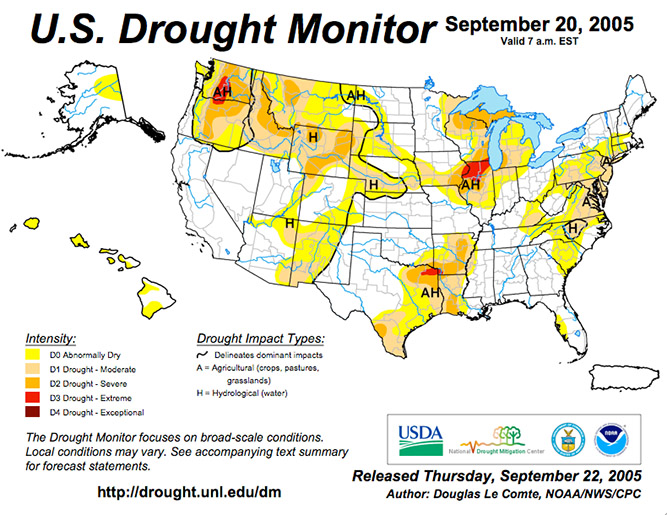
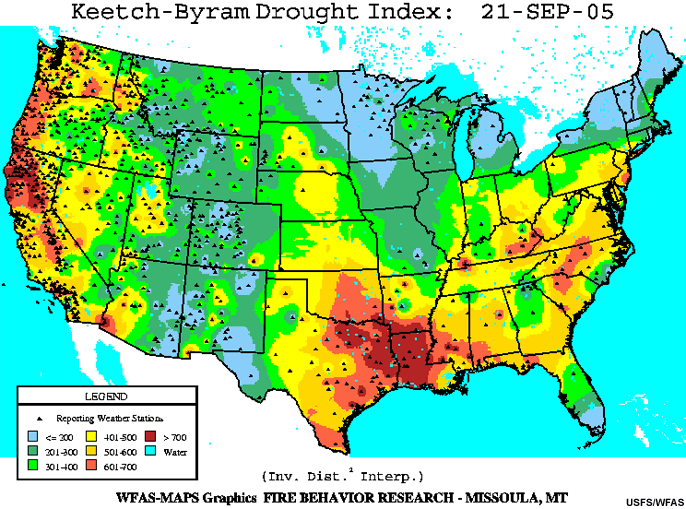
Drought Index (left, illustrating pre-existing drought conditions) from 21-22 Sep 2005. Strong offshore wind
flow and dry air in place prior to landfall can increase the fire danger in areas north and northwest of the
storm. Pre-existing drought conditions and dry fuels increase the probability of lightning ignition outside
the main rain core.
Tropical storm-related patterns tend to develop during the period from May to November. Within this seasonal
period, fuel conditions are typically driest during May-June and September-November. The patterns can last from
several hours to several days, depending on the track of the storm.
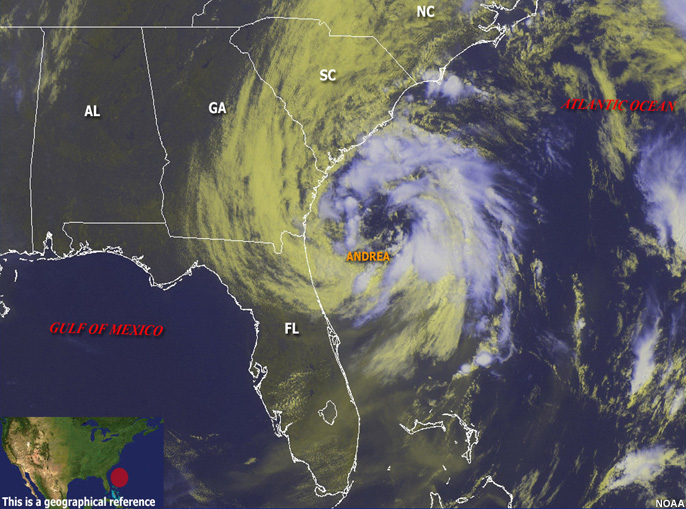
Example Case: Andrea
Set-up
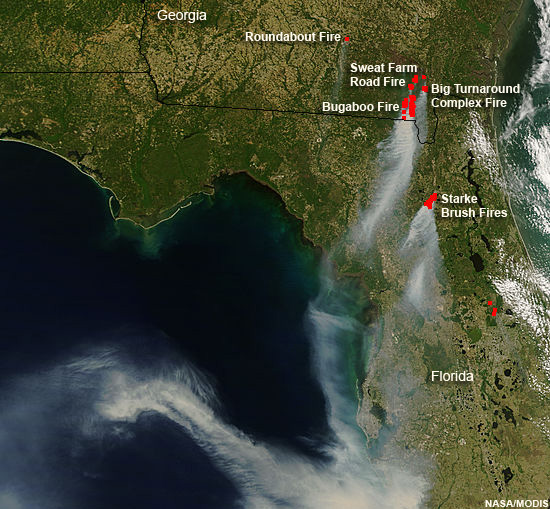
In spring 2007, the region including southern Georgia and northen Florida was in the midst of a historic
drought. Significantly high fuel loading was present forest-wide, and abnormally low water levels in the
Okeefenokee swamp exposed additional fuels.
The Sweat Farm Road and Big Turnaround fires in Georgia started in mid-April, 2007, followed by lightning
ignition of the Bugaboo fire in northern Florida on May 7.
Evolution
Andrea reached subtropical storm status 9-10 May. The system developed off the Florida-Georgia-South Carolina
coast but remained nearly stationary during its short life, trapped within a large middle to upper-level trough.
Andrea’s circulation produced northeasterly winds, which helped intensify the wildfires. Estimated burned
acres for the Bugaboo fire increased from 68,000 acres on 8 May to over 242,000 acres on 14 May.
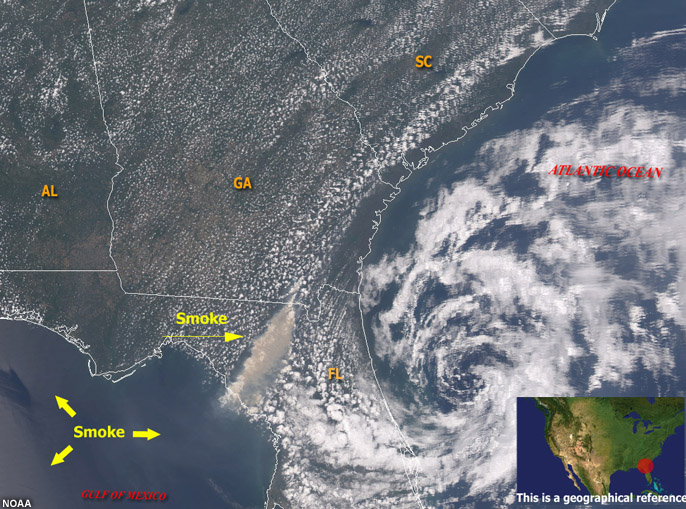
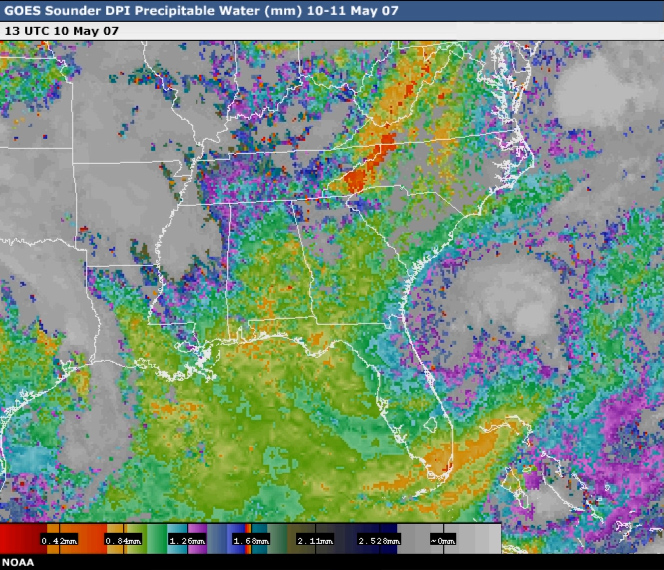
The following data images and loops illustrate conditions over northeastern Florida and southern Georgia.
Notice that, between 9 May and 11 May, Andrea weakened into a thunderstorm complex, while the Bugaboo fire
perimeter expanded significantly. The precipitable water loop indicates drying and subisdence associated with
Andrea remained over the significant fire areas for a sustained duration. In addition, enhanced northeasterly to
northwesterly winds carried dry continental air into the southeast throughout the event.
Fire Weather & Outcomes
During the May 2007 fire event in the Southeast, fire behavior was influenced by land-sea breeze circulations,
with wind shifts and flare-ups occurring frequently in the evenings around dusk when daily fuel moisture was at
its lowest. Although there is little variation in the terrain within the fire zone, tree stands and higher
vegetation islands acted to channel winds in some locations.
Fires tended to be fuel driven at night in the absence of wind even as the inversion set in. Fires remained
active many nights during the event, due to high fuel density and very low fuel moisture levels. This active
behavior occurred even when relative humidity levels were near 90%.
During the period when the fires were influenced by subtropical storm Andrea, northeasterly winds combined with
extremely dry conditions to produce extreme fire behavior and large fire growth. Observers reported that the
class 7 palmetto fuels were burning similarly to class 4 chaparral fuels. Smoke plumes produced by the fires
brought darkness during the afternoon, and firebrands as large as half dollars were reported falling over 10
miles away from the fire.
Lightning ignitions associated with Andrea's outer bands also affected resource management on the large fires
as some crews needed to be pre-positioned for initial attack. On 10-11 May, the Bugaboo fire expanded 60,000
acres while the Big Turnaround Complex grew an additional 7,000 acres.
Large runs and extreme fire behavior resulted when subtropical storm Andrea's winds fanned the flames of
pre-existing fires. But, this was a relatively short and intense phase during a significant and long-lasting
fire event. Altogether, wildfires burned in northern Florida and southern Georgia from 16 April to mid-June. The
Big Turnaround, Sweat Farm Road, and Bugaboo fire complexes burned over 600,000 acres, including about
seventy-five percent of the Okefenokee National Wildlife Refuge.
Practice Case: Rita
Set-up
This practice case study represents an example of a tropical cyclone, Hurricane Rita, which enhanced fire
danger in the lower Mississippi Delta region.
Examine the data products in the box below (check images to see the data products), then answer the
question that follows.
Question
Which of the following describe the situation during mid-September 2005? (Choose all that apply then
click Done.)
Evolution
Examine the data products in the box below (check images to see the data products), then answer the
question that follows.
Question
Judging from the wind data and water vapor imagery, which time frame was likely the most critical period for
fire weather during Rita's approach and landfall? (Choose the best answer.)
Answer
Rita rapidly gained intensity as it reached the warm Gulf of Mexico waters on 20 September, becoming a
Category 5 hurricane on September 21. Prior to making landfall on September 24, it produced strong
northeasterly winds that further dried fuels in the existing drought conditions.
The daytime hours of 21-22 September were a critical fire weather period. During this time, offshore winds
strengthened, while the dry slot aloft remained in place over the region. In addition, diurnal heating and
daytime convective mixing acted to increase surface temperatures and bring dry air to the surface. Fire danger
is always intensified when stronger winds coincide with peak heating.
As the hurricane approached the coast during the day and evening of 22 September, lightning generated in the
storm's outer bands could have caused multiple ignitions. Areas along the northwest periphery of the hurricane
were especially susceptible to lightning fire starts, as fuel beds were very dry and precipitation amounts
were limited.
The afternoon of 22 Sep was the most critical period for fire weather, because it was a time when enhanced
offshore winds coincided with peak diurnal heating and increased lightning ignition potential.
Outcomes
Fire danger was moderate over much of the Gulf Coast by the later part of September. Winds and dry conditions
preceding landfall by Hurricane Rita enhanced the fire danger in parts of Mississippi, Louisiana, and Texas.
Because conditions were already dry, chances of fire ignition by lightning in the storm’s outer bands also
increased.
You have completed this section on the tropical storm-related critical fire weather pattern.
Downslope Winds
Santa Ana winds drive 12 large wildfires in southern California, 23 Oct 2007. Fires stretched
from the Mexican border to north of Los Angeles, forcing evacuation of more than 500,000 people. By 23
October, over 1300 homes had been consumed.
This is an important critical fire weather pattern for many locations situated in the lee of mountain ranges or
other areas of elevated terrain.
Introduction
Downslope winds occur on the leeside of mountain ranges across the U.S. These events are characterized by
strong, warm, dry winds resulting from adiabatic compression of air as it descends. Winds can reach 30-50 mph
(14-23 m/s) and higher. Channeling through valleys and canyons can further strengthen the wind speed.
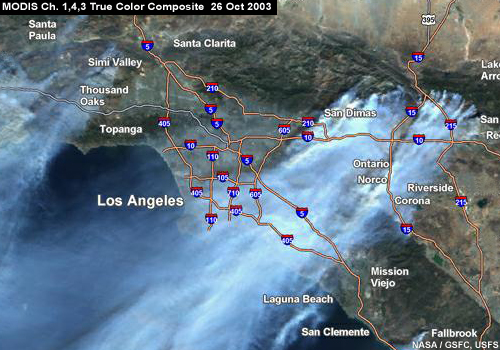
Smoke plumes blanket Los Angeles as the Grand Prix and Old wildfires burn near San
Bernardino, California, 26 Oct 2003.
Some areas of the country have specific names for downslope wind events. These include Santa Ana winds in
southern California, Chinook winds in the Rockies, East winds in northern Oregon and Washington, and Sundowner
winds near Santa Barbara, CA.
The following map shows areas across the US and Canada where downslope winds impact fire weather. Downslope
winds events can occur on time scales of 6 hours to 3 days, depending on the synoptic scale conditions driving
the event.

Regional distributions of the downslope wind critical fire weather pattern.
Downslope Winds in Alaska
Critical fire weather can result in the Alaskan interior when there is strong southerly to southeasterly flow
in the 850-500 hPa layer is channeled through passes in the Alaska Range to move down the northern slopes. This
pattern, which can occur any time of the year, is the most common cause of Red Flag conditions in the interior.
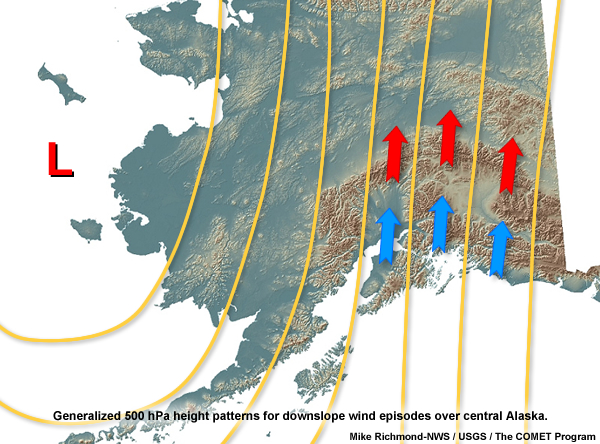
This conceptual model illustrates an upper-level flow configuration, which can create the
downslope winds and critical fire weather conditions in the central interior north of the Alaska Range. Blue
arrows indicate upslope flow, while red arrows indicate downslope flow.
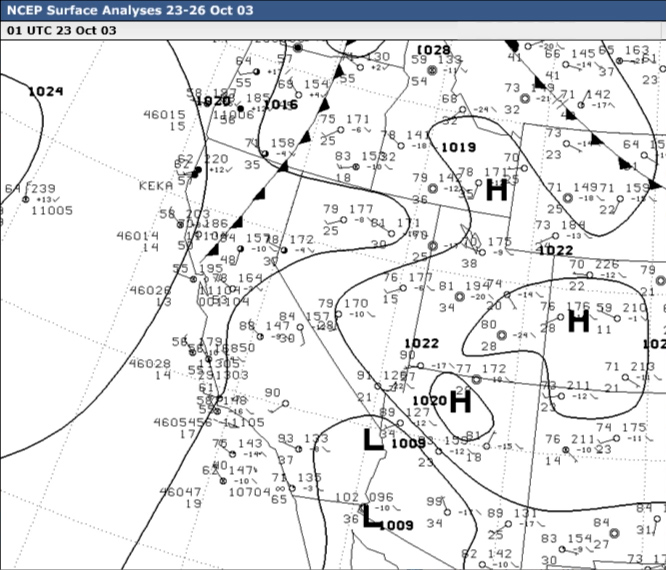
Example Case: Southern California
Set-up
During October 2003, downslope wind conditions contributed to devastating wildfires in Southern California. The
fire environment was preconditioned by a multi-year drought resulting in large amounts of dead fuels.
Above normal precipitation in the February and March promoted growth of grasses that had fully cured and dried
in the summer with above normal temperatures. This resulted in extreme fire danger. The last measureable
rainfall prior to the fire event was in the late spring.
Record high temperatures were observed in southern California during mid-October, prior to the event.
Examine the data products in the box below (check images to see the data products), and familiarize
yourself with the initial set-up for this case study.
Evolution
The evolution of this fire weather event was typical of a Santa Ana wind pattern:
- A high pressure ridge built off the west coast of the U.S.
- A surface high strengthened over the inter-mountain west and extended southward.
- Dry air from the Great Basin and Mojave desert moved into coastal southern California.
- A thermal trough moved off the west coast, extending the strong flow off shore.
Examine the surface and upper-air data loops in the box below (check images to see the data products),
to review the evolutionary stages of this case event.
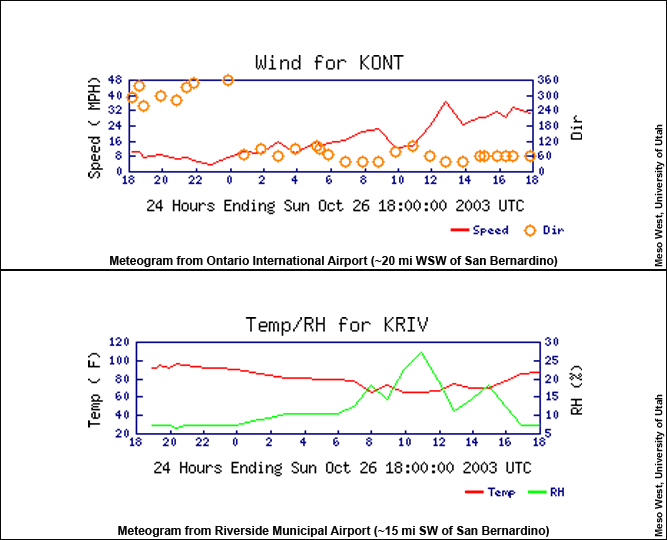
Fire Weather
Strong winds moved into the lower elevations of southern California on 25 October and lasted through 27 Oct
with peak winds on 26 Oct. Observed wind speeds during the fire ranged from 15-25 kt with gusts greater than 50
kt.
Relative humidity values dropped below 10% during most afternoons; overnight recoveries reached only as high as
20-30%.
Outcomes
Thirteen major fires ignited between 21 and 28 October in Southern California and northern Baja, Mexico.
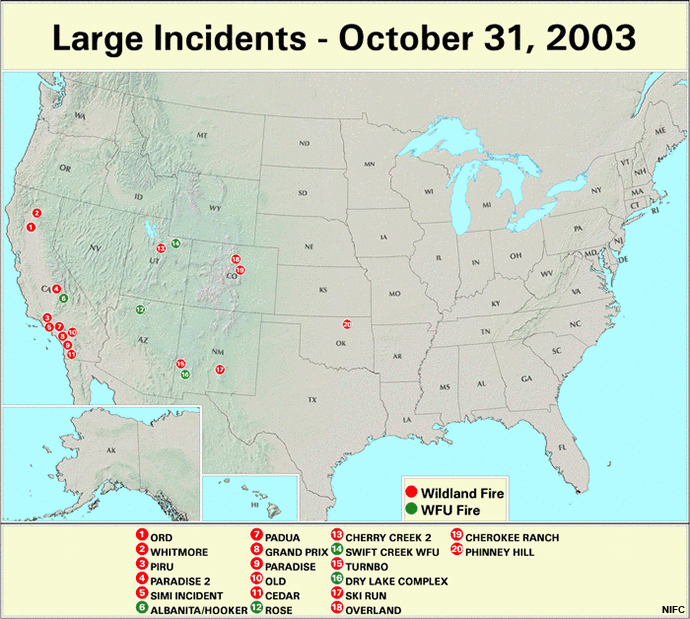
Large fire incidents active on 31 Oct 2003. Seven of these (Piru, Simi, Padua, Grand Prix,
Old, Paradise, and Cedar) were associated with the Santa Ana winds event.
Together, the fires burned over 700,000 acres, destroyed 3600 homes and resulted in 22 fatalities. The Cedar
Fire burned over 270,000 acres alone.
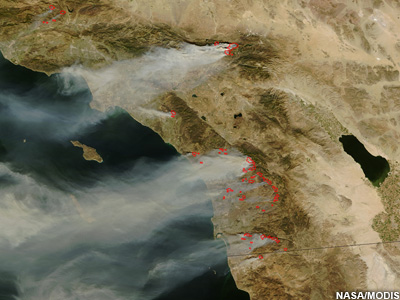
Astronaut photograph taken from the International Space Station shows smoke plumes from
wildfires in the San Bernadino Mountains, 11 LT, 26 Oct 2003. This photo, which looks toward the southeast,
shows thick yellow smoke blowing toward the south, blanketing the valley below.
Santa Ana winds drive multiple wildfires in southern California, 28 Oct 2003. From top-left
to lower-right, they include the Piru, Simi Incident, Verdale Fires to the northwest of Los Angeles, the Old,
Grand Prix, and Mountain Fires in the San Bernardino Mountains, and the Paradise and Cedar Fires east of San
Diego. By the time this image was gathered, 17 deaths were attributed to the fires, which had consumed over
1136 homes.
Heavy fuel loads and the extreme dryness of fuels allowed the fires to develop extreme behaviors. Fire whirls
as wide as 2600 ft (800 m) were observed while fire brands were observed by pilots at altitudes up to 1500 ft
AGL.
By 29 Oct, winds had shifted to westerly, bringing higher humidity levels and cooler temperatures into the fire
zones. Tremendous smoke plumes spread across southeastern California into southern Nevada and western Arizona.
Smoke from the fires blanketed southeastern California and Nevada and eastern Arizona.
To learn more about this devastating fire event see:
Practice Case: Front Range
Set-up
This case focuses on a downslope wind event that affected the Front Range of northern Colorado on 28-30 October
2003.
Take a quick look at the initial conditions for this case, as represented by the charts in the data viewer
below (check images to see the data products). Then answer the question that follows.
Question
Which of the following statements best describe the initial setup for this case? (Choose all that apply
then click Done.)
Evolution
How did this event unfold? Examine the data loops below (check images to see the data products). Then
complete the exercise that follows.
Question
What was the sequence of events? (Decide the order for each event, then click Done.)
Answer
This case unfolded with classic indicators of strong downslope events in the Rockies. In the upper levels,
development of zonal (west to east) flow helped form mountain waves, which contributed to downslope acceleration
of flow on the leeside of the mountains. At the surface, a leeside trough developed with a very strong east-west
pressure gradient. Strong downslope winds did develop in this situation. However, a cold front moved in from the
north and ended the downslope event while bringing precipitation to the area.
Favorable conditions for downslope winds were in place by late in the evening of 28 October. Specifically, a
strong low-level trough was located just east of the Front Range with a strong east-west oriented pressure
gradient over the area of interest. This setup intensified into the morning of 29 October, then persisted until
a strong cold front moved southward through the area during the evening of 29 October.
Outcomes
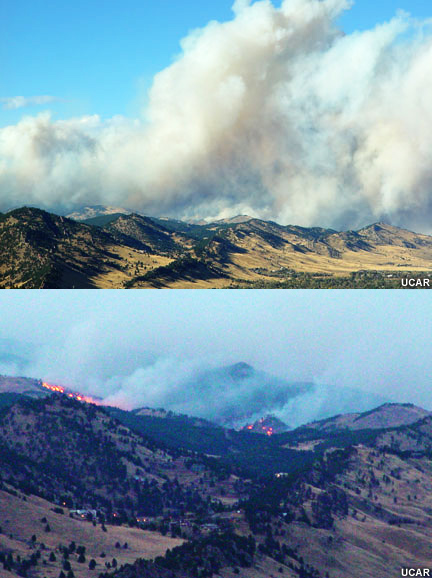
Top: An early afternoon photograph taken looking north from NCAR's Mesa Lab facility in
Boulder, Colorado. The fire, driven by strong winds, was spreading rapidly.
Bottom: By evening, flames could be clearly seen backing down the hillsides near Boulder.
Photo by Lynda Lester, UCAR/NCAR/SCD.
An explosive wildfire spread by high downslope winds began in the foothills just northwest of (about 10 miles
from) Boulder, Colorado early on the morning of 29 Oct 2003. By late afternoon it had already spread to 3500
acres and was threatening 250 residential structures. According to on-site reports, high winds were causing
erratic fire behavior. Helicopters, air tankers and ground crews were active at this time.
The initial rapid spread of this fire was driven by downslope winds and prefrontal conditions.
The frontal passage at about 7:00 to 8:00 pm on 29 October quickly put an end to the downslope winds, while
cooling and moistening the lower atmosphere.
The Incident Status Summary for the afternoon of 30 October indicated that rapid fire spread ceased shortly
after the afternoon report on 29 October, and that the fire had been completely contained. Surface temperatures
at this time were near freezing, precipitation developed quickly behind the surface cold front late in the
evening of 29 October.
Strong downslope winds drive plumes of smoke eastward over the Front Range. Photo by Lynda
Lester, UCAR/NCAR/SCD.
You have completed this section on the downslope winds critical fire weather pattern.
Other Mesoscale Patterns
Gap winds, outflow boundaries, and land/sea circulations are three important mesoscale
critical fire weather patterns.
Any weather pattern that can influence fire weather elements (strong winds, high temperatures, low humidity
levels, instability) can become a critical fire weather pattern if it occurs in an area where fuels and
topography conditions support fire growth and spread.
Several of the more important mesoscale processes for fire weather are introduced in this section.
Gap Winds
Gap winds can be highly localized.
Gap winds develop at low levels of the atmosphere in locations where there are gaps between or depressions
within areas of higher terrain. They tend to be localized, and the horizontal extent can vary from hundreds of
feet to over one hundred miles. The vertical extent of these winds is normally quite shallow, reaching only
hundreds of feet to a few thousand feet above the surface.
Gap winds occur in numerous locations throughout North America. Knowledge of local terrain is essential to
recognizing regions susceptible to the development of gap winds. The duration of these wind events depends on
the timescale of the driving mechanism.
The main effect of air flowing through a gap is acceleration of the flow, resulting in wind speeds of 20-60 kt
depending on the factors driving the acceleration.
Evolution
Gap winds are driven by two main mechanisms:
- Pressure gradients associated with synoptic or regional-scale features
- Pressure gradients associated with rapid changes in the depth of cool air at low levels with colder air
masses on the upstream side of the gap
Synoptic pressure gradients can force acceleration through terrain gaps .
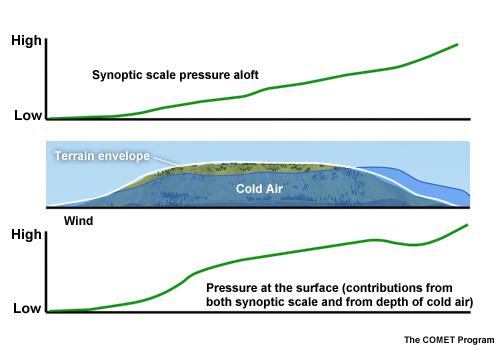
This schematic cross-section illustrates pressure gradients caused by differences in air
mass temperature and density on either side of the terrain feature.
The strongest winds occur in the gap exit regions, as winds accelerate through the gap. In mountain pass areas,
gap wind mechanisms can combine with downslope wind mechanisms to generate winds stronger than 100 kt. For
more detailed information on the development of gap winds and numerous examples, please see the Gap Winds module.
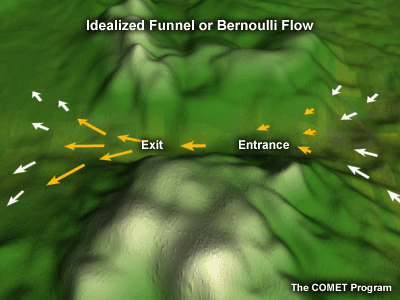
The strongest winds are found in the gap exit regions.
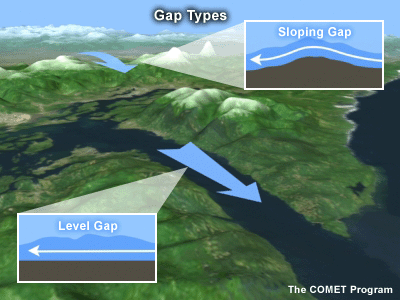
Gap wind effects can be generated both mountain passes and terrain cuts such as river
channels or fjords.
Application to Fire Weather
Wind
The most obvious fire weather effect of gap winds is wind speed. Areas with gaps in terrain are likely to
experience much stronger cross-slope winds. Since wind is a major driving factor in fire spread, forecasts of
gap winds are critical to fire weather customers.
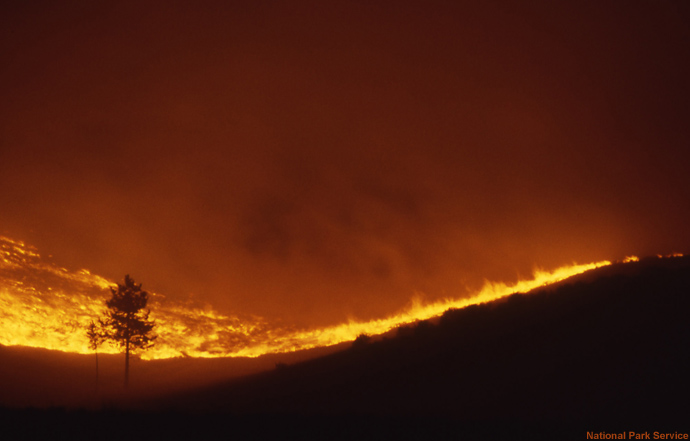
Grass fire at Yellowstone National Park, 1988.
Temperature
Gaps can link air masses of very different characteristics. In the case of gap winds driven by a pressure
gradient due to low-level changes in the depth of cool air, the air flowing through the gap may be cooler than
on the leeside of the gap. In sloped terrain, gap winds may act to accelerate air warmed by downslope flow.
Relative Humidity
Dry air may be forced through the gap by differences in air masses across the gap. Decreases in relative
humidity can occur within the gap winds resulting in hot, dry, windy weather.
In other situations, cool, moist air can be pushed through gaps, undercutting a smoke plume. This can result in
multiple spot fires as the plume collapses.
Summary
Understanding the forcing mechanisms of gap winds will help identify situations of potentially strong winds,
wind shifts, and changes in humidity. Also, knowing where gaps in terrain exist, and those typically subject to
the development of gap winds, will help you provide critical information to your customers.
Outflow Boundaries
Air cooled within a thunderstorm is mixed downward along the storm’s perimeter, creating a colder, more
dense air mass that is separated from the surrounding air by an outflow boundary. Outflow boundaries can persist
for 24 hours or more and travel hundreds of miles from the originating thunderstorm. The boundary passage is
important to fire weather as it brings about a sudden increase in wind speeds with a wind shift and a drop in
temperatures. Outflow boundaries can also trigger the formation of new thunderstorms. The pattern can occur
anywhere thunderstorms occur so is an important consideration for fire weather throughout North America.
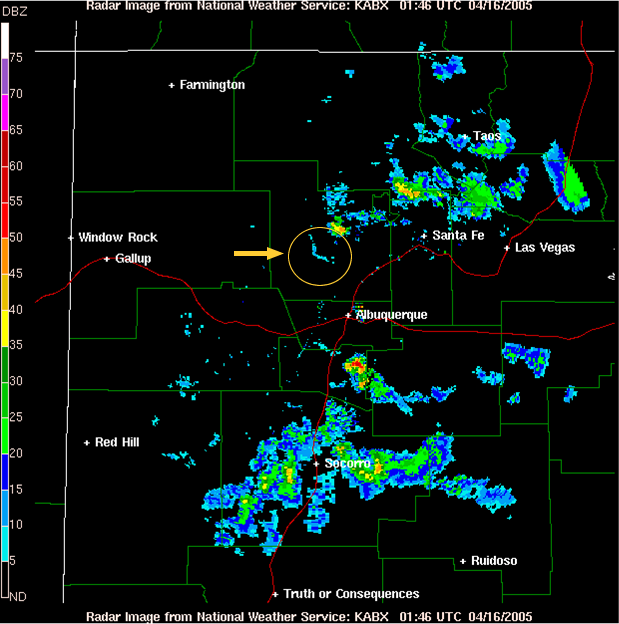
Outflow boundaries mark the edge of a cooler air mass being pushed outward by
thunderstorms. In this radar image, a microburst west of Santa Fe produced outflow propagating toward the
southwest. A new line of convection has developed along the outflow boundary, indicated within the yellow
circle.
Example Case
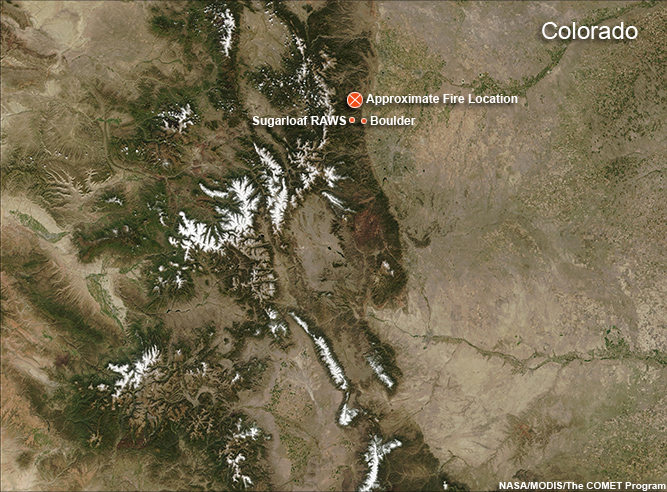
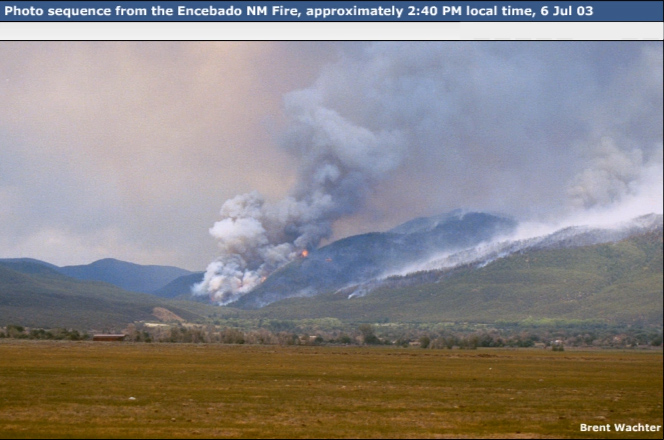
Outflow boundaries result from the downward and outward flow of air cooled within a thunderstorm. On July 6,
2003, a band of high based showers (virga) formed over the upper reaches of the Rio Grande valley, northwest of
the Encebado fire near Taos New Mexico.

Map of central-northern New Mexico, showing the fire location.
2:25 PM
The initial outflow boundary which eventually affected the fire area passed over the incident command post
(northwest of the fire location).
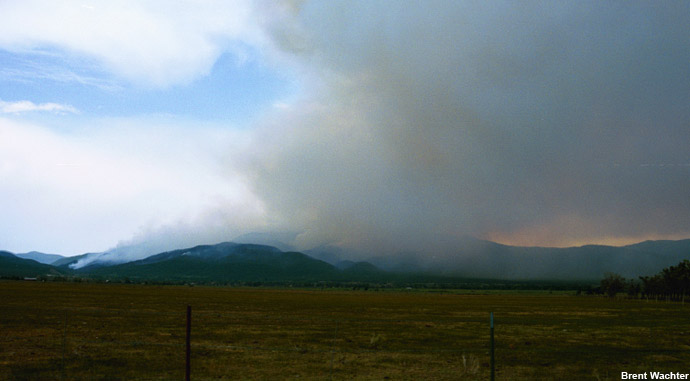
A wind gust associated with an outflow boundary is indicated by the wind sock in this
photo, taken 2:25 PM local time.
2:30 PM
Signs of an outflow boundary passage included an increase in wind speeds, which accelerated the fire activity.
The outflow also suspended dust and ash above the surface, providing visual information about the height of the
cooler air mass. Outflows that emanated from the band of high based showers located over the upper Rio
Grande valley were drier in origin and provided only slight increases in humidity while wind speeds increased
dramatically.
Passage of the outflow boundary is indicated by suspended dust along the base of the
mountains and the movement of ash getting swept along the ridges. Photo taken at 2:30 PM local time.
2:35 PM
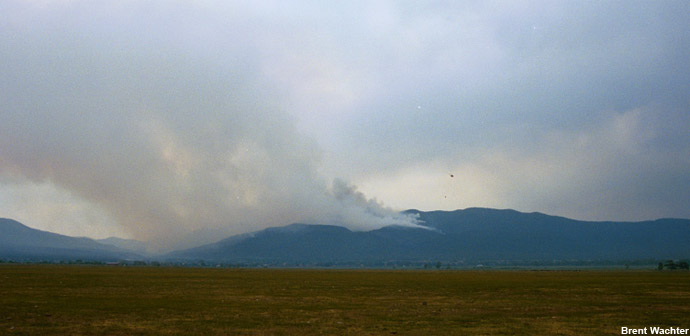
The band of virga continued to slowly propagate toward the south-southeast, emitting several outflow pulses.
As outflow winds reached the fire, the smoke column began to shift direction. The fire also
became more active. Photo taken at 2:35 PM local time.
2:40 PM
Affected by the relatively dry outflow pulses, the fire column shifted direction and the fire began to pick up.
As a stronger outflow pulse reached the fire, flame lengths increased to near 200 ft (60 m) and the fire
behavior became more extreme. Crews had sought refuge in their respective safety zones well before this point.
2:45 PM
Spot fires developed as a result of the strong outflow push.
Spot fires have been ignited from firebrands falling out of the initial smoke plume. Photo
taken at 2:45 PM local time.
Storms in the Moreno Valley
At the same time, wetter thunderstorms formed over the Moreno Valley just to the east of the fire area. These
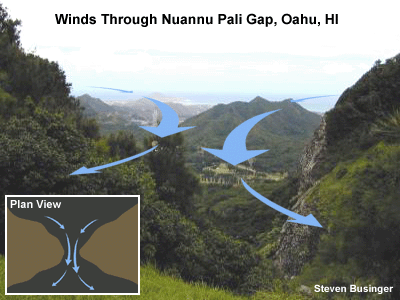
storms, positioned to the east of the dryline, filled the valley with cooler, more dense air. Outflows from
these storms combined with the pressure difference between the Moreno Valley and upper Rio Grande valley forced
cool, moist air westward through the terrain gap leading to the fire area. The wind direction shifted to the
northeasterly and fire activity diminished.
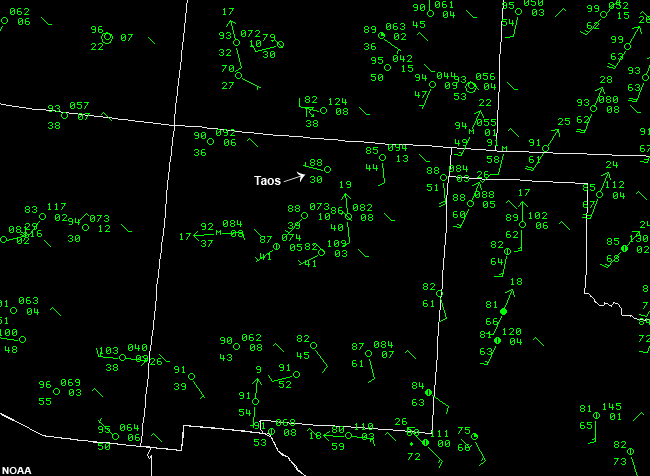
METARs, 18 UTC, 6 July 2003. The observation for Taos, NM is highlighted.
Cool, moist gap winds affect the fire as smoke drifts towards the southwest. No visible
flame can be seen. Photo taken at 3:20 PM local time.
4:30 PM
The band of virga moved just to the west of Taos and emitted another outflow pulse. The resulting wind shift
caused smoke to be blown in a new direction, toward the northeast.
A subsequent outflow from the southwest of the fire area resulted in a second wind shift,
which pushed smoke toward the northeast. No visible flame can be seen. Photo taken at 4:30 PM local time.
Outcomes
Several wind shifts impacted the Encebado fire over a two-hour period of time. Fire behavior was most intense
during the outflow pulses that were generated by the virga band to the northwest of the fire location. These
outflows were drier than the moist gap wind that later affected the fire area. Abundant cloud cover also helped
reduce fire activity as the afternoon progressed.
Land/Sea Breezes
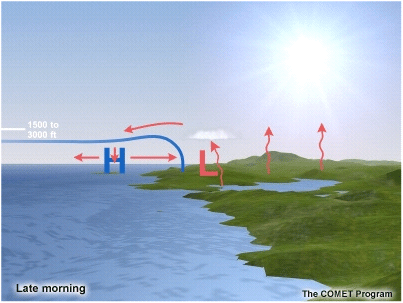
The strength of land/sea breeze winds is proportional to the magnitude of the land and sea
temperature difference and dependent on the direction and the strength of the prevailing synoptic flow.
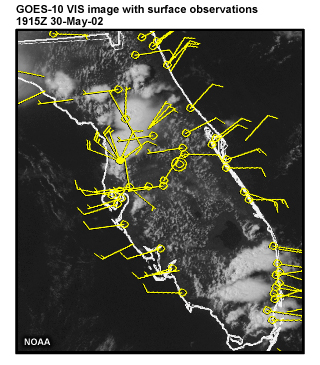
An example of sea breezes over Florida in the late morning. Onshore flow is indicated at
all coastal locations, while convection has been initiated over northwest Florida. The associated outflow at
the surface has overwhelmed the sea breeze signature in this region. By 1915Z, deep convection has also
developed rapidly over southeastern Florida, likely due in part to sea breeze convergence.
The sea breeze is most common in the spring through fall months. It results from a circulation that sets up
between the ocean and shoreline due to surface temperature differences during the day.
Sea breezes are most easily evaluated under conditions of relatively weak synoptic scale winds.
Sea breeze winds are typically between 10 and 20 knots. The vertical depth of these winds reaches near 500 ft
(~150 m), while the associated circulation typically tops out between 1,500 and 3,000 ft (460-915 m) above the
surface.
A sea breeze normally begins in the late morning and lasts through the late afternoon, completely ending a few
hours after sunset.
The effects of a sea breeze typically extend about 25 mi (40 km) inland, but sea breeze fronts have been known
to push inland as far as 100-200 mi (160-320 km) under moderate onshore flow.
Similar types of winds occur near lakes and even rivers. However, the circulation and resulting winds are
normally weaker than the sea breeze.
For more detailed information about sea breezes, please visit the COMET module on Sea Breezes.
Evolution
Sea breezes develop perpendicular to the shoreline. As they set up, a sea breeze front develops, separating the
warm air over the land surface from the cooler, more moist air over the ocean.
Warm Ocean Water
In an unstable atmosphere, cumulus clouds often develop along the sea breeze front. Depending on the
orientation of the coastline, convergence and cumulus formation may be enhanced. These clouds can develop into
thunderstorms with lightning, gusty winds, and perhaps precipitation.
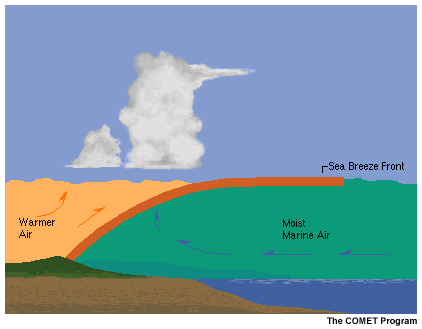
Cumulus clouds form over the sea breeze frontal boundary.
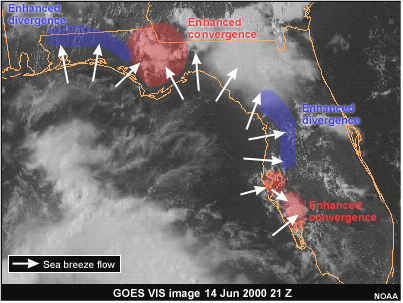
Convergence and divergence patterns are determined by coastline configurations.
Cold Ocean Water
With cooler ocean temperatures, such as along the west coast of the U.S., the sea breeze occurs under more
stable conditions. Sea breeze winds advect cooler, more moist air inland, often including fog and low stratus.
Application to Fire Weather
Warm Ocean Water
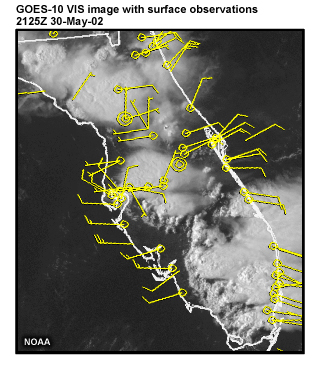
An example of sea breezes over Florida in the afternoon. Onshore flow ranges from 10-25
knots around the coast, with several areas of deep convection, most of which are well inland. Coastal wind
observations are likely influenced at this time in many areas by flows associated with the convective cells.
Wind
On-shore flow can bring a change in wind direction and increase in wind speed, causing a change in direction
and speed of fire spread. If convective elements develop along the front, gusty winds accompanying these storms
can contribute to erratic fire behavior.
Relative Humidity
RH increases as higher dewpoint air moves onshore, depending on the air mass in place over land.
Temperature
Temperatures typically decrease because marine air is usually cooler than air over the land surface.
Lightning
Convection along the sea breeze front may be strong enough to produce thunderstorms that can generate lightning
and ignite new fires.
Cold Ocean Water
Wind
The wind direction becomes onshore. The strength of the winds is often sufficient to change the direction of
fire spread. However, relatively stable conditions make thunderstorm development less likely, so winds tend to
be more uniform in nature.
Relative Humidity
RH increases as the cool, moist air over the ocean moves inland. There tends to be a lag between the onset of
the sea breeze and a substantial increase in relative humidity. So initially, the wind shift will be
experienced, causing a shift in the direction of fire spread without a significant decrease in activity. Often
behind the sea breeze front, coastal fog moves inland.
Temperature
Temperatures are cooler behind the front which can also help to decrease fire activity.
A satellite view of fires associated with the October 2007 Santa Ana event in Southern
California. Marine stratus approaches the coast after Santa Ana winds have subsided and the sea breeze pushes
smoke plumes eastward. Image acquired 25 Oct 2007.
Example
Dr. Harry D. Johnson of the San Diego State University Department of Geography created 3D fire spread animations of the
devastating Cedar, San Diego County, and Paradise Fires, which occurred in October, 2003. Toward the end of the
Cedar Fire animation, you can observe the effects of the wind shift. Fire spread reverses direction, and begins
moving upslope toward the east. Although onshore flow is associated with less active fire behavior, the fire
continues to move inland and up the topographic features. The onshore flow did help firefighters contain the
fires.
Summary
Thermally forced land/sea circulations can have tremendous impacts on fire spread and intensity in coastal
regions. These mesoscale processes can produce strong, gusty winds, temperature and humidity shifts, and trigger
thunderstorms. Depending on sea temperatures, coastal configurations, and diurnal phase, sea breezes can cause
fires either to intensify or diminish. You should be alert to these potential impacts whenever forecasting fire
weather in coastal regions.
You have finished this section on other mesoscale critical fire weather patterns.
Resources
Fire Seasons
Welcome
This reference section provides two interactive tools for exploring regional variations in fire seasons.
Calendar Grid
This interactive grid lets you display and compare fire seasons for many different climatological regions. This
calendar is also cross-referenced with the regions references for this module.
Fire Season Map
This interactive map allows you to view seasonal variations in geographic context. A calendar slider lets you
scroll to different times of year, providing a snapshot view of fire seasons in different regions.
Click Calendar Grid and Fire Season Map (above) to access
these tools.
Calendar Grid
This reference tool lets you compare wildfire seasons for different regions.
Note, when using this tool, that the seasonal boundaries are approximate. Fire seasons have many yearly
variations, and no two fire seasons are exactly alike.
Fire Seasons Map
This reference tool gives you a geographic perspective on wildfire seasons. Click and drag the slider to see
seasonal variations for all the wildfire regions at once. (Prescribed fire seasons are not indicated by this
reference.) Notice that the seasonal transitions are not sharply defined, as the shift between fire seasons
usually a gradual process. You can see this reflected in the color transitions between red, yellow, green, and
gray.
Note, when using this tool, that the geographic and seasonal boundaries are approximate. Fire seasons have many
yearly variations, and no two fire seasons are exactly alike. Also, there are many within-region variations,
such as those dependent on elevation or micro-climate, that are not reflected in this broad brush overview.
January

February
March
April
May
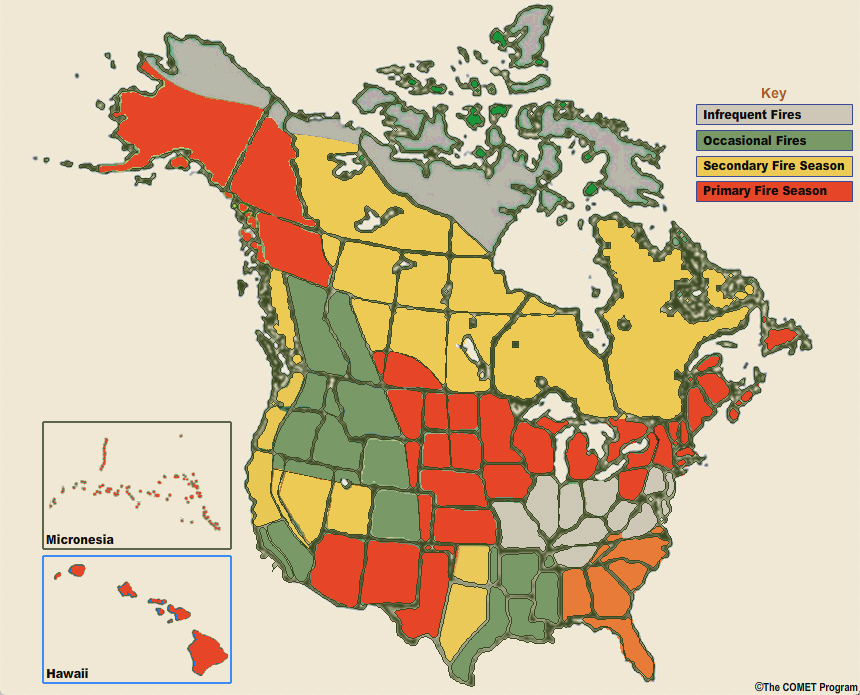
June
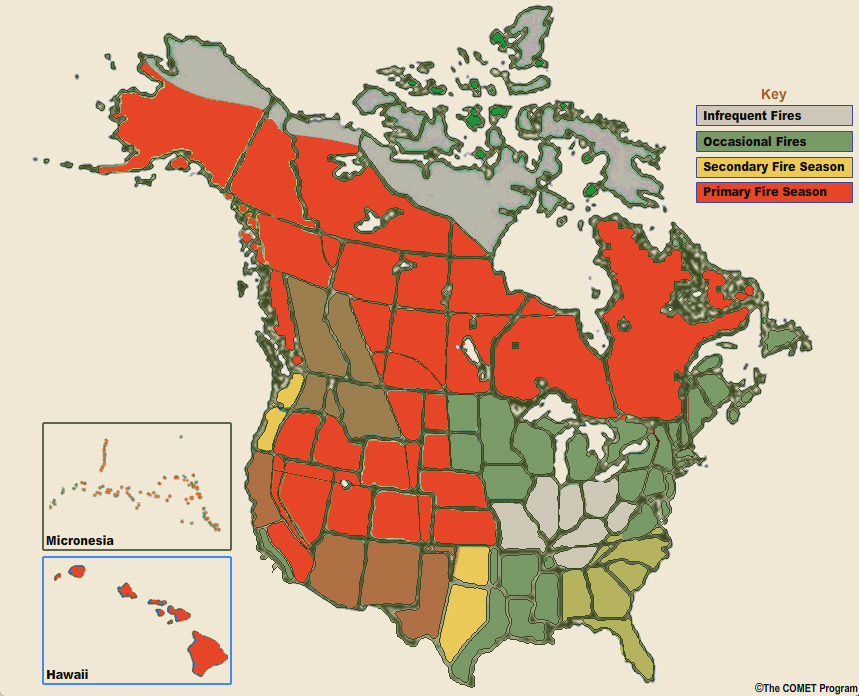
July
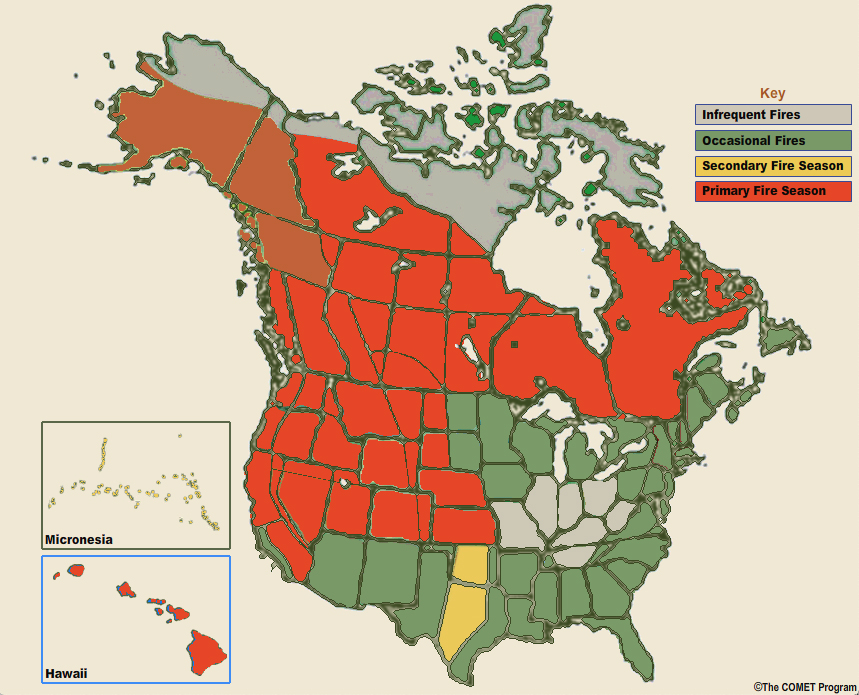
August
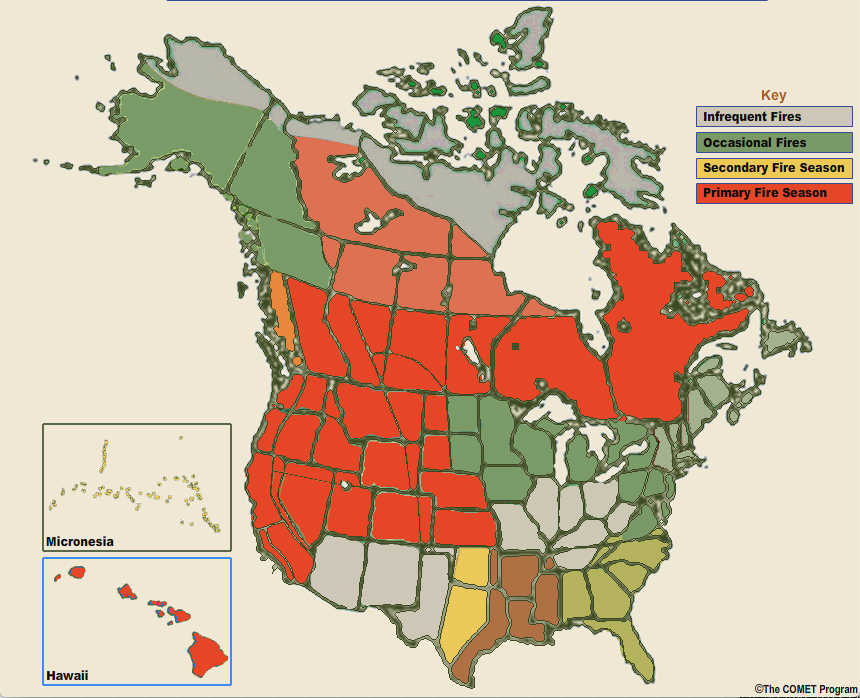
September
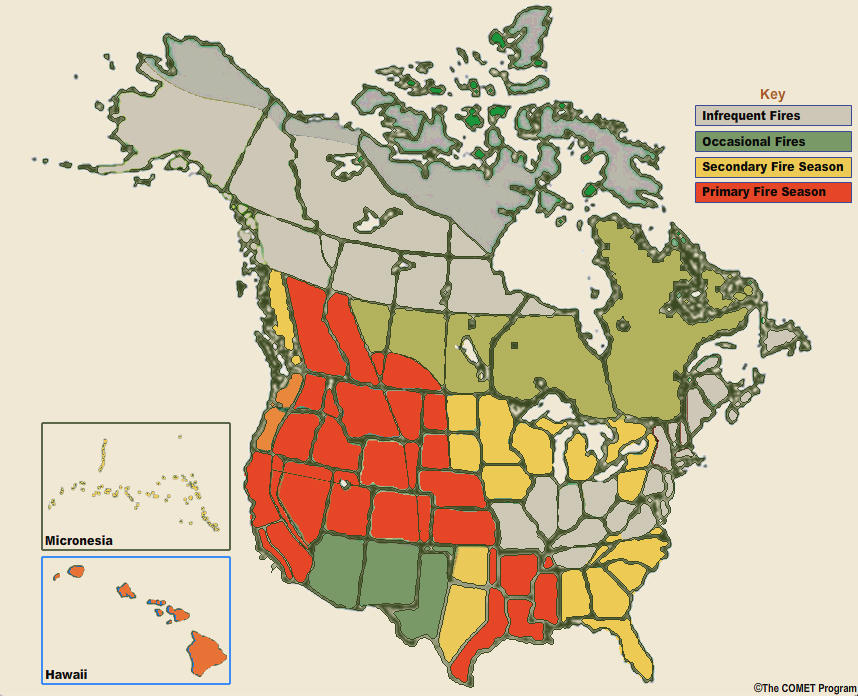
October
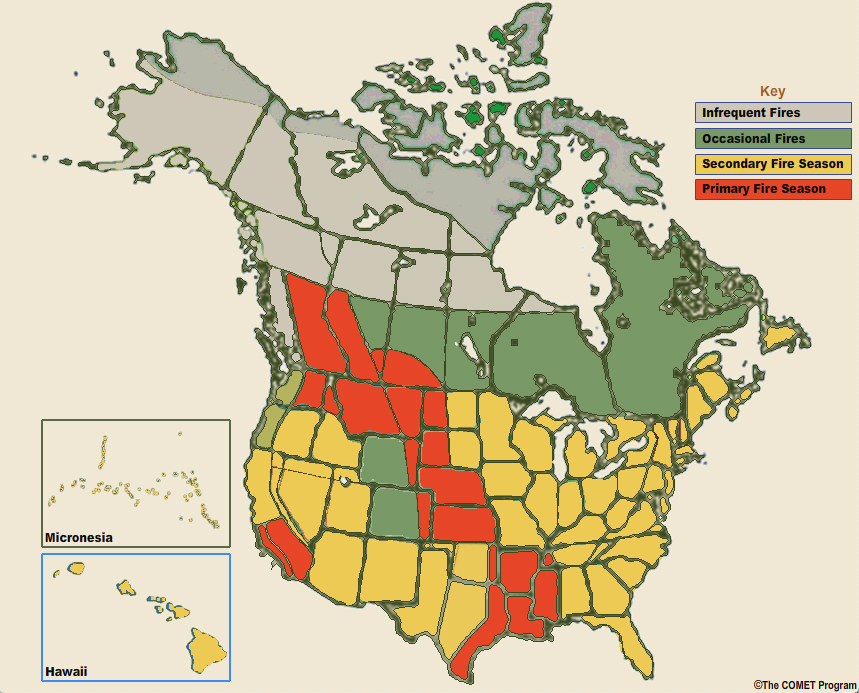
November
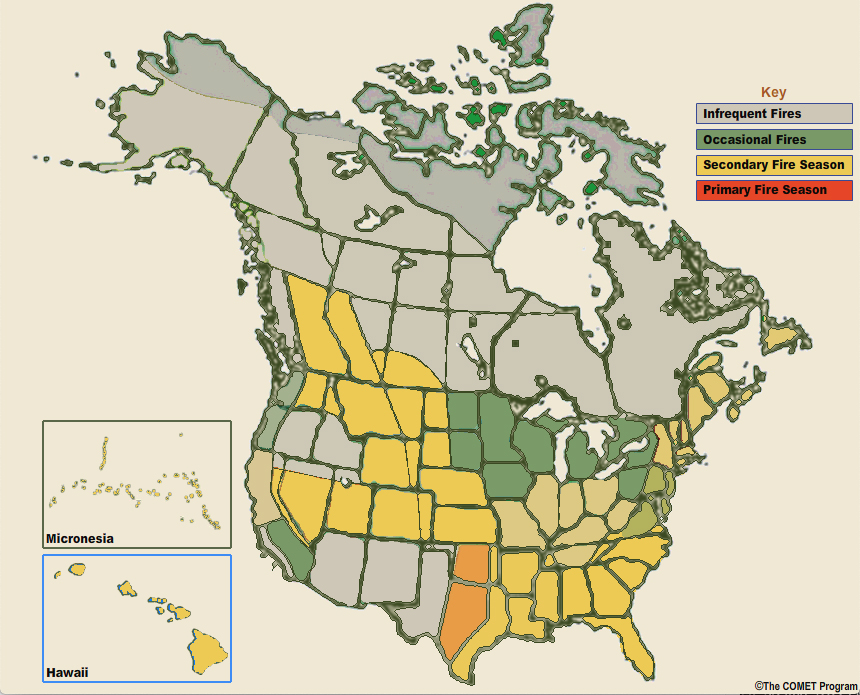
December
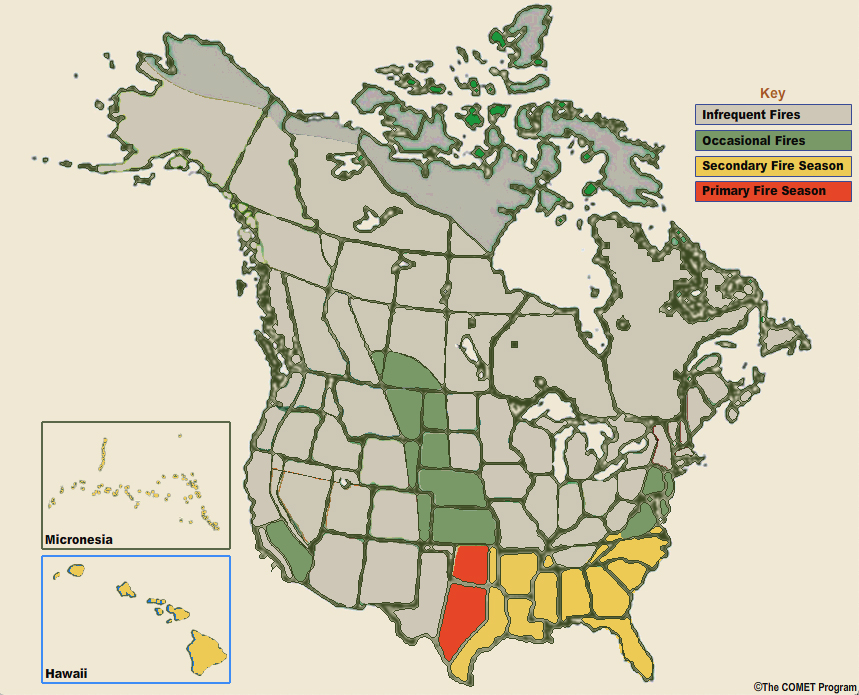
Contributors
COMET Sponsors
The COMET® Program is sponsored by NOAA National Weather Service
(NWS), with additional funding by:
Air Force Weather Agency (AFWA)
Australian Bureau of Meteorology (BoM)
Meteorological Service of
Canada (MSC)
National Environmental Education Foundation (NEEF)
National Polar-orbiting Operational
Environmental Satellite System (NPOESS)
NOAA National Environmental Satellite, Data and Information
Service (NESDIS)
Naval Meteorology and Oceanography Command (NMOC)
Principal Science Advisor
Brent Wachter — NWS
Additional Science Contributor
Dr. Doug Wesley — UCAR/COMET
Project Lead
Dr. Elizabeth Mulvihill Page — UCAR/COMET
Instructional Design
Dwight Owens — Alphapure Design Studio
Technical Contributor
Amy Stevermer —UCAR/COMET
Computer Graphics/Interface Design
Brannan McGill — UCAR/COMET
Multimedia Authoring
Dwight Owens —Alphapure Design Studio
COMET HTML Integration Team 2021
Tim Alberta — Project Manager
Dolores Kiessling —
Project Lead
Steve Deyo — Graphic Artist
Ariana Kiessling — Web Developer
Gary
Pacheco — Lead Web Developer
David Russi — Translations
Tyler Winstead — Web
Developer
COMET Staff
Director
Dr. Timothy Spangler
Deputy Director
Dr. Joe Lamos
Business Manager/Supervisor of Administration
Elizabeth Lessard
Administration
Lorrie Alberta
Michelle Harrison
Hildy Kane
Graphics/Media Production
Steve Deyo
Seth Lamos
Brannan McGill
Hardware/Software Support and Programming
Tim Alberta (IT Manager)
James Hamm
Ken
Kim
Mark Mulholland
Dan Riter
Carl Whitehurst
Malte Winkler
Instructional Design
Patrick Parrish (Production Manager)
Dr. Alan Bol
Lon
Goldstein
Dr. Vickie Johnson
Bruce Muller
Dwight Owens (Alphapure Design Studio)
Marianne Weingroff
Meteorologists
Dr. Greg Byrd (Project Cluster Manager)
Wendy Schreiber-Abshire (Project
Cluster Manager)
Dr. William Bua
Patrick Dills
Dr. Stephen Jascourt
Matthew Kelsch
Dolores Kiessling
Dr. Arlene Laing
Dr. Elizabeth Mulvihill Page
Warren Rodie
Amy
Stevermer
Dr. Doug Wesley
Science Writer
Jennifer Frazer
Spanish Translations
David Russi
NOAA/National Weather Service - Forecast Decision Training Branch
Anthony Mostek (Branch
Chief)
Dr. Richard Koehler (Hydrology Training Lead)
Brian Motta (IFPS Training)
Dr. Robert
Rozumalski (SOO Science and Training Resource [SOO/STRC] Coordinator)
Ross Van Til (Meteorologist)
Shannon White (AWIPS Training)
Meteorological Service of Canada Visiting Meteorologists
Phil Chadwick
James Cummine