Introduction
The purpose of this module is to help surface transportation decision makers to:
- Make better use of services and products available from the National Oceanic & Atmospheric Administration’s (NOAA’s) National Weather Service (NWS)
- Interpret weather data
- Discuss their concerns with meteorologists, and
- Ultimately make better weather-related decisions for surface transportation.
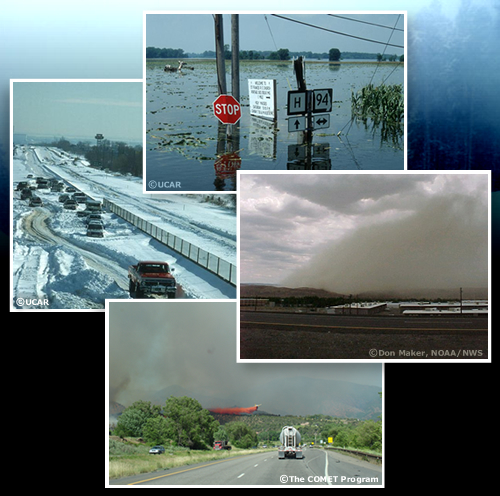
We’ll start by talking about some basic meteorological concepts that explain how weather occurs. In Section 3, we’ll discuss how the NWS and other meteorologists produce weather forecasts and what causes uncertainties or errors in those predictions. Section 4 covers NWS forecast products and resources that can help your decision process. Section 5 teaches some basics in interpreting observational data from various sources, such as weather satellites and weather radar. The 6th section describes weather hazards that impact transportation management and the NWS products that specifically address those events. The module ends with a brief summary.
Meteorology 101
The purpose of this section is not to turn you into a forecaster. However, if you understand some basic meteorological concepts, you will have better insight into what makes weather and how forecasters predict it. You will communicate more effectively with your local NWS contacts and private forecast contractors, and you will better understand how to interpret their products. This will help you anticipate changing weather conditions so that you can make better traffic and road management decisions during hazardous weather.
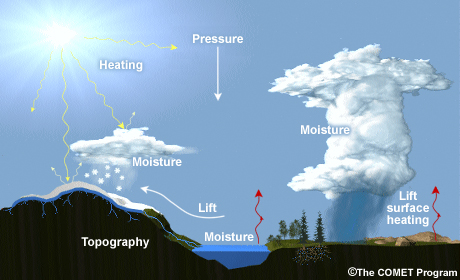
To begin, the first thing to understand is that weather is the result of several factors, including:
- Heating by the sun
- Atmospheric pressure
- Moisture
- Topography
- Lift
We’ll discuss each of these factors in this section and then talk a little about regional and local weather. We’ll also mention some large-scale phenomena, such as El Niño, that are often in the news.
Meteorology 101 » Heating by the Sun
Weather is largely due to the sun heating areas of the planet unequally. This uneven pattern occurs primarily because:
1. The sun's radiation reaches only half the planet at any one time—resulting in cool nights and warmer days
2. The amount of radiation reaching the surface varies at different places — for example, the equator is warmer than the poles, cloudy areas are cooler than clear areas
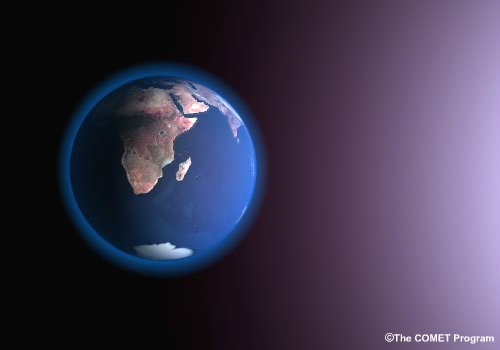
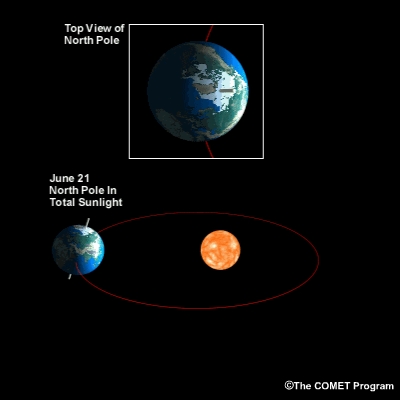
3. The planet tilts as it revolves around the sun, causing the seasons
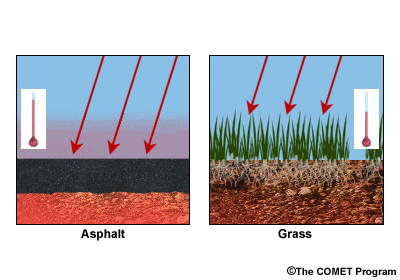
These temperature differences also occur on a more local scale. For example, the temperature over a black asphalt road is different from that over the adjacent grassy roadside.
The circulation of the atmosphere is essentially an attempt to equalize these temperature differences. The result is meandering "streams" of air flowing around the planet, carrying heat and moisture to or from different parts of the globe, ultimately affecting the weather in your location.
Meteorology 101 » Heating by the Sun » Air Masses
If a body of air moves slowly or stays over a large area that has fairly uniform surface topography, temperature, and moisture characteristics, the air gradually takes on those characteristics and is called an " air mass." Four main types of air masses affect U.S. weather:
- Continental polar (cold, dry)—originates in Canada or Alaska. These are responsible for cold outbreaks and often blizzards in winter.
- Maritime polar (cool, moist)—originates over cool waters of the Pacific and Atlantic Oceans and can play a role in the strength of weather systems.
- Continental tropical (hot, dry)—originates over the desert southwest and the intermountain region.
- Maritime tropical (hot, moist)—originates over tropical or subtropical waters. Maritime tropical flow is often accompanied by coastal showers and occasionally tropical cyclones. This air mass is the primary contributor of moisture for severe thunderstorms and muggy conditions over the eastern half of the U.S. during the summer.
Meteorology 101 » Heating by the Sun » Fronts
As air masses move out of their origination area, they come in contact with other air masses with different characteristics. The boundaries between different air masses are called fronts. Across a front (which extends vertically as well as horizontally), temperature, humidity, pressure, and/or wind often change rapidly over short distances.
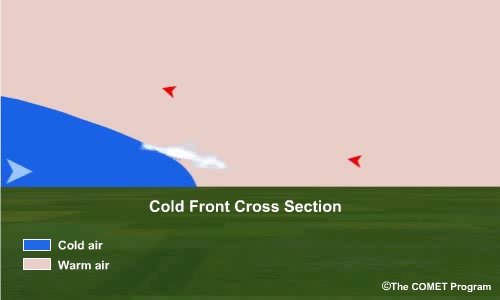
A cold front is the leading edge of an advancing cold air mass. At the surface, these fronts mark where colder air lifts and replaces a warmer air mass. This happens because the colder air is denser than the warm air. During the summer, cold fronts often initiate thunderstorms and related severe weather (such as hail, high winds, and tornadoes). In colder seasons, they can produce hazardous winter conditions such as snow squalls and blizzards.
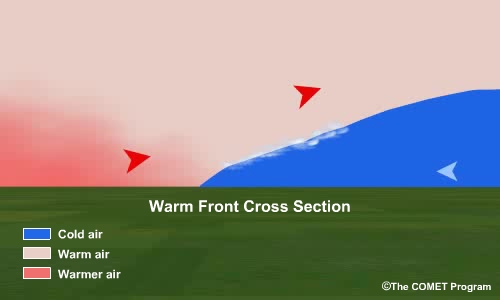
The leading edge of an advancing warm air mass is a warm front. At the frontal boundary, warmer air overtakes and replaces colder air. In this case, the lighter, less dense warm air rides up over the colder, denser air. Warm fronts generally bring light or moderate, but steady and more widespread precipitation compared to cold fronts. Warm fronts are seldom as distinct on the surface as cold fronts, and they usually move more slowly. However, in cases where the warm front separates warm and cool air masses with strong temperature or humidity contrasts, thunderstorms can develop in the warm, moist air.
Warm and cold fronts are a transition zone between two different air masses with different densities and temperatures. The atmosphere tries to balance these differences, which can cause a wave-like bend to form on the front. The wave in this frontal boundary is usually caused by what meteorologists call an "upper air disturbance" or low pressure system at higher elevations, spreading its influence to the surface.
In the first image in the animation, the wave begins as a stationary front (the combined red and blue line). Stationary fronts occur when neither air mass is replacing the other. These are often associated with long-lasting precipitation. In the warm season, the stationary front can act as a path for successive thunderstorms to follow. These thunderstorms are often triggered by the upper air disturbance. Since many thunderstorms repeatedly travel over the same area, excessive rainfall may result in flooding near the vicinity of the stationary front.
If the upper air disturbance is strong enough, the wave continues to bend and a cyclonic (counterclockwise) circulation will develop (image 2). One section of the front begins to move as a warm (red) front, while the other section moves as a cold (blue) front (image 3). The pressure at the peak of the frontal wave falls, and a low-pressure system forms (image 4). As the cyclonic circulation becomes stronger, the surface winds can propel the fronts, with the cold front moving faster than the warm front, eventually forming an occluded (purple) front (images 5-7). An occluded front is one in which the cold front has caught up with the warm front. Typically, an occluded front produces cloudy skies accompanied by light rain or light snow.
Occluded fronts generally occur with mature low pressure systems. Once the circulation has sufficiently mixed the air masses, the energy used to maintain the low pressure circulation diminishes. When this occurs, the circulations and associated precipitation gradually diminish over a one- to several-day period.
Meteorology 101 » Pressure
The earth's atmosphere is made up of a number of gases, including water vapor—the most important element as far as weather is concerned. These gases are composed of molecules that have weight. When we talk about atmospheric pressure, we are really talking about the weight of all those molecules in a vertical column at a given location. As shown in the figure, atmospheric pressure decreases with height. This is because, as one goes higher in the atmosphere, there are fewer molecules in the column above.
At sea level, the average force exerted by all the molecules in a column of air from the surface up to the top of the atmosphere (about 30 miles) is approximately 29.92 inches of mercury or 1013.25 millibars (mb), the most common measure of pressure used by meteorologists. This equates to about 14.7 pounds per square inch.
However, pressure can vary considerably from this average. For example, the sea-level pressure in hurricanes can drop below 900 mb (26.58 inches of mercury), while the highest pressure ever recorded in the U.S. was 1078.4 mb (31.84 inches of mercury) in Northway, Alaska.
The temperature differences discussed earlier also cause pressure differences in the atmosphere. For example, the air at the poles is cold and dense, while near the equator it is warmer and lighter. The same processes that try to equalize temperature differences over the globe also try to balance the pressure differences between denser and lighter air. This creates winds that blow from areas with higher pressure to those with lower pressure.
When the pressure changes rapidly between two areas, we say that there is a "tight pressure gradient." In general, the tighter the pressure gradient, the stronger the winds. The tight pressure gradient can be seen on weather maps as closely spaced parallel pressure lines (called "isobars") around storms or behind strong cold fronts. Hurricanes are an extreme example of low pressure systems with tight gradients.
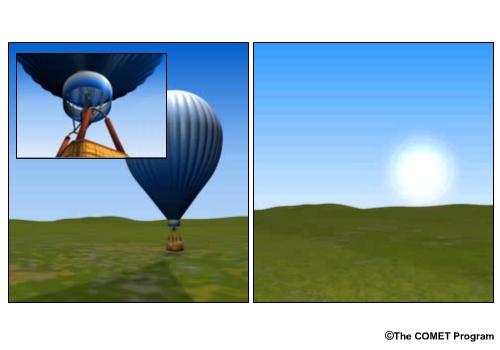
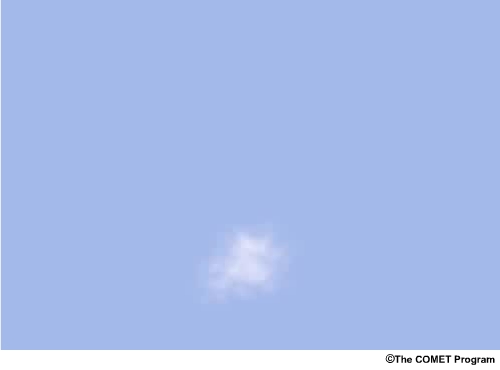
Air density differences also relate to vertical motions in the atmosphere. This principle is illustrated in hot air ballooning—adding heat (lowering the density) makes the balloon lighter than air and allows it to rise. The greater the difference between the temperature inside the balloon and that outside it, the greater the density difference and the faster the balloon rises. Similarly, heating at the surface can cause air to rise. Depending on its environment and the available moisture, the rising air can condense and form clouds that might grow into thunderstorms.
Meteorology 101 » Pressure » Highs and Lows
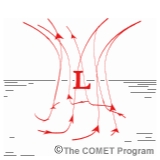
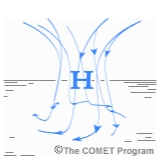
You are probably already familiar with highs (H, blue) and lows (L, red) shown on TV weather maps. These are areas with maximum or minimum pressures relative to their surroundings.
This table provides comparisons between low pressure and high pressure systems:
| Lows | Highs |
|---|---|
| Center of pressure surrounded on all sides by higher pressure | Center of pressure surrounded on all sides by lower pressure |
| Also called a cyclone | Also called an anticyclone |
|
Air moves counterclockwise (cyclonically) around the center (in the Northern Hemisphere)
|
Air moves clockwise (anticyclonically) around the center (in the Northern Hemisphere)
|
| Area of rising air | Area of sinking air |
| Often produces cloudy skies and precipitation | Often suppresses clouds and precipitation |
Weather forecasters watch the movement of highs and lows and changes in pressure, moisture, and temperature as indicators of future weather development. To further complicate matters, they also have to track these variables above the surface.
Meteorology 101 » Moisture
While water vapor is not the most abundant gas in the atmosphere, it is the fuel that drives the weather. When water vapor changes into liquid droplets or ice crystals, heat energy is released. That energy feeds weather systems such as thunderstorms and hurricanes.
Most of the water vapor in the atmosphere evaporates from the oceans. The main sources of moisture for the U.S. are shown in the figure. However, local sources such as lakes and streams, evaporation from the ground, and evapotranspiration from plants and trees can also influence local weather.
Meteorology 101 » Moisture » Humidity
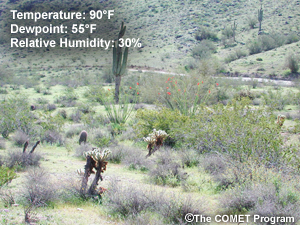
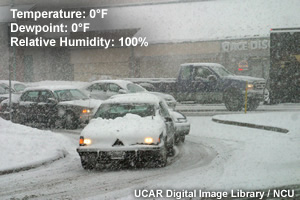
Most weather broadcasts talk about moisture in the atmosphere in terms of either "relative humidity" or "dewpoint." Relative humidity is a ratio of the amount of water vapor actually present divided by the amount required to saturate the air at the same temperature. When the air is saturated, we say the relative humidity is 100%. This number does not, however, indicate the total moisture in the air. For example, the relative humidity may be 100% on a cold, snowy day in Iowa and only 30% in the Arizona desert, but the total moisture content might be higher in the desert because its warmer atmosphere can hold more water vapor without becoming saturated.
The dewpoint temperature is simply the temperature that the air would have to be cooled to in order for saturation (100% relative humidity) to occur. It is often evidenced by dew formation. The dewpoint temperature is expressed in degrees just like air temperature. So, the closer the dewpoint temperature and air temperature are, the closer the air is to saturation.
Both the dewpoint temperature and the relative humidity are used routinely in surface transportation forecasting. Here are a few examples:
- If the temperature of a bridge deck is below freezing and the dewpoint temperature is forecast to be just above the temperature of the deck, then under mostly clear skies and light wind conditions, bridge frost may form.
- Relative humidity can also be used effectively to estimate the amount of evaporation that would occur on a road after a rain or snowstorm. Significant pavement drying can occur when the relative humidity (and the dewpoint temperature) drops after a precipitation system moves on. Conversely, if the relative humidity remains high after the storm's passage, road surfaces will dry more slowly.
- Winds blowing drier air over wet pavement can also aid in evaporation.
- With light winds and high humidity after a snowstorm, wet roads may turn icy.
Meteorology 101 » Moisture » Precipitation
When the air is saturated, it cannot hold any more water vapor, and the moisture condenses onto small particles such as sea salt, dust, or tiny pieces from fires or pollution. These particles are called condensation nuclei. Water vapor is attracted to these particles and creates the liquid droplets and ice crystals that make up clouds. Precipitation occurs when the droplets or crystals grow too heavy to be kept aloft by updrafts or rising air.
We'll discuss precipitation in its various forms in more detail in the "Weather Hazards" section.
Meteorology 101 » Topography
The topography of the planet—mountains and valleys, oceans and other bodies of water, deserts, and even urban areas—greatly influences weather.
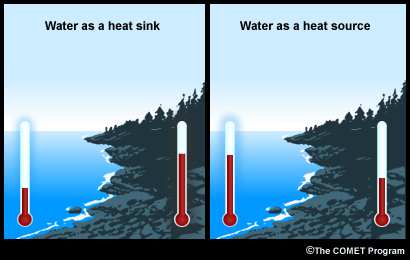
For example, large bodies of water can act as a heat source or sink, warming or cooling more slowly than land features. Water temperatures in oceans or large lakes remain cooler than the land well into the spring. However, once the water temperatures warm, the water holds the heat much more efficiently than the land. The temperature contrast between the water and land can create or affect local weather.
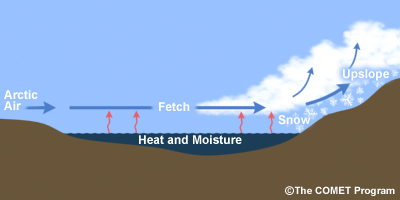
The regions near the Great Lakes are a perfect example of how bodies of water greatly affect regions downstream. During autumn or early winter, arctic air flowing over the relatively warm Great Lakes often produce intense snow squalls in places like Buffalo, NY. Later in the winter when the water temperatures cool, the lakes may become ice-covered. This diminishes the moisture available and potentially reduces the intensity of the snow squalls. Transportation agencies use this kind of information to assist in snow mitigation strategies.
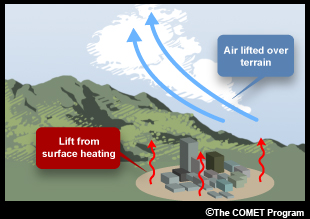
Variations in the land surface influence weather in many important ways.
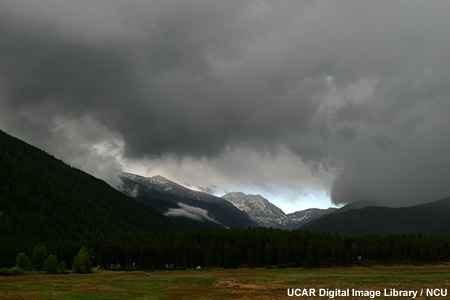
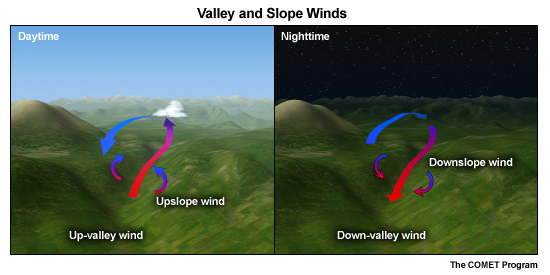
For example, differential heating of mountain slopes can cause local winds or can provide lift to initiate thunderstorms. Mountain ranges also affect the distribution of moisture. Prevailing winds blowing from the ocean toward high terrain (as is the case in the Pacific Northwest, for example) produce a "rain shadow" effect where the slopes facing the prevailing winds (the windward side) receive much more rain or snow than on the leeward side.
As another example, gaps between mountains can funnel wind, intensifying its effect under certain conditions. This could lead to trucks being blown over or blowing snow causing a multi-vehicle accident.
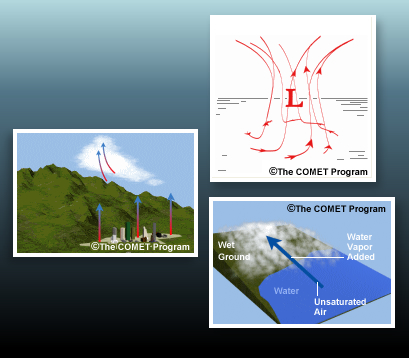
Meteorology 101 » Lift
As one moves higher in the atmosphere, the temperature decreases. This effect is well known if you travel from low elevations into the cooler mountains. Similarly, when air rises, it also cools. And if the air holds enough water vapor, it can cool to where the dewpoint temperature equals the air temperature and becomes saturated. The water vapor then condenses and forms clouds.
There are many ways that air can be lifted. As mentioned before:
- Heating from the sun can cause thermals of less dense air to rise, similar to a hot air balloon rising.
- Air rises in areas of low pressure
- Fronts can act like a wedge to lift air
In addition:
- Air can be forced up when the flow is blocked by topography, such as a mountain range
- Upper air disturbances in the jet stream can create conditions that force air to rise
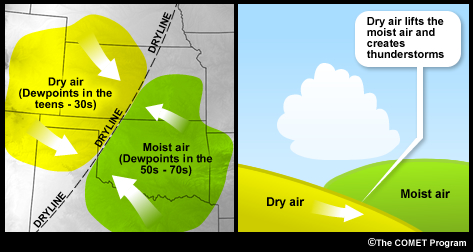
- A "dryline" (which is a boundary that separates dry, dense air and moist, lighter air) can also act like a wedge, pushing the moist air up. Drylines are most often experienced in the central and southern Great Plains and can initiate severe thunderstorms.
Along with lift, meteorologists also need to consider whether the temperature structure of the atmosphere is "stable" or "unstable."
A stable atmosphere suppresses vertical motions, while an unstable atmosphere will enhance them, if some lifting mechanism is already present. Typically, regions of low pressure or areas near fronts are unstable and can promote storminess. However, even in areas of high pressure, it is common for thermals from the heated ground, combined with high dewpoints, to produce areas of localized instability in the afternoon. These locally unstable regions often experience isolated afternoon or evening thunderstorms. Some call these 'popcorn" storms, "pop-up" thunderstorms, or "air mass" thunderstorms because they are not the result of lift from a low pressure system or front.
Meteorology 101 » Mesoscale Meteorology
The highs, lows, and fronts marked on a weather map represent relatively large-scale features. Meteorologists call this, "synoptic-scale" features, which refers to weather systems that cover one or more states. However, changes in pressure, temperature, and moisture also occur on smaller scales. With the use of Doppler radar and other tools, meteorologists are now better able to observe and predict weather on a smaller scale, referred to as the "mesoscale." Mesoscale systems are the reason why one town might have heavy snowfall while its closest neighbor has only light snow. Or dense fog may occur over a few miles on a road, followed by perfectly clear conditions.
| Synoptic Meteorology | Mesoscale Meteorology |
|---|---|
|
|
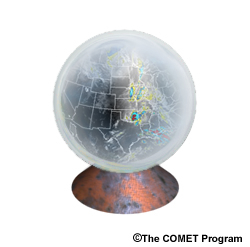
Topography plays an especially important role in mesoscale weather processes. For example, sunward facing mountain slopes warm during the day, creating a difference in heating between the sunward and shady slopes If the air rising over the warmer slopes cools to its dewpoint temperature, water vapor will condense into clouds. In the evening, the air adjacent to the slopes cools faster than the air at the same level over the valley floor, and the colder, denser air then flows down the slope into the valley.
The mesoscale variation of moisture is also important.
For example, the Hudson River can provide enough moisture to produce fog in the valley under certain conditions. In this satellite image, you can see the fog in the Hudson Valley burning off as the sun comes up. You can also see widespread coastal fog.
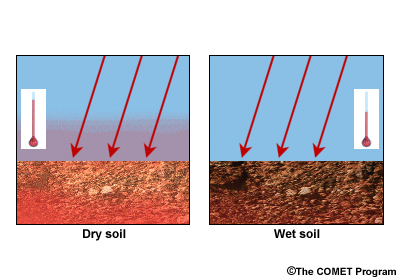
Much smaller sources of moisture can also affect the weather. For example, moisture that has soaked into the soil from thunderstorms on one day can evaporate the next and provide fuel for new storms. Some of the sun's heat goes into evaporating the soil moisture before raising the ground temperature. The air over the moist ground warms more slowly and is relatively cooler (more stable) than the air over the neighboring dry ground, which heats more quickly. This boundary between warm and cool areas and moist and dry areas acts like a mini-front, providing enhanced lift for storm development.
Meteorology 101 » Global Patterns
We've talked about regional (synoptic scale) and local (mesoscale) weather, but let's take a brief look at the bigger picture. The oceans have a large influence on the atmosphere, and the atmosphere's response can have impacts across the globe and on time scales of months to years. While there are several of these large-scale interactions, we'll take a look at two that are often in the news: El Niño and its counterpart, La Niña. Keep in mind that these large-scale patterns don't cause individual weather systems to be stronger (i.e., they don't directly affect today's weather), but they do influence seasonal weather, particularly in winter.
El Niño episodes are characterized by unusually warm ocean surface temperatures in the equatorial Pacific. In contrast, La Niñas have unusually cold ocean surface temperatures in the same areas. Many locations experience significantly different weather conditions depending on whether an El Niño or a La Niña is occurring. Both El Niño and La Niña tend to have the most significant impacts during the cool season or winter months, but no two El Niños or La Niñas are exactly alike. This is because the particular ocean area and degree of ocean warming influences where and how the season's weather may be impacted.
El Niños tend to bring frequent storm systems across the southern U.S., resulting in cloudier, wetter, and cooler-than-average conditions across that area. The storms also tend to bring strong winds and heavy rain to the California coast, which can cause flooding, mudslides, and damage to coastal roads. In contrast, the Great Lakes and Ohio Valley regions typically see fewer storm systems and thus drier-than-normal weather. The polar jet stream (a band of strong winds in the upper atmosphere, shown in purple) tends to remain in Canada for much of the winter. This prevents the normal intrusions of arctic air, so the northern U.S. and parts of Canada tend to be warmer than normal.
During a La Niña winter, the jet stream's position, and subsequent track for storms systems, is much more variable. This generally brings different weather than the El Niño. With northward-shifted jet streams, the southern U.S. experiences fewer storm systems and thus tends to be drier than normal. Much of the U.S. is impacted by Pacific air masses, which tend to be milder than continental air masses from the arctic regions. Because weather systems track further north, above-normal rains are more common in areas such as the Pacific Northwest, Great Lakes, and Ohio Valley. When the polar jet stream steers north into Alaska and then dips into the Great Lakes, the northern sections of the U.S. experience colder-than-normal weather.
These large-scale patterns occur about every 3 to 5 years. El Niños and La Niñas typically last 9-12 months, begin in summer, and peak in winter. Some El Niños and La Niñas have lasted for several years. In some years, neither one occurs.
Meteorology 101 » Summary
The relationships among pressure, temperature, moisture, topography, and lifting mechanisms are very complex, and it is difficult to make generalizations. For example, high pressure systems are usually associated with good weather. However, along the eastern slopes of the Rocky Mountains, a high located in just the right place can cause heavy precipitation if temperature and moisture conditions are right and coincide with wind directions that force the air up the mountain slopes. Similarly, although cold fronts often trigger severe thunderstorms, warm fronts can also generate these storms if the atmosphere is very unstable. And while El Niños may, on the average, cause certain conditions in your area, some years they may bring the opposite patterns.
Meteorology 101 » Questions
Question 1
Match the weather feature with the characteristics that best describe it.
See correct answers above.
Question 2
Low pressure systems _____ . (Select all answers that apply.)
The correct answers are b and c.
Low pressure systems typically (but not always) produce cloudy and wet weather and are surrounded by higher pressure. The air in a low moves upward in a counterclockwise (cyclonic) motion. Highs, on the other hand, are surrounded by lower pressure, circulate clockwise (anticyclonically), and are areas of sinking air.
Question 3
If the air temperature is 54° and fog is covering a road in a valley, what is the approximate relative humidity? (Choose the best answer.)
The correct answer is d.
The presence of fog indicates that the air is saturated, so the relative humidity is approximately 100%, and the dewpoint temperature is near 54°.
Question 4
On a clear night when a bridge deck temperature is a little below freezing, what might you expect if the dewpoint temperature rises a little above freezing? (Choose the best answer.)
The correct answer is b.
If the bridge deck temperature is below freezing, the moisture will likely cool enough to form frost on the deck surface rather than dew.
Weather Forecasting
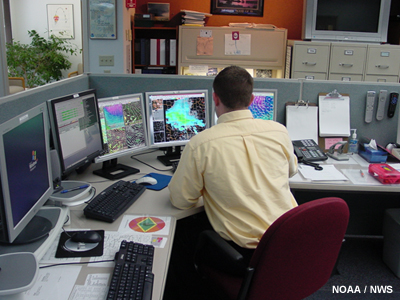
Weather forecasting is both science and art. A lot of science goes into the use of weather observations and in the mathematical models that predict how the atmosphere will change. Meteorologists apply their scientific understanding and reasoning to interpret this information. However, there is also an element of art in the forecast in the sense that experiences in observing, predicting, and living in various weather regimes also contribute to the forecaster's decision process.
Over the past 20 years, forecast accuracy has increased significantly due to:
- Improvements in computer weather models
- New, improved instruments (such as satellites and radar) for observing the atmosphere
- Better education and training of forecasters
Despite these advances, there are still many areas that require more research, especially for providing accurate forecasting at the road-scale. Mathematically modeling the interactions that occur near the earth's surface is a considerable challenge. For example, the computer models that run fast enough for forecasters to use cannot model the differences in heat between roads and grassy areas or how small terrain features and urban areas divert air flow. Research models are addressing some of these issues, but it will be some time before the results can be applied in a practical and timely manner for forecasts.
Consequently, forecasters cannot always precisely predict the location, onset and ending times, or intensity of various weather events. Understanding what the professionals can and can't do will help you interpret the information that goes into your decisions.
Weather Forecasting » Why It's Difficult
It is frustrating when forecasts are wrong, but this problem isn't peculiar to meteorology. For example, you probably can say what you're going to be doing an hour from now with considerable certainty, although something unforeseen might change your plans. It is more difficult to predict farther in the future. You may be fairly sure that at 7:30 AM two weeks from now you will be traveling to work. But there are a lot of things that may intervene to ruin your forecast—for example, getting a flat tire or winning the lottery.
It's the same with weather forecasts. Short-term forecasts are generally quite good, while the farther out in time, the forecast becomes less reliable.
Two main problems contribute to imperfect forecasts:
- Problems with observations, including erroneous, conflicting, or insufficient data, and
- Scientific limitations to our understanding of the atmosphere and our ability to represent what we know mathematically in computer models, as well as limitations in computer processing power
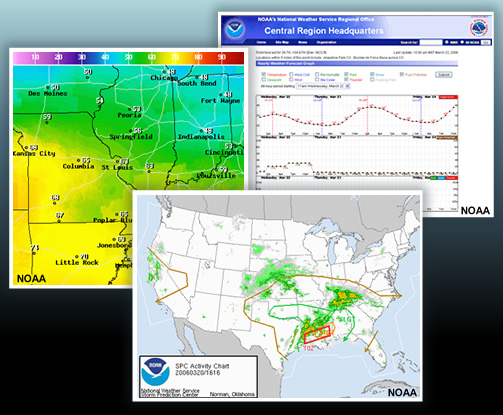
Weather Forecasting » Predicting Weather
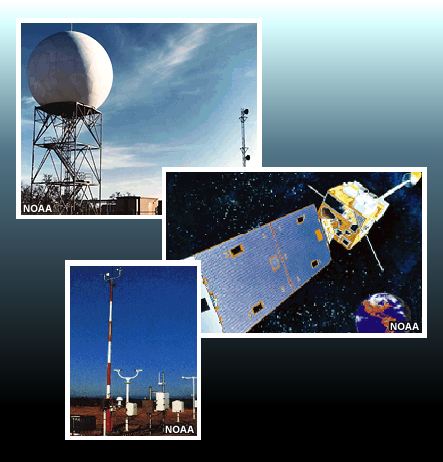
Physical processes and parameters that must be accounted for in weather prediction models are labeling the the image below:
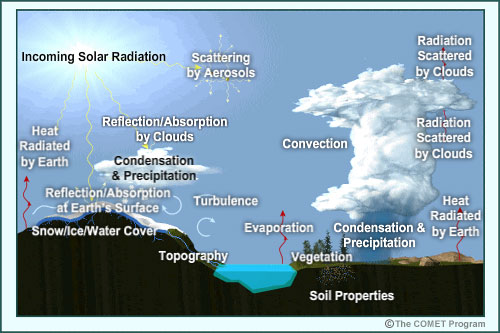
As we've discussed, weather is a product of innumerable complex interactions that occur on a wide range of scales, ranging from global to molecular. We observe certain pieces of these processes with tools such as radars, satellites, and surface measuring stations. These observations are fed into computer models that approximate many atmospheric processes using the latest scientific theories. Forecasters take the model results and observations and apply their own knowledge and mental concepts of atmospheric behavior to generate the forecast products that tell you whether to expect clear weather or something that can seriously affect highway safety and mobility.
Radar
Satellite
Automated Surface Observing System (ASOS)
Improvements in forecasting are taking place all the time. Our understanding of the ocean/atmosphere system is advancing, computers are getting faster, and new observational tools are being developed and deployed. However, the inherent complexity of the atmosphere means that you will always have to deal with some uncertainty.
Weather Forecasting » Different Forecast Sources
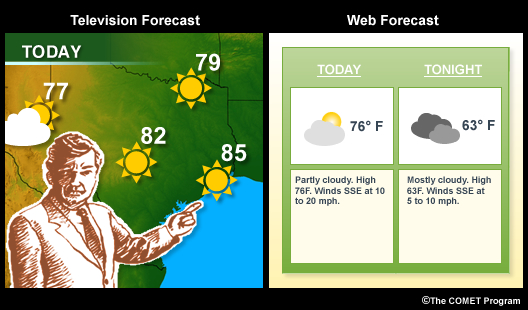
Most of the data available to all weather forecasters comes from the NWS. Increasingly however, universities and private companies are using their own radars or running their own computer models. The end result can be different forecasts from different sources. That would often be true even if all forecasters used the same data, because no two forecasters interpret the data in exactly the same way.
Also, the NWS uses several different computer models, which often do not agree completely. This is because they may use different data or simulate atmospheric processes differently. Forecasters usually pick which model they think is the best for a particular time or combine the results from several models. Generally, models (and forecasters) are more accurate earlier in the forecast period compared with several days in the future.
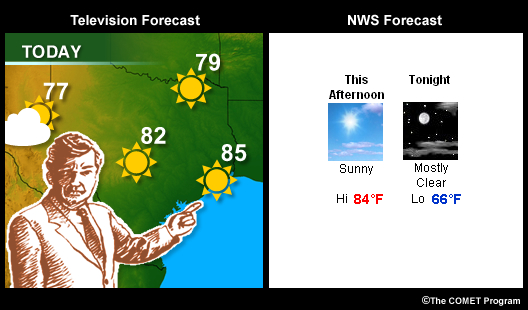
When forecasts from TV, private consulting, and NWS sources agree, it's often because the weather scenario is relatively simple. Most large, strong weather systems are usually forecast similarly by all computer models and forecasters, and thus provide a measure of reliability. But keep in mind, it may take several days (within 24 to 48 hours of storm onset sometimes) before the computer models and all forecast sources come to agreement with a high level of confidence regarding the expected outcome. Weak weather systems (such as light snow events) can pose the biggest challenges. These systems are often predicted differently by different computer models, and you'll likely see differences in the forecast based on which model or blend of models a forecaster has decided is the most reliable. This assessment can change daily or even more often as new data becomes available.
One thing is consistent. During very hazardous weather, only the NWS issues official U.S. government watches or warnings, and all weather sources will carry that information. However, you will often see differences in the detail of the forecasts from different sources such as precipitation totals, start and end times of the event, or where and when a change of precipitation type may take place.
Weather Forecasting » Dealing with Uncertainty
|
THE MODELS VARY WITH THE STRENGTH OF THE TROUGHS. ONE MODEL FAVORS A DEEPER SOLUTION BRINGING RAIN TO NORTHERN CALIFORNIA LATE TUESDAY. THE OTHER MODEL IS SHALLOWER AND KEEPS PRECIP JUST NORTH OF THE BAY AREA. WILL LEAVE PRECIPITATION OUT OF THE FORECAST FOR THE WEEKEND AS THE MODELS CONTINUE TO BOUNCE AROUND. NOAA/NWS |
Example of an Area Forecast Discussion describing differences in two NWS models
When faced with contradictory information, meteorologists will look at many data sources to evaluate the most likely future outcome. For example, they may review data from several different models and choose one that they think is handling the situation best, or they may adjust model results before releasing their forecast.
Similarly, you may want to combine data and forecasts from various sources such as private companies, TV broadcasts, and the NWS. By regularly monitoring different sources and evaluating how well they are doing, you can get a feel for whether one forecast source is more accurate in this particular situation. Keep in mind, however, that one source may be right with today's forecast but wrong tomorrow, so you need to re-evaluate your level of trust in each source for each weather event.
Remember, a forecast is a prediction, not a guarantee. Given that fact, your best course is to:
- Keep up-to-date on current and forecasted conditions and how they are changing in time
- Compare multiple sources of information
- Evaluate the probability of a worst-case scenario developing
- Prepare to take appropriate action if the situation turns in that direction
Weather Forecasting » Questions
Question 1
Which of the following statements are true? (Select all that apply.)
The correct answers are a, c and d.
Forecasts tend to be less accurate farther out in time and they are also less accurate if the observations going into them have errors (a and d: true). While current forecast models can predict weather at smaller scales than they could 10 or 20 years ago, they can't yet provide forecasts at scales at the size of individual roads (b: false). And if you hear that a watch or warning has been issued, you know that information came from the NWS (c: true).
Question 2
True or False: Monitoring forecasts and observations over a period of time will give you a sense of which forecast source has the best predictions for the current weather event.
The correct answer is True.
If a particular forecast source has been able to more accurately predict conditions in the short-term, you might have higher confidence in their long-range predictions. Looking at various sources for some length of time will help you determine which forecasts sources currently have the best handle on the situation.
NWS Products Overview
There are many different NWS forecast products, including ones that cover the national picture and those that focus on the local situation. These are available in many different formats including graphics, tables, text, and point-and-click maps. In addition to weather data, the NWS also provides information on floods, climate, and air quality.
We're going to look at some of the NWS products available on the Web. Keep in mind as you're going through this section that the information provided here reflects how the websites looked at the time this module was published. The NWS frequently improves these websites, and there may be variations among the different forecast offices' sites. You may have to search for the information that will be most helpful to you. If you have any questions, your local NWS forecast office can answer them.
Before we look at some of the NWS products, let's define some important terms.
Additional Resources:
https://www.weather.gov/organization/
NWS Products Overview » Definitions
Examples:
Hazardous Weather
Outlook | Dense
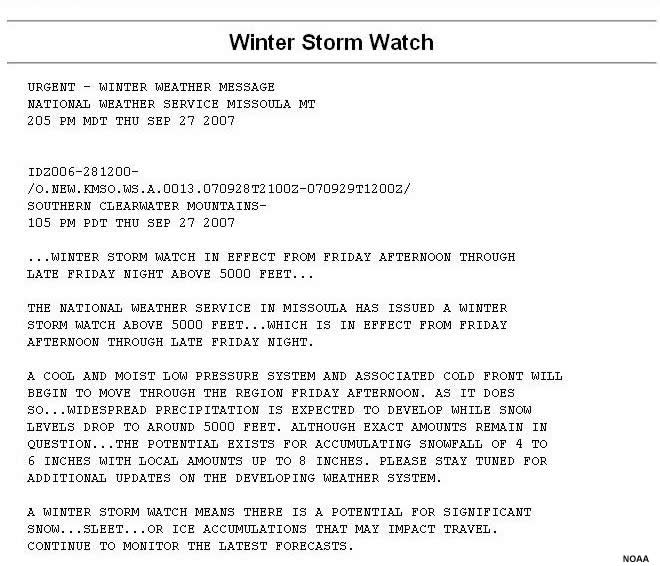
Fog Advisory | Winter Storm Watch | Winter Storm Warning
Hazardous Weather Outlooks are issued every day by local NWS weather forecast offices (WFOs). These outlooks describe the potential for any type of hazardous weather in the next seven days. More specific detail on the types, timing, and coverage of hazards are provided for events expected within 48 hours.
Advisories refer to events that are occurring or imminent and that can cause significant inconvenience. Furthermore, these types of events could, if caution is not taken, lead to situations that threaten life and/or property.
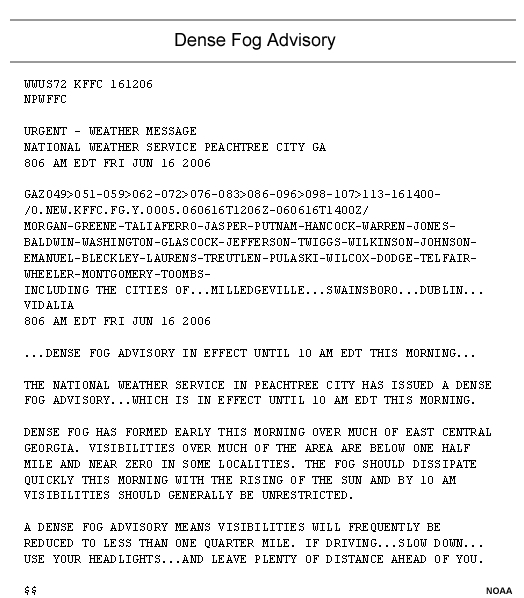
For example, a "Flood Advisory" might be issued for minor flooding in intersections or lowlands. Other advisories that pertain directly to surface transportation include:
- Dense Fog Advisory (widespread visibility below a quarter mile)
- Winter Weather Advisory (snow or mixed wintry precipitation below warning criteria)
- Snow Advisory (snow with accumulations below warning criteria)
- Wind Advisory (strong winds that could cause buffeting to cars or loss of control to high profile vehicles)
- Blowing Snow Advisory (strong wind causing drifting and reduced visibility)
- Blowing Dust, Blowing Sand, or Smoke Advisory (reducing visibility below a quarter mile)
- Frost Advisory (typically for agricultural concerns but also relevant to frost on roadways)
- Freezing Fog Advisory (important when dense fog creates frost on road surfaces)
- Heat Advisory (combination of high heat and humidity)
- Wind Chill Advisory (combination of cold temperatures and strong winds)
A Watch is issued when the risk of a hazardous weather or flood event has increased significantly, but its occurrence, location, and/or timing remains uncertain. Watches are issued up to 48 hours before the onset of hazardous weather.
Examples of NWS watches include:
- Severe Thunderstorm Watch
- Flash Flood Watch
- Winter Storm Watch
- High Wind Watch
- Tornado Watch
- Hurricane Watch
A Warning is issued when the forecaster is confident a hazardous weather event will occur in the near future. Warnings indicate that a weather or flood event that poses an immediate threat to life and/or property is occurring, imminent, or is highly likely to occur.
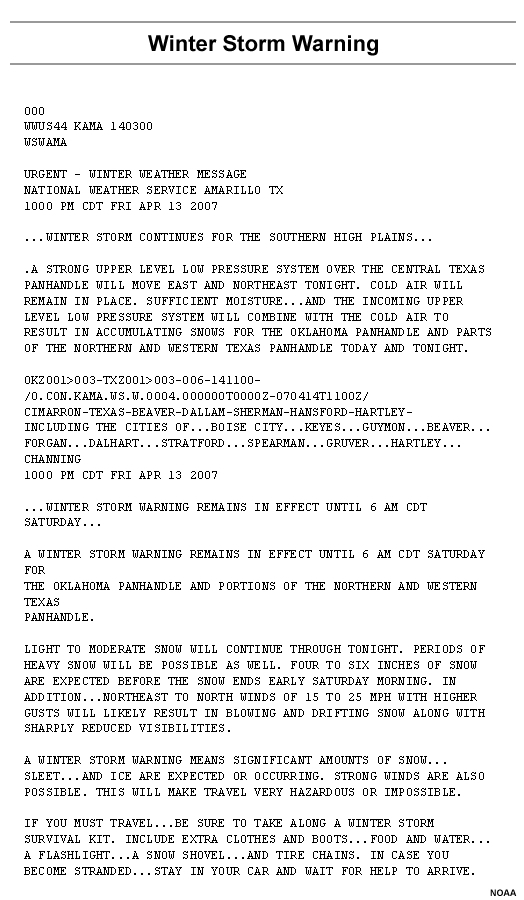
The different NWS WFOs set local warning and advisory criteria for various hazards like heavy snow, fog, high wind, etc. These criteria may be much different than what you consider hazardous for traffic. Talk to your local forecast office to determine what their criteria are for various weather events and how to best determine when conditions fit your criteria of hazardous weather.
In summary, NWS outlooks and watches precede advisories or warnings. The outlook gives the road manager several days of planning preparation for a significant event. The watch gives heightened awareness and confidence in the forecast and defines the time frame in which work schedules may be adjusted or resources prepared. By the advisory or warning stage, road crews have typically taken some type of pre-staging action or will already be actively addressing storm or flood-related problems.
NWS Products Overview » National Forecast Products
Additional Resources:
www.weather.gov
A one-stop Internet portal for NWS forecast products, maps, and data is available on the Web at www.weather.gov. Clicking tabs above the map will take you to various forecast products and observations. We'll discuss the observations available from this site in Section 5.

This first screen you see on the www.weather.gov site displays a graphic that color-codes current hazardous weather forecasts for the entire country. To see the information in more detail for a particular location, simply click on that area of the map, and the view will zoom in to the page prepared by that location's WFO. We'll talk more about the local graphical products later.
NWS Products Overview » National Forecast Products » Graphical Forecasts
Additional Resources:
www.weather.gov
https://www.weather.gov/organization/
Starting again at the www.weather.gov website, click the "Graphical Forecast" tab to go to graphics built from the National Digital Forecast Database. This page provides interactive forecast maps for various weather elements including temperature, precipitation, wind, and cloud cover.
Scroll down below the large map to find the maps for the other forecast elements. Placing your cursor over one of these maps will put it in the larger graphic window.
Also, clicking on a location on the map will take you to a regional depiction that has more interactive features. These forecasts are for every 3 hours with 5-km resolution, which translates to a data point about every 3 miles by 3 miles. This is not quite down to the road-level detail you would like, but it is getting better as models improve. Click the time period for the weather parameter of interest. By clicking the "+12Hrs" button you can get forecasts out to 7 days.
You can also click on this map to drill down to county-level data. Roll over the time period of interest to view the map in the screen.
NWS Products Overview » National Forecast Products » National Maps
Additional Resources:
www.weather.gov
The "National Maps" tab at www.weather.gov goes to a map that depicts the expected weather for the day. As before, you can click anywhere on this map to go to a more local forecast. Below this map are additional clickable weather maps that show the locations of highs, lows, fronts, and forecast precipitation.
NWS Products Overview » National Forecast Products » River Forecasts
Additional Resources:
www.weather.gov
The "Water" tab goes to a map that shows the current flood stage for all of the river gauges in the country. Note the key: green data points mean the river is below flood stage, yellow means it's near flood stage, and orange, red, and purple squares flag rivers above flood stage. Note that this graphic depicts river flooding, not flash floods. We'll say more about flood and flash flood guidance products (advisories, watches, and warnings) in Section 6.
Clicking on an individual square will bring up a local map. Squares indicate stations that have observations, while the circles denote stations that also have forecast information.
Clicking one of these will display a graph of the past hourly observations (blue line) and the forecast (dotted green line) of the river height at that location for the next several days. The different colors of the background represent various high water levels, with the orange, red, and purple backgrounds highlighting flood stages. In this particular example, recent rains resulted in minor flooding that is forecast to fall below flood stage on November 4th.
In addition to the river forecasts, you can also look at what impacts may occur as the result of particular river levels. Scrolling down the screen below the river forecast graph, you'll find a map displaying the location of the river gauge. To the left of the map is a list of record river crests. Below the map is a list of impacts when the river reaches a particular value. This example shows a historic crest of 16 feet and its impacts that occurred in April 1927.
NWS Products Overview » National Forecast Products » Other NWS Sites: Climate
Additional Resources:
NWS
Climate Prediction Center
The NWS Climate Prediction Center (CPC) (http://www.cpc.ncep.noaa.gov/products/OUTLOOKS_index.shtml) has a number of products that can give you temperature and precipitation forecasts ranging from 1 week in the future to 90 days. You can use the shorter range forecasts as a heads-up to what may be coming later in the week and the seasonal outlooks for long-range planning.
For example, if you click the link to "Monthly & Seasonal Outlook Maps," you can choose one of several maps that give 3-month outlooks for temperature and precipitation (scroll down).
Let's look at the Jan-Feb-Mar 2008 outlook for precipitation. This graphic shows the probabilities of above or below normal precipitation. "EC (or equal chances) indicates that the odds are equally likely for below normal, normal, or above normal conditions. "A" (the green area) means that precipitation is expected to be above normal, and "B" (the brown area) indicates below normal.
As mentioned earlier, there are similar maps for 90-day outlooks and for the 6-14 day forecast period. These products only provide guidance for temperature and precipitation trends against climatology, not specifics such as precipitation type, start time, or duration. Those shorter-range, more specific forecasts are the ones that we saw earlier on the weather.gov site.
Another handy graphic available from the CPC is the "U.S. Hazards Assessment" (http://www.cpc.ncep.noaa.gov/products/expert_assessment/threats.shtml), which provides a forecast of significant hazards in the coming two weeks.
We recommend that you explore the CPC website to find products that can meet your needs.
NWS Products Overview » National Forecast Products » Other NWS Sites: Hazardous Weather
Additional Resources:
Storm Prediction Center
http://www.spc.noaa.gov/
National Hurricane Center
http://www.nhc.noaa.gov/
NWS Weather Prediction Center (WPC)
https://www.wpc.ncep.noaa.gov/#page=ovw
WPC Winter Weather Forecasts
https://www.wpc.ncep.noaa.gov/wwd/winter_wx.shtml
WPC Winter Weather Impact Graphics
https://www.wpc.ncep.noaa.gov/wwd/impactgraphics/
The Storm Prediction Center's website (http://www.spc.noaa.gov/) provides more detailed information about hazardous weather, including convective tropical weather, flooding, winter weather, and non-precipitation events (such as high winds). This site provides a national perspective on outlooks, advisories, watches, and warnings.
The National Hurricane Center's website (http://www.nhc.noaa.gov/) provides tropical storm and hurricane information and forecasts. It also provides a great deal of information about hurricane preparedness.
BROKEN LINKS HERE
For more detail on the quantity of precipitation expected or potential for excessive rain that could cause flooding, you can go to the NWS Weather Prediction Center (WPC) website (https://www.wpc.ncep.noaa.gov/#page=ovw) or the website for your local NWS weather forecast office.
During the winter, another page on the WPC site (https://www.wpc.ncep.noaa.gov/wwd/winter_wx.shtml) provides graphics that can help you determine whether snow or freezing rain will be significant in the next three days. These products depict the probability (slight, moderate, high) of snow amounts exceeding 4, 8, or 12 inches and the probability of ice accumulations exceeding ¼ or ½ inch.
WPC is currently conducting an experiment in providing automated model probability graphics for winter weather events. These impact graphics (https://www.wpc.ncep.noaa.gov/wwd/impactgraphics/) show the likelihood of significantly reduced visibility from snow and/or fog or excessive snowfall rates, the likelihood of road accumulations, or any amount of freezing rain. Again, these products were only experimental at the time this training was developed.
NWS Products Overview » Local Forecast Products
Additional Resources:
http://www.weather.gov/organization.php
Local forecast offices have a staff of meteorologists whose job is to be familiar with local conditions and to add value to the national forecasts by tailoring them to their area. As shown before, you can get to local NWS forecasts by clicking the location of interest on any of the maps on the weather.gov site. You can also get to any office's Web page from this URL: http://www.weather.gov/organization.php.
These local forecast pages provide access to a wide variety of information, which can be displayed in many different ways. The NWS is constantly working on new products, and each WFO varies to some extent as to which ones are on their site. Some websites have experimental products that may not be found on other websites. And, as mentioned before, the websites do change fairly often, so you'll have to explore them to locate the information you need.
In the rest of this section, we're going to talk about several useful products that are on most WFOs' websites.
NWS Products Overview » Local Forecast Products » Local Web Pages
Let's take a look at the Denver/Boulder WFO's page as an example. The left-hand navigation frame will be similar in its major content areas—"Current Hazards," "Current Conditions," and "Forecasts." Additional links are provided to radar data, rivers, climate, and weather safety but these links may or may not be provided on other offices' pages.
The map on this page provides an overview of significant weather conditions. This is where such things as Watches and Warnings will be highlighted. Click on a location to go to a detailed 7-day forecast.
Scrolling down the page will take you to clickable radar and satellite images, as well as other maps.
Contact information for each local NWS office is provided at the lower left portion of each Web page.
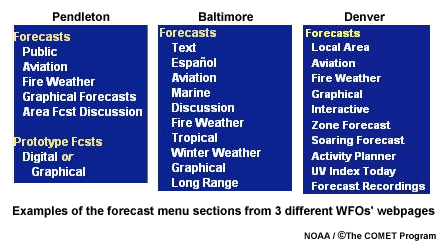
NWS Products Overview » Local Forecast Products » Forecasts
Different offices provide local forecasts in various forms, as you can see from these examples of the forecast section of the navigation bar from several offices' Web pages. Many of the links will go to text or tabular forecast products. Links that say "Graphical" usually go to the same forecast database used for the maps accessed from the Graphical Forecasts tab on www.weather.gov.
Not all of the WFOs have "Interactive" forecasts as does the Denver/Boulder site, but more offices may have this feature in the future. If you click this link, you have a choice of text forecasts, hourly weather graphs, or tables. And you can specifically choose which of eight parameters you want to look at. Once you've chosen these, click on the map to get the forecast for that particular location.
NWS Products Overview » Local Forecast Products » Area Forecast Discussions
Knowing what forecasters are thinking can also be important for your planning strategy. The "Area Forecast Discussion" (or just "Forecast Discussion") provides this kind of information. Some offices have the link to this product in the navigation bar. Others put it elsewhere, but every office produces one twice a day, usually before 3 AM and 3 PM local time. You may have to talk to someone at the office to get help locating it.
In this discussion, the NWS meteorologist will highlight his or her main weather concerns, describe what is expected to occur, discuss why particular weather forecast models are preferred over others, and list any watches or warnings that will be issued. While fairly technical, the discussion can give you a sense of the forecaster's confidence or uncertainties about the forecast. A relatively new feature is a glossary that provides definitions for certain words (in blue text). Just click on the word to bring up the definition box.
This has been just a brief overview of the large amounts of information available from the National Weather Service. Spend some time investigating the products available for your area, bookmark helpful pages, and contact your local NWS forecast office if you have questions.
NWS Products Overview » Questions
Question 1
Match the following forecast centers with the product each issues.
Question 2
Match the NWS forecast with its description.
Question 3
True or False: From the www.weather.gov website, you can access NWS warnings for Montana, temperature forecasts for Memphis, radar and satellite images, and flood stage information for the lower Mississippi River. (Choose the best answer.)
The correct answer is True.
All of the items listed (and much more!) are available from www.weather.gov; however, you'll have click on the national maps to get to progressively more local data.
Observations
While forecasts are critical to your planning process, sometimes you need to know what is happening now. You can access surface weather, satellite, radar, and other data from the NWS Web pages. Surface weather observations provide details about what's occurring near the ground. Satellite data give a broad, "bird's eye" perspective on weather systems as they evolve and move across the country. Radars track the evolution and motion of precipitation systems across an area. You can see how patterns move and change by looking at loops (time lapse images) of both satellite and radar data, which can help you infer what might happen in the near-future. All these observational data sources (and many more not listed) serve as part of the input to computer model forecasts.
In this section we'll look at observations in more detail and show how you can use these tools to help make decisions for road and resource management.
Observations » Surface Observations
Surface weather observations provide current and past data about winds, temperatures, precipitation, etc. Looking at the change in the observations over time gives an indication of where and how fast weather systems are moving. Observations also serve as a measure of how well a forecast is verifying. For example, if a forecast indicates that it's going to start snowing at your location at 3 PM, you could look at the precipitation reports for stations ahead of the weather system starting early in the morning. By timing the progress of the system, you can estimate when it will reach your area and confirm whether or not the forecast is too fast, too slow, or about right.
ASOS System
Official observations are taken by Automated Surface Observing Stations (ASOS), which collect a variety of data 24 hours a day, every day. Some of these stations are manually augmented with additional data. ASOS data elements are:
- Sky condition: Cloud height and amount (clear, scattered, broken, overcast) up to 12,000 feet
- Visibility (to at least 10 statute miles)
- Basic present weather information, such as the type and intensity of precipitation
- Precipitation accumulation
- Obstructions to vision, such as fog, haze
- Pressure
- Air temperature
- Dewpoint temperature
- Wind: Direction, speed and character (gusts, squalls)
- Selected significant remarks including: Variable cloud height, variable visibility, precipitation beginning/ending times, rapid pressure changes, pressure change tendency, wind shift, peak wind
Transportation agencies deploy roadside Environmental Sensor Stations (ESS) near roadways to measure atmospheric and pavement data. As of 2007, there were over 2,000 ESS around the U.S. Other systems, which may or may not be used by the NWS or available to transportation managers, include those maintained by the Environmental Protection Agency, state air pollution control agencies, TV stations, and even schools. The quality of data from these stations varies considerably.
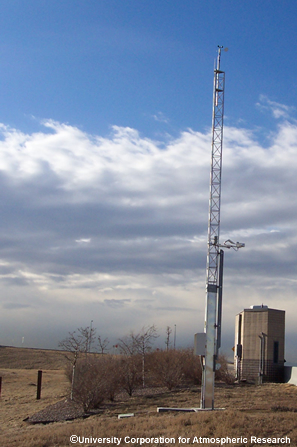
RWIS System
It is important to realize that only about 2,000 weather observations are taken around the country at official observing sites each hour. These observations are generally located at airports, which leaves the majority of the country without observations. Even if you add in the ESS system, this means that there are less than 4,500 observations to cover the 3.9 million mi (6.3 million km) of roads in the U.S. That's only one observation for every 978 mi (1,575 km) of road!
Observations » Surface Observations » Current Conditions
Additional Resources:
http://www.weather.gov/
Current weather conditions can be accessed from www.weather.gov by clicking "Surface Weather" under "Observations" in the left-hand menu. This goes to a page where you can choose your state and then to another page where you can choose a particular observing location.
From a local office Web page, you can either click on the map to go to a page that has both current and forecast conditions (see below), or you can look under Current Conditions (left-hand menu) for a link to either "current weather" or "observations" (different Web sites use different terms).
Observations » Satellite Data
Satellite data allows us to visualize entire weather systems and smaller features embedded within them from the vantage point of earth orbit. Looking at loops of the data over time provides information about the movement of weather features. You can access satellite data from the tab on the www.weather.gov site or from the Web pages for individual NWS forecast offices.

Observations » Satellite Data » Visible and Infrared Images
There are two main types of satellite images—visible and infrared. Visible satellite images use the sun's light for illumination and therefore are not available at night. These images look like black and white photographs. Clouds usually appear white, while land and water surfaces are in shades of gray.
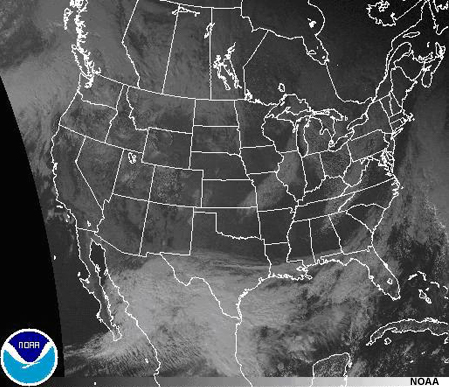
Visible Satellite Image
Infrared images do not use visible light and therefore are available both day and night. Instead, these images show the relative warmth of clouds and the earth. Colder objects are brighter, while warmer ones are darker. Infrared images can be black and white or colorized to bring out details in the cloud patterns. For example, the gray, yellow, blue, and red colors in this image indicate the temperature of the cloud tops. If the colors change over time from yellow to red or green, or the area that they cover expands, the weather system is intensifying and is increasingly likely to produce precipitation. Conversely, when cloud tops transition from red back to yellow or shrink in coverage, the weather system is probably weakening. Generally, the colored cloud features signify areas that are producing precipitation. However, this is not always the case, so you should correlate satellite images with radar data and ground observations to get a more complete picture of the weather.
Infrared Satellite Image
Be aware that private companies (including TV weathercasts) often use different color schemes to indicate cloud top temperatures. They also often add symbols or colors to denote surface precipitation.
Observations » Satellite Data » Storm Movement, Growth, and Decay
When you look at satellite data in time lapse or image loop mode, you can see changes in cloud cover or system organization, strengthening or weakening, and system movement. In this image sequence, note the progression of the cloud bands across the central US, as well as those moving north off the coast of Florida. Note also that, in the central US at 02:45 UTC (9 pm CDT) the colder (blue) clouds died away and then popped up again at about 13:15 UTC (8 am CDT). Some, but not all, of these clouds were associated with heavy precipitation, particularly on the border between Ohio, Illinois, and Kentucky and in western Tennessee and eastern Arkansas. Usually, you will have to look at radar data or surface observations to see whether clouds on a satellite image are producing precipitation at the ground.
Observations » Satellite Data » Satellite Interpretation — Clouds vs. Snow or Fog
Viewing satellite data during the winter is more difficult. When the atmosphere is extremely cold, the cloud temperatures look similar to ground temperatures on infrared images, and white clouds in visible images look similar to snow-covered ground. On visible satellite data, snow cover is often more distinct in river valleys or in mountainous terrain. Snow-covered forests often have a mottled grey appearance. Looping the satellite data may help you distinguish the clouds from snow because you can see the clouds move.
Similarly, fog can be hard to distinguish from clouds on satellite photos. Both low cloud and fog may have similar temperatures and thus similar coloring. However, the clouds will tend to show a more mottled appearance, while fog tends to have smoother and more well-defined edges.
Forecasters have other satellite products that can help them distinguish fog. For example, the 10.7-micrometer IR channel is used for all-purpose cloud detection at night. Note the darker gray areas indicating low clouds or fog in the image. These products are not available from the www.weather.gov site.
In all cases, it is important to use various observational tools together for verification. In other words, combine what is observed in the surface data with what you see on satellite or radar to get the best idea of what's taking place.
Observations » Radar Data
Additional Resources:
www.weather.gov
Weather radar is probably the most commonly used tool by people concerned about precipitation. You can view a national composite of radar data from the tab at the www.weather.gov site. Click on a location to go to the page with the local radar data. The national radar map can give you an idea of what's heading your way, and the local radar will show more detail about what's currently happening in your area.
Observations » Radar Data » Navigation
Base Reflectivity Radar Image
Whether you go to a local NWS radar Web page via the weather.gov site or a local WFO Web page, the interface will look like this. Radar data will be the most current available, updated every 4 to 6 minutes when there's precipitation and every 10 minutes when there is no precipitation or when the radar is in what NWS meteorologists call "clear air mode." You will need to hit the refresh button on your browser to view a later image. In addition, you can turn on and off the depiction of topography, county lines, rivers, highways, cities, etc. The navigation buttons in the upper left are links to adjacent NWS radar sites.
The image that is displayed when the radar Web page first comes up is "base reflectivity" and relates to the intensity of precipitation. This image is from the lowest angle that the radar scans (0.5° above the horizon). Because it is only showing one slice of radar data, it may miss stronger echoes that are higher in the atmosphere.
To calculate the distance from a radar feature to your location, use the Range and Bearing information tool below the radar image. Click on the feature of interest and then move the mouse and these boxes will show the distance and direction from that point.
The "composite reflectivity" product shows the maximum echo intensity (reflectivity) detected over the entire vertical and horizontal area scanned by the radar. However, those maximum echoes may not be from precipitation that is reaching the ground. For more information about these and other radar products, select the "Radar FAQ" link near the bottom of the left navigation frame.
Composite Reflectivity Radar Image
You can also loop radar images by clicking "Loop" in the navigation bar. Set them to update automatically by clicking the AutoUpdate button below the image. Looping the images will help you estimate how fast a system is moving.
Observations » Radar Data » Color and Intensity
The color key indicates the intensity of the radar echoes. For relatively warm weather systems, shades of blue or green represent light precipitation, yellow indicates moderate precipitation, and shades of red, pink or purple signify thunderstorms, heavy and steady rain, or perhaps even melting snow flakes.
In the winter, snow generally tends to show as lighter intensity on radar than rain, and so will typically be displayed in blues and greens. However, large, wet or melting snowflakes can cause intense yellow or red radar echoes.
Watching the radar loop is very helpful. As the radar colors transition from lower on the scale to higher, the precipitation is intensifying. The storm motion shown in the loop can also help you time when bad weather will likely reach a particular location. However, radars aren't very effective at detecting small droplet events such as drizzle and fog. You could have a major icing event that doesn't show up on radar during the entire storm!
Be aware that radar data from other sources (such as TV stations) may use different color codes for precipitation intensity or to distinguish between rain and snow. NWS radars do not directly identify rain or snow. The private weather sources add this information to a radar graphic by estimating whether the surface or dewpoint temperatures are at or below freezing.
As always, it is critical to tie together what the radar displays and what is actually occurring at ground level. Watch radar and surface reports upstream where the snow or rain is coming from. Try to determine the lag time between when the radar shows precipitation, and when it is finally reported in the surface observation. Use this as a guide to calculate when it may reach your area.
Observations » Radar Data » Radar Interpretation
Interpreting radar data can be tricky. As we'll see, there are a few things you need to be aware of.
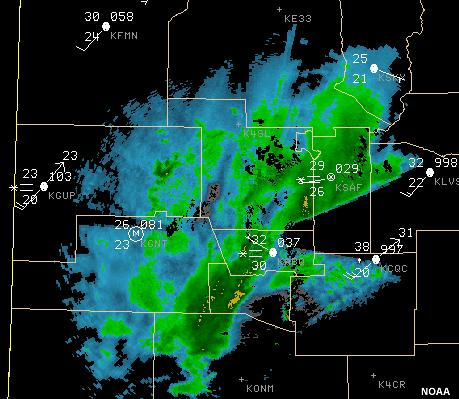
For example, rain and snow can be present in the same radar image.
Rain appears to have sharper resolution with fine details evident, while snow tends to be fuzzier in appearance. On this image, the echoes on the left are rain and those on the right are snow. Again, compare the radar data to surface data or what you see out the window so you can develop a mental picture that relates radar signatures to actual precipitation intensity.
Sometimes what you see on a radar image is ground clutter instead of precipitation. Ground clutter is radar energy bouncing off objects on or near the surface. Most ground clutter patterns surround a radar site in a ring or donut shape. To distinguish between precipitation and ground clutter, put the radar in looping mode. Precipitation moves, whereas ground clutter tends to remain stationary, although its appearance may change slightly over time.
In some locations, you might see no radar echoes in an area that actually is getting precipitation. This can happen when the radar beam is blocked by hills, mountains, or even buildings, preventing the radar beam from detecting precipitation on the other side. Terrain blocking is a problem that usually occurs in mountainous areas, particularly in the West. Your local NWS office can tell you if regions of your area are subject to blocking. Again, tie your satellite and surface data into the analysis; if the satellite data shows a well-defined weather system, odds are the gaps in radar coverage blocked by terrain are experiencing precipitation.
Observations » Radar Data » Data Disparities
You may have a situation in which snow is forecast and precipitation is visible on radar. You send your trucks out to prepare for plowing, and they sit there for hours before any accumulation begins. Or in the summer, the radar may show an area of rain over a road that tends to flood, but when you send someone out to check it, it's dry. What's going on?
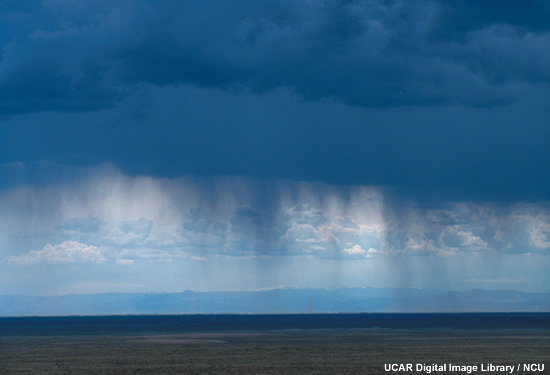
Typically, what is happening is that there is dry air below the clouds, and the precipitation is evaporating as it falls and never reaches the ground. However, if this process continues long enough, the air below the clouds becomes more humid. If it becomes saturated, the precipitation will finally reach the ground. This process can occur rapidly if the precipitation intensity increases quickly or the air below the clouds was close to saturation initially. On the other hand, the process could take several hours, or the air may remain dry enough that precipitation never reaches the ground at all.
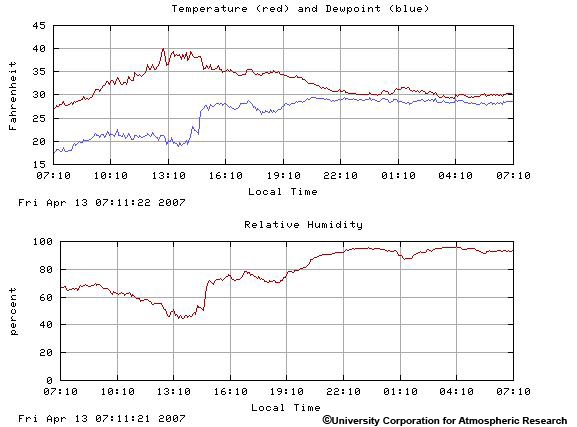
Relative humidity from the surface observation sites may help you get a handle on timing. As the relative humidity climbs to near 90% or higher, precipitation often begins to reach the ground. You can also watch the temperature and dewpoint temperature at ground observing sites. When the temperature and dewpoint temperature come to within 3 degrees of each other, precipitation usually reaches the ground. For snow, the dewpoint temperature will generally need to be 32 degrees or less; any higher and rain will be the more likely outcome. These are not hard-and-fast rules, so you may have to adjust the 90% threshold or 3 degree temperature difference up or down a bit from event to event or for your location. Your local NWS contact can give you some guidance.
Observations » Radar Data » Precipitation Estimates
NWS radars also estimate the amount of precipitation reaching the ground based on the intensity of the precipitation in the clouds. These data are provided as either one-hour totals or storm totals from the start to the end of the event. Click the links under "Rainfall." Note that the scale that depicts rain amounts may be different at different NWS radar sites.
Keep in mind that in winter events, the radar does not report snowfall measurements. Instead, the precipitation estimates are converted to the liquid equivalent—the amount of water you would have if you melted the snow.
Note that radar precipitation estimates can be too high when both hail and rain are occurring at the same time or when the radar energy is reflected by wet snowflakes. Wet snowflakes are very reflective and can be interpreted by the radar as high liquid amounts, erroneously increasing the total precipitation amount from the storm. As usual, compare the radar precipitation estimates with actual ground reports to get a complete picture.
Observations » Questions
Question 1
True or False: Satellite data viewed in looping mode are useful for monitoring storm movements. (Choose the best answer.)
The correct answer is True.
Looping mode provides a time-lapse view of cloud and storm motions that can help you time the arrival of a system.
Question 2
Radar data _____. (Choose all that apply.
The correct answer is a.
Answer a is the only completely correct answer. Answer b is incorrect—radar data are more available in flatter terrain. Mountains can block the radar beam, causing gaps in the data. Answer c is partially true. Radar can indicate where precipitation is occurring. However, remember that the radar is "looking" at clouds above the ground, and the precipitation may not actually reach the surface. Answer d is incorrect because radar is equally as useful for snow as it is for rain.
Question 3
A winter storm is in an adjacent state and is heading your way. How can you estimate how long it will be before it reaches a particular location in your state?
One of the best tools to use is radar data loops. By looking at the direction and how far a storm travels during the loop period, you can calculate the storm speed and estimate how long before it reaches your location.
Weather Hazards
Now that we've discussed weather forecasting and NWS products, let's take a look at specific hazards that affect transportation. We'll also talk about NWS products that target these events.
Weather Hazards » Precipitation
Precipitation can have a major impact on transportation, so in this section we'll discuss liquid, freezing, and frozen precipitation and the transition between each. Because the NWS uses specific terms to indicate extent, duration, and amount of precipitation, we'll also provide some definitions.
Official measurements of precipitation typically occur at ASOS stations that automatically collect, measure, and report precipitation start and stop times and amounts. As mentioned in the previous section, NWS radars also estimate precipitation across their area of coverage. The accuracy of these radar estimates can vary. Other precipitation data sources include NOAA weather observers, highway environmental sensors, and private systems, such as those maintained by TV stations. Availability of data from these sources varies, as does their accuracy.
Weather Hazards » Precipitation » Definitions
Let's now look at precipitation terms the NWS uses and their meanings.
The term "showers" means that the precipitation, whether rain or snow, will be intermittent and variable in intensity across the area or through time. By contrast, the terms "rain" and "snow" signify steady precipitation from clouds that cover a much wider area.
A "trace" of rain or melted snow is defined as under 0.01 inch. Official measurements of a "trace of snow fall" is defined as less than 0.1 inch, while snow "depth" on the ground is defined as a trace if it measures less than half an inch deep.
Meteorologists talk about precipitation in terms of its likelihood of occurring, how much will fall, how much of an area it will cover, and how intense it may be. The term "slight chance" is used to imply that an event has only a 10-20% chance of occurring at a given location but cannot be ruled out.
The term "chance" indicates a 30% to 50% probability of measuring at least 0.01 of an inch of rain or melted snow in a 12-hour period (such as, 6 AM to 6 PM). Relative to "slight chance," there is a slightly higher likelihood of the precipitation occurring at a given location, but it is by no means certain.
Probabilities of 60% to 70% indicate a relatively high likelihood of occurrence. Thus when "likely" is used, the forecaster is fairly confident that at least 0.01 of an inch of precipitation will fall. A "likely" event could be one that lasts for a long time and impacts a large area, or it could be a line of showers or storms that last only five minutes at any given location. It could be an event yielding only a few hundredths of an inch or several inches. The main point is that the forecaster expects the event is likely to occur.
The same is true for 80% to 100% chance of precipitation although with these probabilities, there is no question that the forecaster expects measurable rain or snow to occur in the 12-hour time frame. At these probabilities, the term "occasional" is often used to imply that the event will occur, but will not be continuous during that entire 12-hour period. The "occasional" or "80% to 100%" event may be one that lasts steadily for a few hours or occurs as frequent showers for all or part of the 12-hour period.
The term "isolated" implies that, if precipitation does occur, about 10-20% of the forecast area will receive it. Low probabilities do not necessarily mean that precipitation amounts will be small. In fact, heavy rain or intense snow can occur, but the precipitation will impact only a small part of the forecast area.
The term "scattered" means a coverage that is greater than "isolated." When forecasters are fairly confident that precipitation will occur, but expect coverage to be limited, they may choose a phrase like, "Scattered showers. Chance of precipitation, 40%." This indicates that the forecaster is fairly certain precipitation will occur, but the location and timing may be uncertain, and the coverage is expected to be limited.
In summary, the chance-of-precipitation values used by NWS meteorologists express their level of confidence a precipitation event will occur or its anticipated coverage. Be aware that private forecasting services may not follow the same use of probabilities or qualifying terms used by the NWS.
Weather Hazards » Precipitation » Precipitation Types
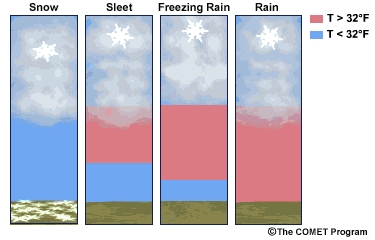
The type of precipitation that reaches the ground depends on its initial state when it forms (whether it is liquid or frozen aloft) and the temperature of the air that it falls through. Often, precipitation develops first as snow at altitudes where the air temperature is below freezing. As the snow falls, it completely melts if the temperature below cloud base is above freezing. It will stay liquid and reach the ground as rain, if the air and ground temperatures are warm enough. However, if a shallow layer of air near the ground is at or below freezing and the ground is frozen, the rain can freeze on impact, resulting in an icy surface. If the depth of that subfreezing air near the ground is several thousand feet thick, the raindrops can re-freeze to form sleet or ice pellets. If the entire air column between the cloud and ground is below freezing, the snow will remain as flakes all the way to the ground.
The problem with forecasting precipitation type is that meteorologists don't have many measurements of temperature aloft, so they have to estimate the temperature of the air that the precipitation is falling through. Just a 1° error near the freezing point can have significant impact on whether rain, freezing rain, or snow occurs.
Weather Hazards » Precipitation » Precipitation Tools
Additional Resources:
www.weather.gov
Your best tools to use for monitoring precipitation are:
- Satellite for weather system trends
- Radar for current precipitation coverage and estimated precipitation amounts
- Surface observations for precipitation amounts and to corroborate radar estimates
- River data for monitoring the river level compared to flood stage.
Remember that all these data are available from the www.weather.gov website.
Weather Hazards » Rain/Floods
From the viewpoint of a transportation manager, heavy rain is a significant hazard in that it reduces traction, impairs visibility, and can cause flooding, mud, or rockslides, and in extreme cases, failure of a roadway's infrastructure. Heavy rain can result from many different weather phenomena, including isolated thunderstorm complexes, long-lasting weather systems, rain associated with weather fronts, monsoonal patterns that occur in the Southwest U.S., and tropical cyclones.
In this section, we'll first define some more terms. Next, we'll discuss short-duration and long-duration, high intensity rain events that can result in flooded roads or landslides that block roads. We'll also review NWS forecast products for these events. We'll conclude this section by looking at tools related to evaluating precipitation and flooding.
Weather Hazards » Rain/Floods » Definitions
We've already talked about the terms "rain" and "showers." The term "drizzle" refers to extremely small water drops that fall to the ground, as opposed to fog droplets, which stay suspended in the air. It could drizzle all day, but the intensity is so light that only a trace amount of precipitation falls.
"Sprinkles" are light rain or rain showers with larger drops. Forecasters may use that term to imply that the precipitation will be light and will have a low probability of wetting the ground. Both drizzle and sprinkles may be brief, may last for several hours, or occur steadily or intermittently all day. Both may be hard to detect on radar (especially those used by TV stations).
Another term that people often are confused about is the "100-year flood" (or the 50-year flood stage or similar phrases). This does not refer to a flood that will occur once every 100 years. Rather, it is the level of water that has a 1% chance of being equaled or exceeded each year. This level varies from river to river. The important thing to remember is that the term "100-year flood" does not mean that a large flood is guaranteed to occur only once every hundred years. They can, and sometimes do, happen more frequently.
Weather Hazards » Rain/Floods » Flash Floods
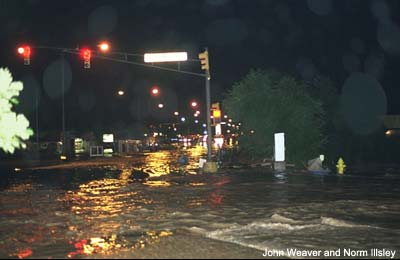
Short-duration, high-intensity rainstorms can cause rapid flooding of small rivers, streams, or urban areas. These kinds of events, called "flash floods," can be difficult to predict because their occurrence is not simply related to the amount of rain that falls. Other important factors include local terrain (slope), ground cover (grass vs. paved, rock vs. sand, etc.), degree of urbanization, initial ground or river conditions (saturated or dry ground, low or high river levels), and dam failure.
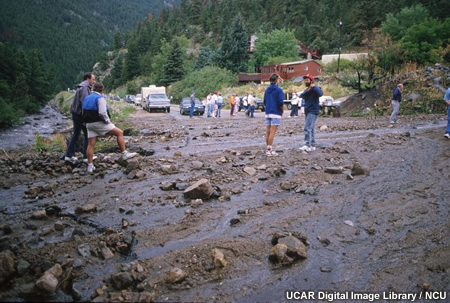
Mountainous, rocky terrain is often subject to rapid flooding. For example, in the southwestern U.S., summer thunderstorms can rapidly flood local streams. The rain may occur in the mountains, but as the water continues down to lower elevations, the narrow desert canyons can flood even though no rain has fallen in the immediate area.
Weather Hazards » Rain/Floods » Flash Flood Guidance
Flash Flood Guidance Products provide an estimate of the average rainfall over a specified area and time duration required to initiate flooding on small streams. Flash flood guidance is expressed in units of inches for various durations, but usually 1-, 3-, and 6-hour durations. For example, in this image the dark blue squares identify areas where flooding should begin on small streams if 3 inches or more falls in a 3-hour period.
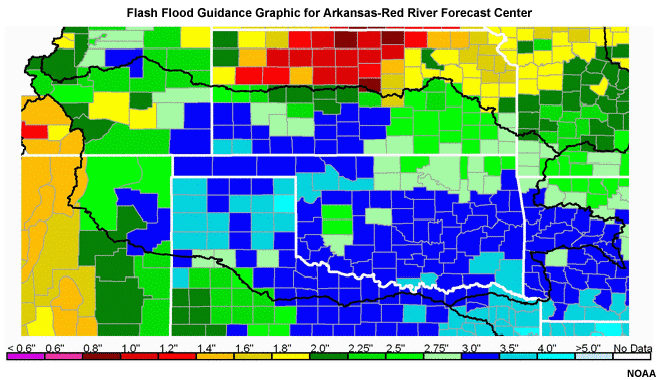
To find a Flash Flood Guidance Product, you'll first go to the website for the NWS River Forecast Center that services your area. A list of these centers can be found by going to the weather.gov site, clicking on the “Organization” link at the top of the page (look for the "hand" icon below "Organization" in the top menu bar).
www.weather.gov Web Page
Then scroll about halfway down the page to the River Forecast Centers heading under Regional Support Centers. Click on the Center for your area ("hand" icon is under the link to "Southeast RFC").
NWS "Organization" Web Page
Then look for “Flash Flood Guidance.” The product is not always easy to find on some Centers' pages (look for "hand icon" near top of left-hand menu), so you may need to ask someone at your local WFO for directions on how to get to it.
Main Web page for the West Gulf River Center
Flash Flood Guidance Product for Eastern US
Weather Hazards » Rain/Floods » Long-Duration Rain and Floods
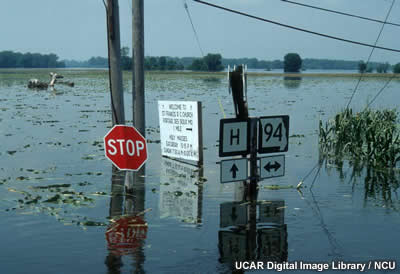
Weather systems that produce rainfall over several days or weeks typically cause slower water rises in streams and rivers. These are usually easier to predict than flash floods. In situations where rain amounts may total several inches, particularly when the ground is already saturated, rivers can gradually fill and overflow in the course of one to several days. The remnants of tropical cyclones can bring these kinds of rains far inland during the summer and fall
River flooding in winter often occurs because wet ground rarely dries out and often freezes, so most of the rain goes directly into the streams. Should rivers freeze over, a rapid river rise from rain or snowmelt can break the ice, leading to ice jams at bridges, which then act like dams. The damming by the ice creates slow flooding upstream and could lead to rapid, flash flooding downstream when the ice jam breaks loose. Similar damming problems can occur with debris flows. Additionally, river flooding can occur in the spring when the winter snow pack melts. The problem is compounded if rain occurs at the same time.
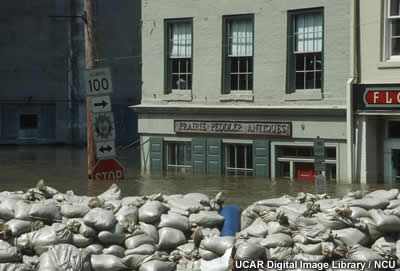
If flooding occurs, road closure signs, sand bagging efforts, or even evacuations may be required.
Weather Hazards » Rain/Floods » Rain/Flood Forecast Products
The "Urban and Small Stream Flood Advisory" provides advance notice for flooding of small streams and in urban areas such as roads, underpasses, and low-lying areas. It is used in situations where the water is primarily a major inconvenience, not life-threatening.
Urban and Small Stream Flood Advisory Example
"Flash Flood Statements," "Flash Flood Watches," and "Flash Flood Warnings" highlight situations when rapid flooding is expected or occurring. These products are reserved for short-term events (i.e., those occurring in less than six hours) and cover flash flooding from short-term excessive precipitation, extensive snow/ice melt, and dam breaks.
"Flood Watches" and "Flash Flood Watches" are used to inform the public about conditions that might cause flooding, but are neither certain or imminent. "Flood Warnings" and "Flash Flood Warnings" indicate that the event is more certain. A flood warning normally specifies river crest information and is issued for specific communities or areas along rivers where flooding has been forecast, is expected soon, or is already happening.
Because heavy rain is often associated with thunderstorms, you should also be aware of products issued during convective or thunderstorm weather. The two main thunderstorm forecast products issued by the NWS are the "Severe Thunderstorm Watch" and "Severe Thunderstorm Warning." The NWS defines "severe" as a thunderstorm with winds equal to or greater than 58 mph and/or hail size ¾ inch or larger. What you consider "severe" from the perspective of keeping traffic moving may be considerably different.
The "Excessive Rain Outlook," issued four times a day, depicts areas that may receive heavy precipitation that will cause or aggravate flooding. This forecast predicts out as far as 30 hours and is available from the NWS Weather Prediction Center (WPC) website (https://www.wpc.ncep.noaa.gov/qpf/excess_rain.shtml).
Flash Flood Guidance Products provide an estimate of the average rainfall over a specified area and time duration required to initiate flooding on small streams. Flash flood guidance is expressed in units of inches for various durations, but usually 1-, 3-, and 6-hour durations. For example, in this image the dark blue squares identify areas where flooding should begin on small streams if 3 inches or more falls in a 3-hour period.
To find a Flash Flood Guidance Product, you'll first go to the website for the NWS River Forecast Center that services your area. A list of these centers can be found by going to the weather.gov site, clicking on the “Organization” link at the top of the page, and then scrolling about halfway down the page to the River Forecast Centers heading under Regional Support Centers. Click on the Center for your area, and then look for “Flash Flood Guidance.” The product is not always easy to find on some Centers' pages, so you may need to ask someone at your local WFO for directions on how to get to it.
The "Urban and Small Stream Flood Advisory" provides advance notice for flooding of small streams and in urban areas such as roads, underpasses, and low-lying areas. It is used in situations where the water is primarily a major inconvenience, not life-threatening.
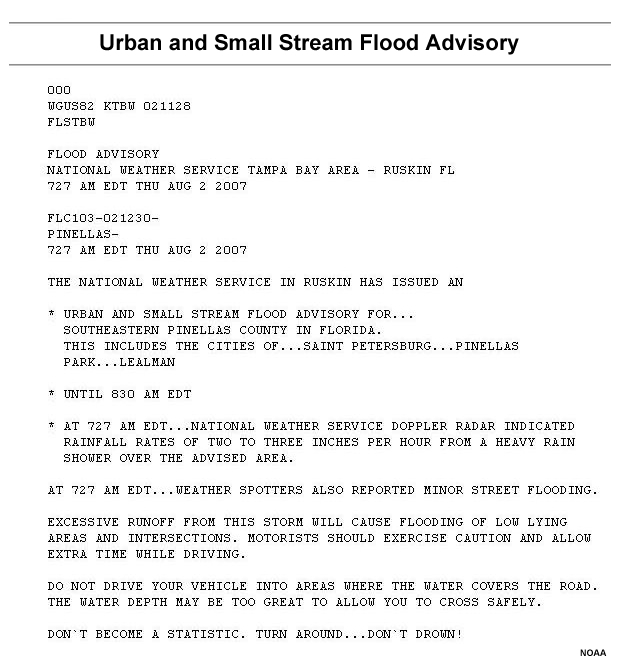
"Flash Flood Statements," "Flash Flood Watches," and "Flash Flood Warnings" highlight situations when rapid flooding is expected or occurring. These products are reserved for short-term events (i.e., those occurring in less than six hours) and cover flash flooding from short-term excessive precipitation, extensive snow/ice melt, and dam breaks.
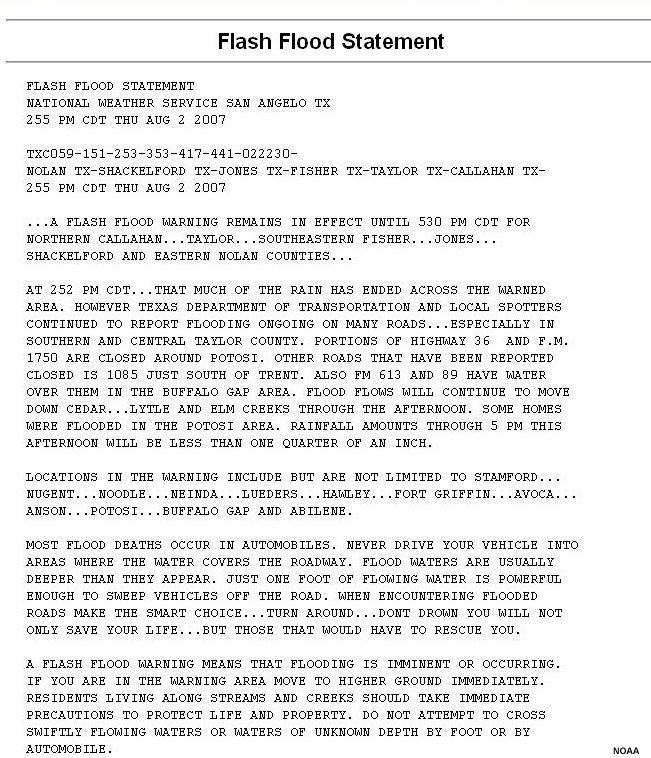
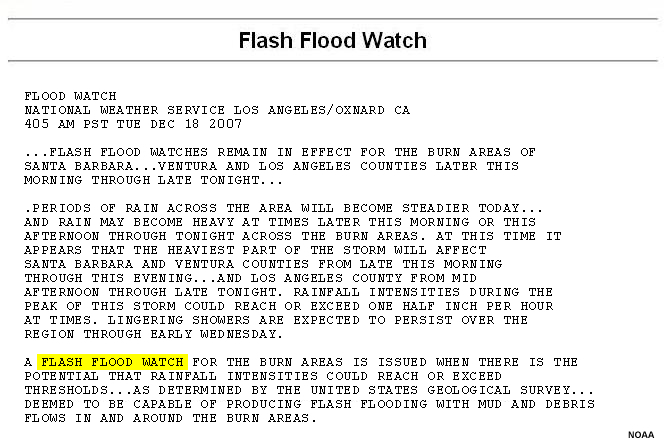
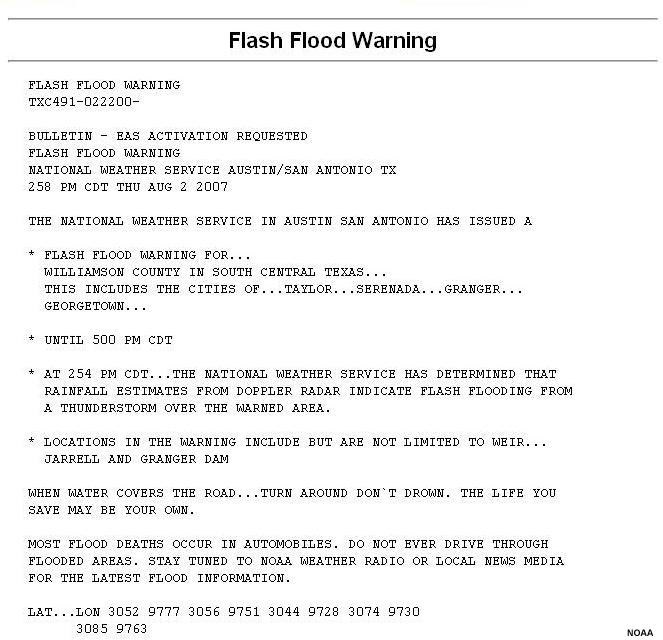
"Flood Watches" and "Flash Flood Watches" are used to inform the public about conditions that might cause flooding, but are neither certain or imminent. "Flood Warnings" and "Flash Flood Warnings" indicate that the event is more certain. A flood warning normally specifies river crest information and is issued for specific communities or areas along rivers where flooding has been forecast, is expected soon, or is already happening.
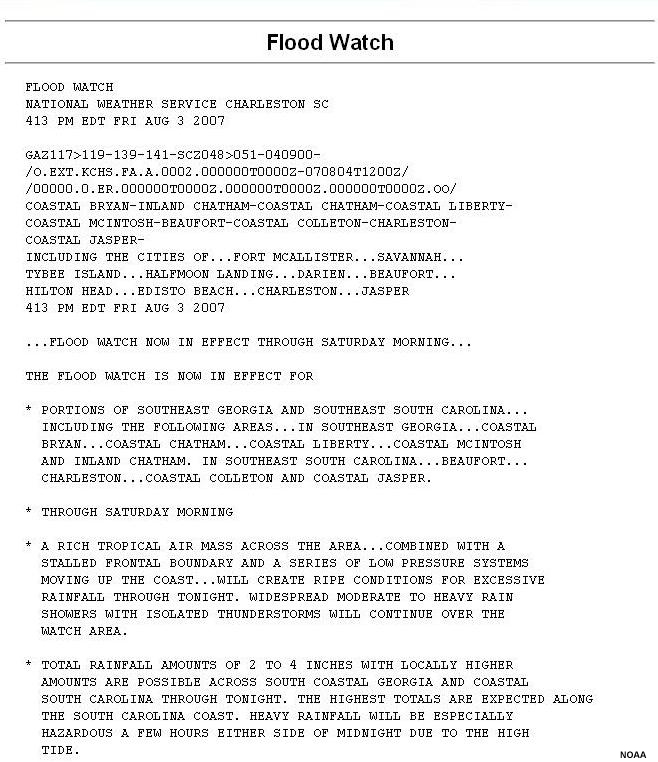
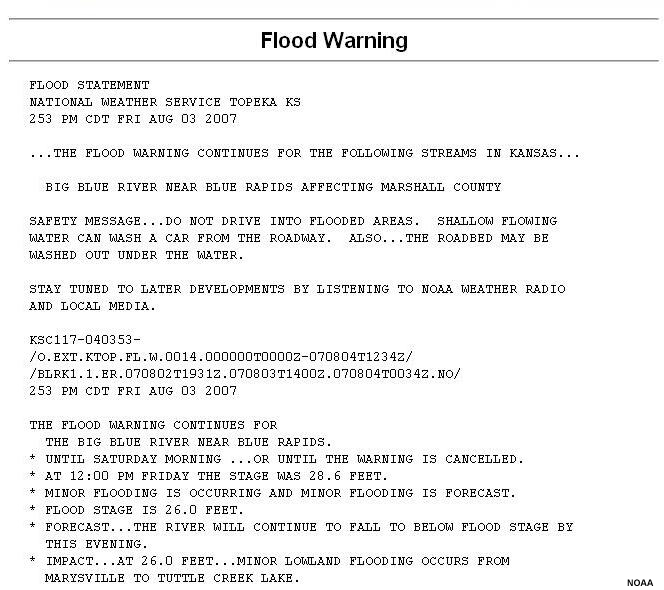
Because heavy rain is often associated with thunderstorms, you should also be aware of products issued during convective or thunderstorm weather. The two main thunderstorm forecast products issued by the NWS are the "Severe Thunderstorm Watch" and "Severe Thunderstorm Warning." The NWS defines "severe" as a thunderstorm with winds equal to or greater than 58 mph and/or hail size ¾ inch or larger. What you consider "severe" from the perspective of keeping traffic moving may be considerably different.
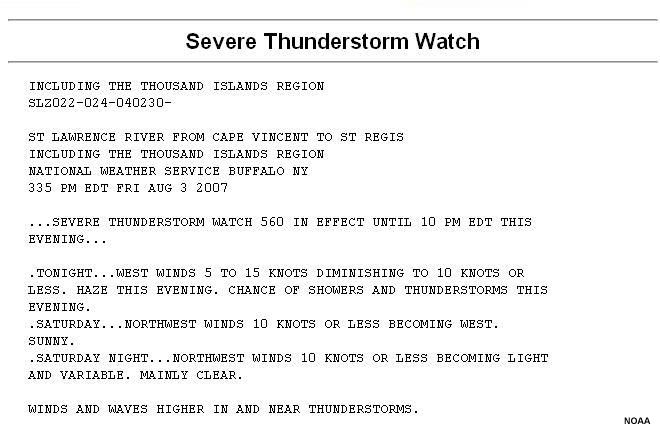
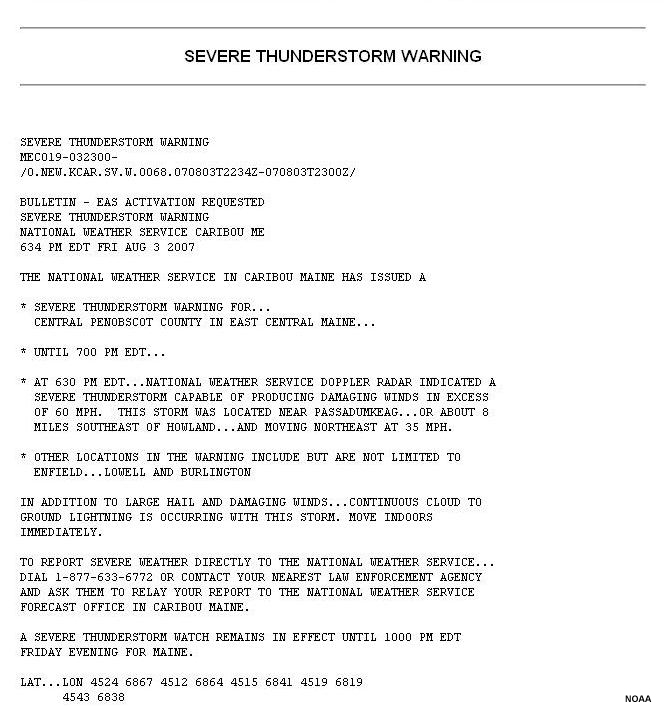
BROKEN LINK
The "Excessive Rain Outlook," issued four times a day, depicts areas that may receive heavy precipitation that will cause or aggravate flooding. This forecast predicts out as far as 30 hours and is available from the NWS Weather Prediction Center (WPC) website (https://www.wpc.ncep.noaa.gov/qpf/excess_rain.shtml).
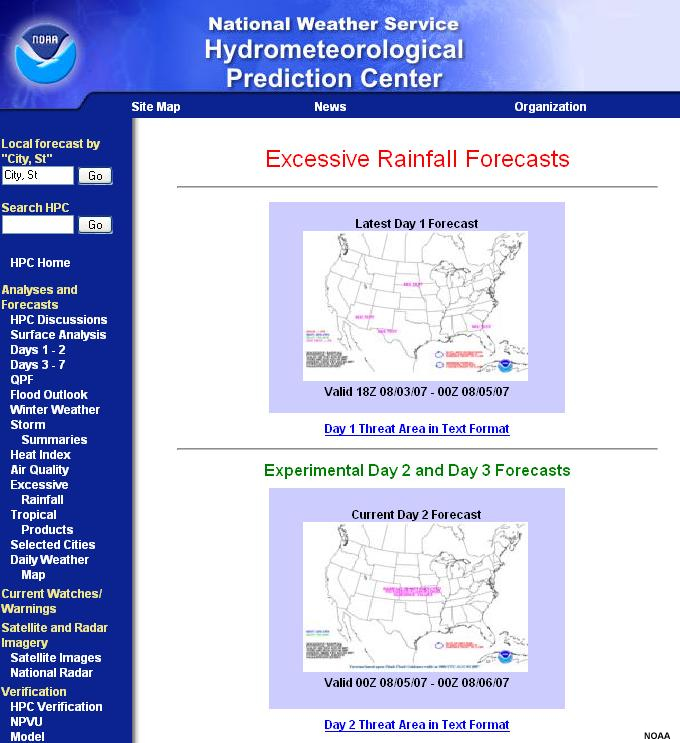
Flash Flood Guidance Products provide an estimate of the average rainfall over a specified area and time duration required to initiate flooding on small streams. Flash flood guidance is expressed in units of inches for various durations, but usually 1-, 3-, and 6-hour durations. For example, in this image the dark blue squares identify areas where flooding should begin on small streams if 3 inches or more falls in a 3-hour period.
To find a Flash Flood Guidance Product, you'll first go to the website for the NWS River Forecast Center that services your area. A list of these centers can be found by going to the weather.gov site, clicking on the “Organization” link at the top of the page, and then scrolling about halfway down the page to the River Forecast Centers heading under Regional Support Centers. Click on the Center for your area, and then look for “Flash Flood Guidance.” The product is not always easy to find on some Centers' pages, so you may need to ask someone at your local WFO for directions on how to get to it.
Weather Hazards » Winter Precipitation
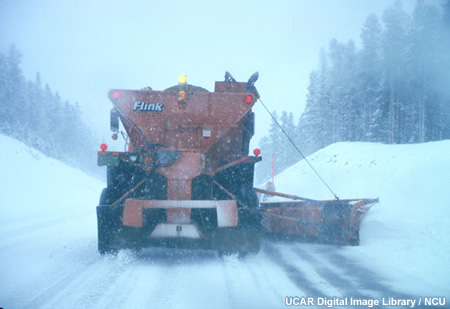
Let's now turn to winter systems, which are probably the most difficult weather scenarios that road crews deal with. In this section, we'll talk about snow, freezing rain, sleet, frost, and common types of winter storms.
Accumulations of snow, sleet, or freezing rain on road surfaces will depend on the temperature of the road, the intensity and duration of the precipitation, and what treatment, if any, is on the road. Road surfaces may need to cool to the freezing point (determined by treated or untreated conditions) before icing or snow accumulation can occur. However, heavy snow or heavy sleet can accumulate on road surfaces above the freezing point. Road surfaces in these cases will be wet and slushy, but the frozen precipitation will quickly cool the road surface, possibly to freezing. Lighter accumulations will cover the road surface more slowly and often allow sufficient time for the accumulation to completely melt, especially if the road surface temperatures were well above freezing to begin with.
Larger snow storms are frequently well-predicted in advance. However, it is the smaller, less predictable storms—the ones that quickly drop an inch during rush hour—that can lead to numerous accidents and have a much larger impact than a 6-12 inch overnight snowstorm.
Weather Hazards » Winter Precipitation » Definitions
Recall that the NWS uses the term " snow" to refer to fairly steady precipitation, while "snow showers" indicate the precipitation is occurring intermittently. " Flurries" are a very light snow shower and, like drizzle, are considered a non-measurable event. Flurries may end up as a dusting of snow which melts or evaporates being accumulating.
Snow accumulation depends on intensity, duration, and density (wet and slushy vs. light and fluffy). Other important factors include the ground's temperature and wetness, the air's humidity, surface treatments, and whether intervening sunny periods melt any accumulation.
Weather Hazards » Winter Precipitation » Snow and Temperatures
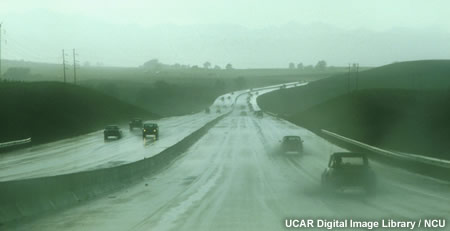
The relationship between snow density and temperature is complex and depends on conditions such as:
- Temperature and moisture in the atmosphere where the snow forms
- Temperature and moisture near the surface
- Winds
In general, when surface air temperatures are near or just above freezing, the snow is often wet and heavy, is less likely to blow around, and may not even accumulate if the ground is warm enough or roads have been treated. With air temperatures in the 20s or colder, the snow is usually drier and more likely to blow and drift.
Weather Hazards » Winter Precipitation » Snow-to-Liquid Ratios
This table (below) shows the relationship of temperature to the amount of water in snow. For surface air temperatures above 34°F, the snow is typically very wet and usually melts before accumulating. Between 34° and 28°, the ratio of the amount of snow to its melted liquid amount is usually about 10:1. In other words, if you melted 10 inches of snow, you would get 1 inch of liquid. Below 0°F, it might take more like 50 inches of snow to get 1 inch of liquid after melting.
Snow-to-Liquid Ratios*
|
|
Surface Temperature (°F) |
|||||
|
>34° |
34°-28° |
27°-20° |
19°-10° |
9° -0° |
<0° |
|
|
Snow-to-liquid ratio |
1:1 |
10:1 |
15:1 |
20:1 to 30:1 |
40:1 |
50:1 |
|
Amount of precip. |
1.00" |
10" |
15" |
20" to 30" |
40" |
50" |
|
Type of precip. |
Rain |
Snow |
Snow |
Snow |
Snow |
Snow |
*Note that the snow-to-liquid ratios also depend on the temperature at which the precipitation is produced, which may not be the same as the surface temperature.
No two winter weather events are alike. Temperatures and the liquid water content can vary from weather system to weather system or even during the course of a single storm. Most large snowfalls happen within ratios of 10:1 to 15:1 or when air temperatures range from the mid 20s to lower 30s. Although the ratios are much larger when temperatures fall to the lower teens or single digits, excessive snowfalls are not likely because colder air holds less moisture than warmer air. An exception to this is when a very cold and dry air mass is modified, as in a lake effect snow event where arctic air flows over a water surface such as the Great Lakes. The arctic air warms and moistens substantially as it flows over the water.
In general, early and late winter snows tend to occur with warmer temperatures, which hold more moisture. At these times of year, it is more common for the snow to be wetter than that in mid-winter storms, which often originate in cold, dry regions like Canada. Weather systems that originate in the southern U.S. near the Gulf will tend to be wetter. Forecasters keep these factors in mind and adjust snow forecasts according to the snow-liquid ratio they expect.
Weather Hazards » Winter Precipitation » Blizzards
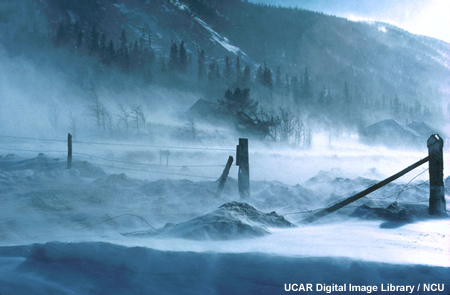
Blizzards are often well-forecast because they are intense weather systems, which are usually handled well by computer models. Nonetheless, they are difficult for road crews to deal with due to large amounts of snow falling, blowing, and drifting. Because blizzards are often forecasted several days in advance, road crews usually have ample time to prepare and plan for the best use of equipment and personnel.
Blizzards result from very strong winds or gusts above 35 mph that blow the snow and reduce visibility to ¼ mile or less for several hours. Ground blizzards refer to cases when no snow is falling, but snow on the ground is lifted by strong winds, reducing visibility below a ¼ mile. Ground blizzards are most common in the Northern Plains states.
Weather Hazards » Winter Precipitation » Unique Storms
Alberta Clippers are so named because these weather systems travel southeast from the Alberta, Canada region and usually track across the northern tier of the U.S. They are not unusually intense but can be frequent, coming every one to three days for a one- to several-week period.
Alberta Clippers usually produce about 1-3 inches of snow along and north of the track of the surface low pressure center, although occasionally they produce 3-6 inch snows. After the low pressure center passes, polar (cold) or arctic (very cold) air usually builds back in. Winds can be quite blustery with Clippers and, with the snow often light and fluffy, a lot of blowing and drifting may result.
Lake effect snows, which are common near the Great Lakes, Lake Tahoe, and Great Salt Lake, can have major impacts on roads. In addition to blinding snows, accumulation rates of 2-3 inches per hour are common, greatly challenging snow removal operations.
Lake effect snows are the result of extremely cold air flowing over relatively warm, large bodies of water. Moisture is drawn from the lake, condensing into bands of clouds that produce snow squalls. Higher terrain nearby can also enhance the snow production process. Lake effect snows are most intense when the temperature difference between the lake and air exceeds 10°C (18°F) and when the wind has blown across an extensive fetch of the water. In extreme cases, "thundersnow" events can occur in which a thunderstorm produces snow, often at rates of 3 to 5 inches per hour.
The snow clouds form either in multiple parallel bands or into one or two very large bands, which can stretch for hundreds of miles. Sometimes these bands can be nearly stationary, dumping several feet of snow on some places. More often, the cloud bands shift with the wind, resulting in a variety of locations experiencing frequent heavy snow squalls during the event.
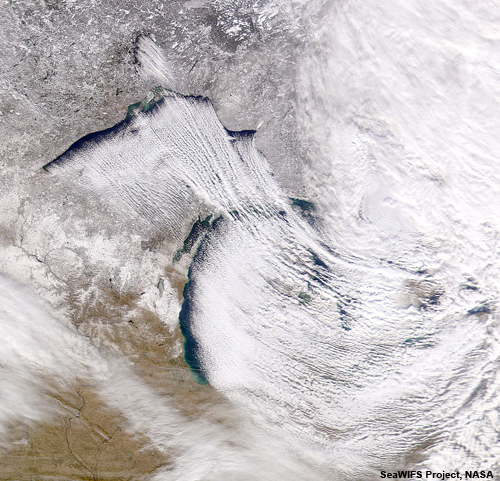
Locations under the cloud bands will experience periods of intense snow showers. So when snow showers are streaming off a large water body, it is important for road crews to be prepared for sudden snow squalls that can cause slick roads in as little as 10 minutes. It is not easy to predict the path of the individual snow shower cells well in advance because they are fast-moving and their effects are localized. You will need to closely watch their movement on radar to determine where road problems may occur.
Nor'easters are strong weather systems that develop over the Atlantic Ocean near the mid-Atlantic or Northeast coast. These storms can cause up to several feet of snow and paralyze an entire region. In addition to significant precipitation, strong winds, coastal flooding, and significant beach erosion can occur. Depending on the winter, the East Coast may experience one to as many as a half dozen Nor'easters, but fortunately, not all East Coast storms become true Nor'easters.
True Nor'easters are usually well-forecast days in advance by the NWS and local media. However, the exact track of the system may be less predictable and will have a big impact on the type and amount of precipitation received at any given location.
Weather Hazards » Winter Precipitation » Road Ice and Frost
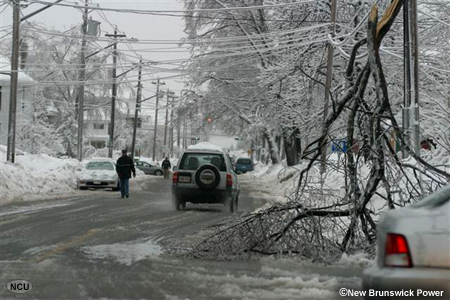
Various weather conditions, aside from snowfalls, can lead to ice on road surfaces. One scenario is when water droplets at temperatures just above 32°F freeze shortly after impacting a frozen surface. Some precipitation droplets actually cool to temperatures below freezing (supercooled) but remain in liquid form until they freeze on impact with the surface.
Another example is when ice or snow that melts during the day re-freezes at night when air temperatures drop to freezing. Also, a rain event followed by clearing skies at night, light winds, slow drying, and strong cooling may result in the surface water freezing.
Precipitation is not required to form ice on a road. Ice may develop on the road surface when a layer of humid air lies above a slightly damp to nearly dry road surface. When this thin coating of ice or frost is difficult to see, it is referred to as black ice. Black ice can also form when warm, moist air flows over the frozen ground.
Frost forms on roads or bridges when the road or bridge deck surface temperature and the dewpoint temperature are at or below freezing. Typically, frost occurs under clear sky conditions on cold nights with light winds. However, frost can also occur when warm and relatively moist air flows over a frozen surface, even if skies are overcast. This type of frost event often occurs when a maritime air mass moves into an area where arctic or polar air has recently moved out.
If you are trying to decide if frost or ice on roads is likely, remember that air temperatures measured by the NWS are about five feet above ground level. These readings can be as much as eight degrees warmer than surface temperatures, so a comparison of road surface temperature to the air's surface dewpoint temperature is more appropriate. Keep in mind too, that road surfaces will radiate heat, but the ground below the road surface retains heat and may prevent the road surface from reaching freezing. If that is the case, dew is more likely to form than frost. Conversely, a frozen subsurface could cool a pavement surface and promote frost formation.
Many other factors come into play in determining whether a road or bridge will cool enough to form ice or frost:
- Blacktop heats and cools more rapidly than cement
- A wet surface must dry before substantial heating or cooling can occur
- A road sloping toward the sun heats faster than one sloping away
- Nearby land surfaces and shading by structures, terrain, or vegetation also impact the rate of heating or cooling
- The greater the cloud cover extent and the thicker the cloud layers, the less sunshine will heat the road
- At night, the amount, height, and thickness of cloud layers impact the rate of surface cooling. Thick cloud decks typically prevent heat from radiating to space and usually prevent frost development. A thin veil of cloud that barely hides the stars will slow the cooling process, but may not prevent frost formation.
So when temperatures are at or forecasted to fall to the freezing point, you should consider the potential for ice or frost to form. Most private weather companies provide forecasts of ice or frost on roads so highway departments can anticipate the event and pre-treat the roads.
Weather Hazards » Winter Precipitation » Ice Storms
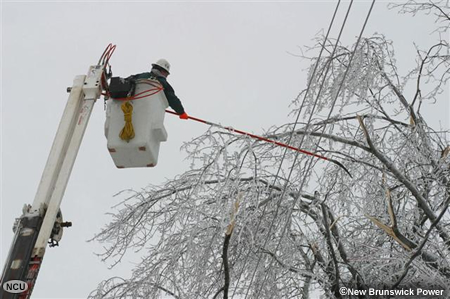
Ice storms can occur after an arctic or polar air mass has overtaken a region, allowing air and road surface temperatures to cool to freezing or below. Next, the arrival of a weather system, often from the southern U.S., brings the precipitation. As the system develops, air temperatures may rise to near-freezing, but the ground is still well below freezing and will cause any liquid precipitation to freeze on contact, resulting in potentially heavy ice accumulations.
In another scenario, mountain valleys often trap colder air, creating localized areas where precipitation may occur as a freezing rain. In the eastern U.S., the Appalachian chain and valleys east of the mountains can trap very cold polar or arctic air. When a weather system moves up the Atlantic coast region, much of the precipitation falls as rain, which results in major ice storms because of the subfreezing air trapped in the valleys.
Another scenario is one in which a strong weather system develops but with little, if any, cold air in place. The atmosphere, however, is just cold enough for the rain to freeze. Should this event last for six or more hours, ice accumulations may be slow (because the temperature is at or just below freezing), but the total ice accumulation could be significant.
In some ice storms, air temperatures may climb no higher than the lower 20s with rain falling. This will result in rapid and dramatic ice accumulations, causing major problems. The main point is the colder the air and ground is at the outset of precipitation and the heavier the precipitation rate, the faster the ice will accumulate.
Pre-wetting salt treatments may help initially in controlling icing, although much of the solution may be washed off by the rain. Additional granular salt or other solid chemical application will be necessary to maintain road conditions. However, widespread tree and power line damage creates other hazards that road crews must address.
Weather Hazards » Winter Precipitation » Winter Weather Forecast Products
The NWS issues specific products for winter weather forecasts.
A "Winter Weather Advisory" indicates that hazardous conditions are expected that will involve a combination of snow, freezing rain, and/or sleet. These conditions could seriously impact travel.
Winter Weather Advisory Example
"Winter Storm Watches" and "Winter Storm Warnings" are issued for more serious events that could threaten life and property. The criteria that trigger a watch or warning vary by state. For example, in Oklahoma heavy snow is defined as 4 or more inches accumulating in a 12-hour period or 6 or more inches accumulating in a 24-hour period. For the Colorado mountains, the definition is 8 inches of snow in 12 hours and 10 or more in 24 hours. Check with your NWS office to find out what criteria pertain to your area.
A blizzard will typically be preceded by a "Winter Storm Watch" or "Blizzard Watch," followed by a "Blizzard Warning." Local WFO Area Forecast Discussions and Hazardous Weather Outlooks often are the first place that forecasters mention a significant event that is still days away. As the event approaches, local offices will likely issue watches and will include greater detail (timing, precipitation amounts) in their forecasts.
When lake effect squalls are predicted, the NWS will issue a "Lake Effect Snow Advisory" or a "Lake Effect Snow Warning." Advisories for lake effect snow are typically around 4-6 inches in 12 hours, while warnings are for amounts expected to exceed 6 inches in 12 hours. Nor'easters and Alberta Clippers are covered in routine NWS forecast products and in specialized marine and public forecast products (e.g., "Gale Warning").
Lake Effect Snow Warning Example
"Ice Storm Warnings" are issued when freezing rain accumulations are expected to be heavy and result in widespread traffic problems and power outages from downed lines.
"Freezing Rain Advisories" or "Freezing Drizzle Advisories" are issued when ice accumulations are expected to cause problems but not widespread damage or power outages. Of course, freezing rain or drizzle can have a major impact on road surfaces and vehicle traction. Freezing drizzle can be particularly difficult to forecast because radar often fails to detect it and forecasters usually do not know if the roads have been treated.
Freezing Rain (Drizzle) Advisory Example
"Freezing Fog Advisories" are issued when fog freezes on road surfaces as black ice. These are difficult events to forecast since forecasters have little information about how dense the fog is and how easily water from it deposits on road surfaces. Often, such advisories are issued after the WFO receives reports from highway departments or law enforcement.
The WPC website (https://www.wpc.ncep.noaa.gov/wwd/impactgraphics/) has experimental impact graphics that forecast the most likely track of a surface low pressure system, as well as associated impacts such as visibility reduction, ice, snow or snow rates.
The NWS issues specific products for winter weather forecasts.
A "Winter Weather Advisory" indicates that hazardous conditions are expected that will involve a combination of snow, freezing rain, and/or sleet. These conditions could seriously impact travel.
"Winter Storm Watches" and "Winter Storm Warnings" are issued for more serious events that could threaten life and property. The criteria that trigger a watch or warning vary by state. For example, in Oklahoma heavy snow is defined as 4 or more inches accumulating in a 12-hour period or 6 or more inches accumulating in a 24-hour period. For the Colorado mountains, the definition is 8 inches of snow in 12 hours and 10 or more in 24 hours. Check with your NWS office to find out what criteria pertain to your area.
A blizzard will typically be preceded by a "Winter Storm Watch" or "Blizzard Watch," followed by a "Blizzard Warning." Local WFO Area Forecast Discussions and Hazardous Weather Outlooks often are the first place that forecasters mention a significant event that is still days away. As the event approaches, local offices will likely issue watches and will include greater detail (timing, precipitation amounts) in their forecasts.
When lake effect squalls are predicted, the NWS will issue a "Lake Effect Snow Advisory" or a "Lake Effect Snow Warning." Advisories for lake effect snow are typically around 4-6 inches in 12 hours, while warnings are for amounts expected to exceed 6 inches in 12 hours. Nor'easters and Alberta Clippers are covered in routine NWS forecast products and in specialized marine and public forecast products (e.g., "Gale Warning").
"Ice Storm Warnings" are issued when freezing rain accumulations are expected to be heavy and result in widespread traffic problems and power outages from downed lines.
"Freezing Rain Advisories" or "Freezing Drizzle Advisories" are issued when ice accumulations are expected to cause problems but not widespread damage or power outages. Of course, freezing rain or drizzle can have a major impact on road surfaces and vehicle traction. Freezing drizzle can be particularly difficult to forecast because radar often fails to detect it and forecasters usually do not know if the roads have been treated.
"Freezing Fog Advisories" are issued when fog freezes on road surfaces as black ice. These are difficult events to forecast since forecasters have little information about how dense the fog is and how easily water from it deposits on road surfaces. Often, such advisories are issued after the WFO receives reports from highway departments or law enforcement.
The WPC website (https://www.wpc.ncep.noaa.gov/wwd/impactgraphics/) has experimental impact graphics that forecast the most likely track of a surface low pressure system, as well as associated impacts such as visibility reduction, ice, snow or snow rates.
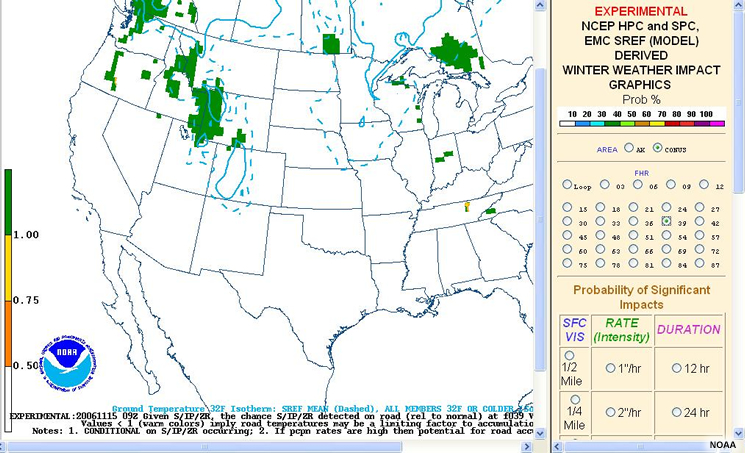
Weather Hazards » Low Visibility
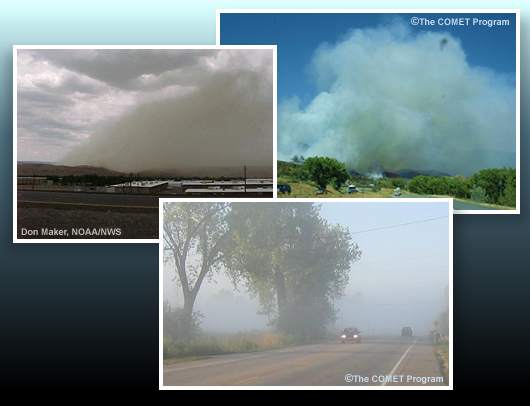
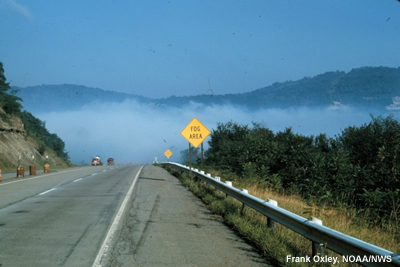
So far, we have covered scenarios in which rain or snow can impact road conditions, and these can also reduce visibility. Let us now look at some other situations that can affect visibility and make travel difficult. In this section, we'll talk about fog, smoke, and dust or sand storms.
Weather Hazards » Low Visibility » Fog
Examples:
Dense Fog Advisory |
Freezing Fog
Advisory
Fog is essentially a cloud at or near ground level. It forms when moist air near the ground cools until it reaches saturation. The cooling may occur in several different ways, and local terrain features often play an important role.
This graphic depicts the common ways by which fog forms. Depending on the part of the country you are in, one or several types of fog formation may prevail.
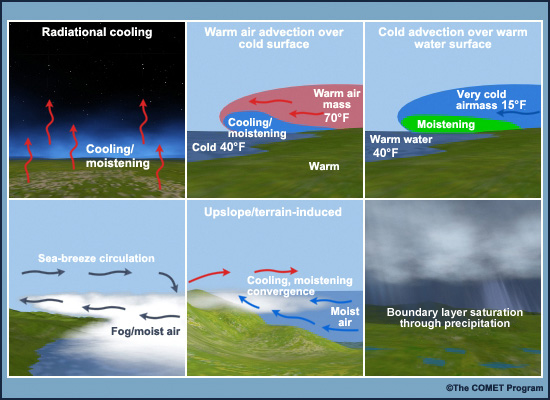
One of the main ways fog is created is through radiational cooling (top left). At night, the earth's surface radiates heat and cools the air near the ground to the dewpoint. Fog formation is most likely under clear skies and light winds when there is a shallow surface layer of relatively moist air beneath a drier layer. This occurs primarily during the night or early morning, especially during late summer and fall. Valley areas are also very prone to developing radiation fog.
During the cold season, fog often forms when warm air flows over a cold surface (top middle). In the central and eastern U.S., this typically occurs when cold or snow-covered ground is invaded by warm, moist air advancing north from the Gulf of Mexico. Similar conditions can produce fog this way at other locations.
Fog can also develop when very cold air moves over warmer water, moistening the cold air until it's saturated (top right). It may then move over the land with the winds (bottom left). Fog is more common over coastal locations where cool or cold coastal waters exist, such as the Northeast and the West Coast.
In areas with significant change in terrain elevation, moist air riding up a slope will cool and may reach saturation, creating fog at higher altitudes (bottom middle).
Another common way that fog can develop is when precipitation saturates the air near the surface (bottom right). Fog can form either as the precipitation is falling, or later when the clouds clear and the increased moisture results in radiation fog during the night and early morning.
Fog can have an adverse impact on traffic when it reduces horizontal visibility below ¼ mile over a significant area. In these cases, the NWS issues a "Dense Fog Advisory (see example below)." If the temperatures are expected to be below freezing, a "Freezing Fog Advisory" would be issued, and you could expect black ice on roads.
Weather Hazards » Low Visibility » Smoke
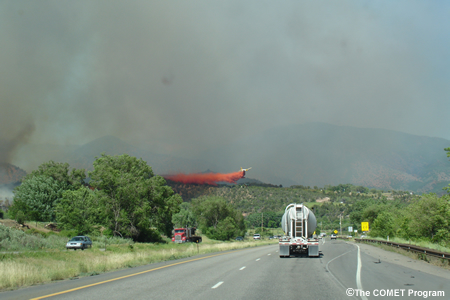
Wildfires occur in many parts of the country where there is ample fuel and dry conditions. Often, they are started by lightning and can quickly grow out of control if spread by high winds. These fires can create visibility problems (e.g., sudden stretches of near zero visibility) on roads and are of special concern for high traffic, high speed flow on interstates. Highway crews may need to place road closure signs in dangerous fire or low visibility areas.
Widespread, prolonged poor visibility due to smoke will most likely be addressed by the NWS in a Hazardous Weather Outlook.
BROKEN LINK and old pics, Satellite Fire Detections viewer is no longer supported at NOAA's National Centers for Environmental Information. Referred to https://www.ncei.noaa.gov/maps-and-geospatial-products but no smoke/fire viewers here.
One tool that might be helpful is a NOAA website (https://www.ospo.noaa.gov/Products/land/fire.html) that displays hot spots and smoke detected with the GOES satellite. You can zoom in by clicking on the map, and you can display Interstates and county boundaries.
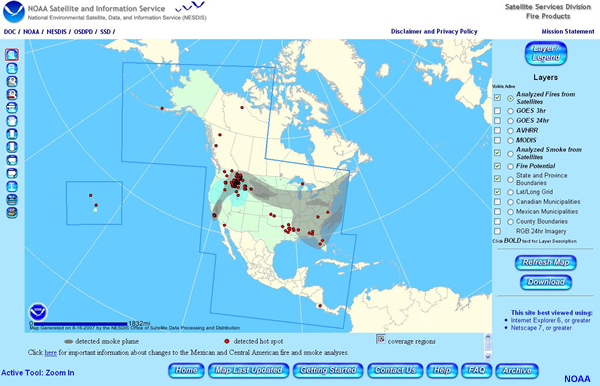
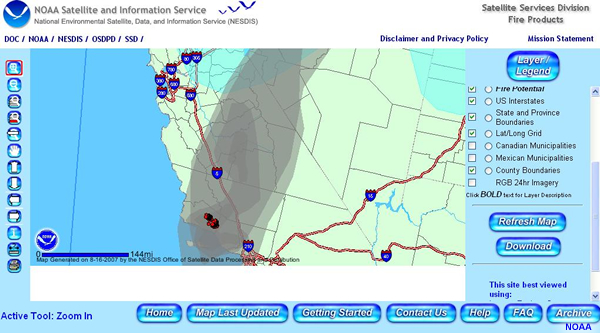
Weather Hazards » Low Visibility » Dust or Sand Storms
Examples:
Blowing Dust Advisory
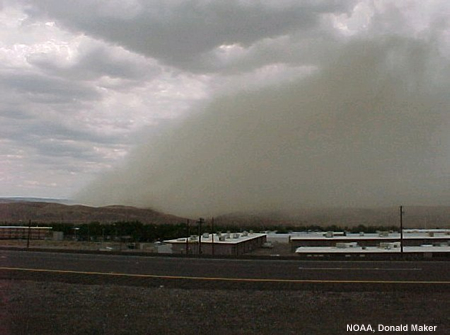
Extremely dry conditions, combined with strong winds, can result in blinding sand or dust storms and can cause multi-vehicle accidents. Usually, sustained winds of 25 mph or greater are required. In these cases, you may need to post road closure signs. However, preventative actions may be difficult unless the event is caused by a fairly large-scale weather pattern that is easily identified and lasts for a period of time.
The National Weather Service issues two blowing dust products. A "Blowing Dust Advisory" indicates that widespread or localized blowing dust will reduce visibility between 1 mile and a ¼ mile. A "Dust Storm Warning" is issued when visibility is expected to be less than ¼ mile.
Weather Hazards » Winds
Examples:
Wind Advisory | Severe
Thunderstorm Watch | Severe Thunderstorm Warning | Hurricane Winds
Additional Resources:
The National Hurricane Center
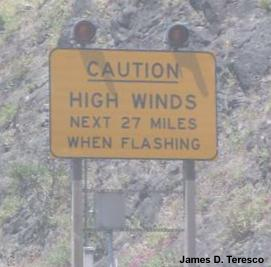
High winds can cause not only visibility problems for travelers, but can also blow vehicles off the road. Predicting high winds is particularly difficult because these events are often localized and are influenced by a number of factors, such as:
- How strong the pressure gradient is between different air masses
- Whether high winds aloft can mix down to the surface
- The presence of thunderstorms that can produce gusty surface winds, or
- How local terrain channels or blocks flow
In the Rocky Mountains, high winds are usually associated with strong westerly flow and may occur in otherwise fair weather conditions. This flow increases in speed as the winds are channeled through mountain valleys. Santa Ana winds in southern California occur when high pressure builds over the Great Basin. The circulation brings winds from the east through the mountain passes toward the coast. The cold air warms and the relative humidity decreases significantly as the air descends (see figure below). High wind events typically last for about 6 hours, but in the Rocky Mountains and with Santa Ana winds, they can last 24 hours or longer.
Advisories and warnings are issued for large-scale wind events (as opposed to gusty winds from thunderstorms). Both the "Wind Advisory" and the "High Wind Warning" criteria are defined by your local NWS office, but generally an advisory is issued for winds between 30-39 mph and a warning is issued for winds above 40 mph or gusting above 60 mph.
Thunderstorms can produce strong winds, but winds from these storms aren't specifically forecast. The "Severe Thunderstorm Watch" and "Severe Thunderstorm Warning" products always mention the possibility of high winds (examples in section 6.2.4).
High winds are also associated with hurricanes and their remnants. The National Hurricane Center 's website (www.nhc.noaa.gov) provides forecasts for these winds.
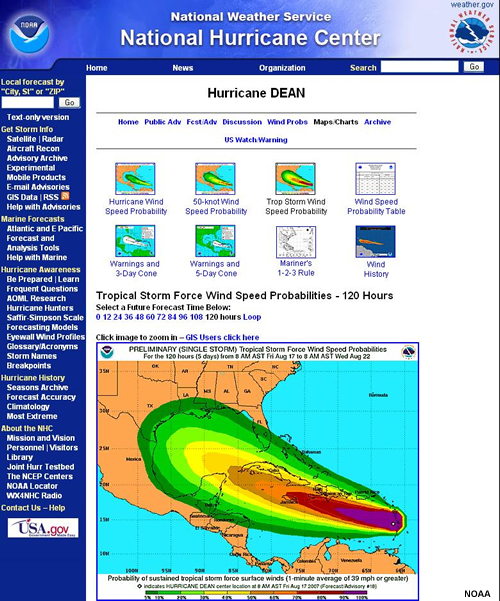
Weather Hazards » Winds » Wind Chill
Examples:
Wind Chill
Advisory
The wind chill temperature is an indication of how cold people feel based on heat loss from exposed skin caused by wind and cold. As the wind increases, it draws heat from the body, driving down skin temperature and eventually the internal body temperature. Therefore, the wind makes it feel much colder than the actual temperature. For example, if the temperature is 0°F and the wind is blowing at 15 mph, the wind chill is -19°F. At this wind chill temperature, exposed skin can freeze in 30 minutes.
Road crews that must be outside in cold, windy weather should dress in several layers of loose-fitting, lightweight, warm clothing. Outer garments should be tightly woven, water repellent, and hooded, and hats should be worn because half of the body's heat can be lost from the head. Wearing some type of covering over the mouth will help protect the lungs from extreme cold. Workers should avoid overexertion because the heart is already working overtime in cold weather. The strain from heavy labor during cold weather could cause a heart attack, and sweating from overexertion could lead to a chill and hypothermia.
Criteria for issuing "Wind Chill Advisories and Warnings" are set by local WFOs. For example, in the Rochester, NY area, "Wind Chill Advisories" are issued when the wind chill temperature is expected to fall between -15°F and -24°F. "Wind Chill Warnings" are issued when the wind chill temperature is expected to fall at or below -25°F.
Weather Hazards » Extreme Events
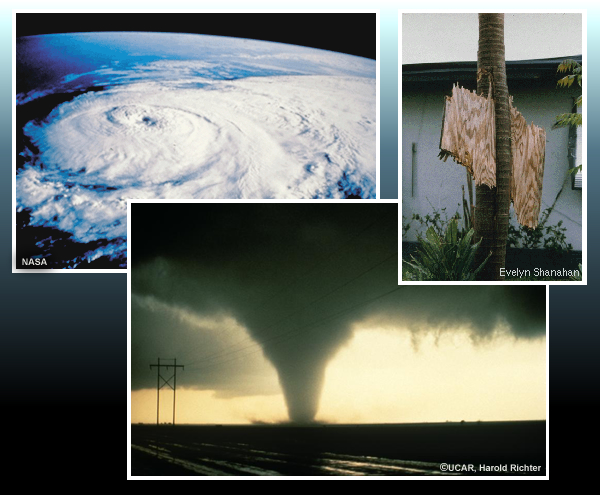
While most of your decisions related to weather will be in the context of snow, heavy rain, flooding, or low visibility, certain extreme weather events can also impact transportation. While we won't go into depth, we'll close this section by mentioning the road impacts caused by tropical cyclones and tornadoes.
Weather Hazards » Extreme Events » Tropical Cyclones
Additional Resources:
The National Hurricane Center
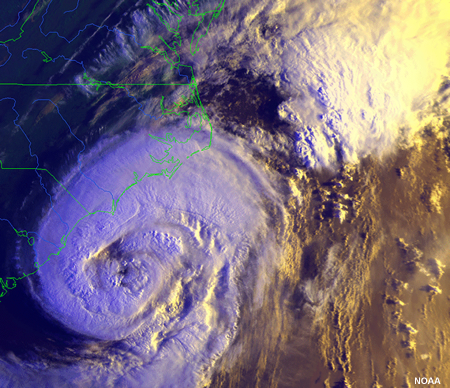
The term "tropical cyclone" encompasses tropical depressions, tropical storms, and hurricanes, and it should be noted that any of these—not just hurricanes—can create numerous road hazards. Flooding can destroy roads, bury them under feet of sand, or inundate them under water for hours or days. More importantly, flooding is the leading cause of death from tropical cyclones. Significant debris from wind damage, storm surge, or flooding also requires clean up by road crews. Additionally, hurricane evacuations depend on moving large numbers of cars out of threatened areas. Emergency managers need to take into account road construction and repairs to ensure that evacuation routes are passable.
Monitoring forecasts during hurricane season and planning deployment strategies days in advance will help mitigate the impact on resources. The National Hurricane Center's website (www.nhc.noaa.gov) provides information in advance of a storm. Local NWS offices serving the Gulf and East Coast issue a product called the "Hurricane Local Statement," which provides information on all the impacts expected from the tropical cyclone on that local area.
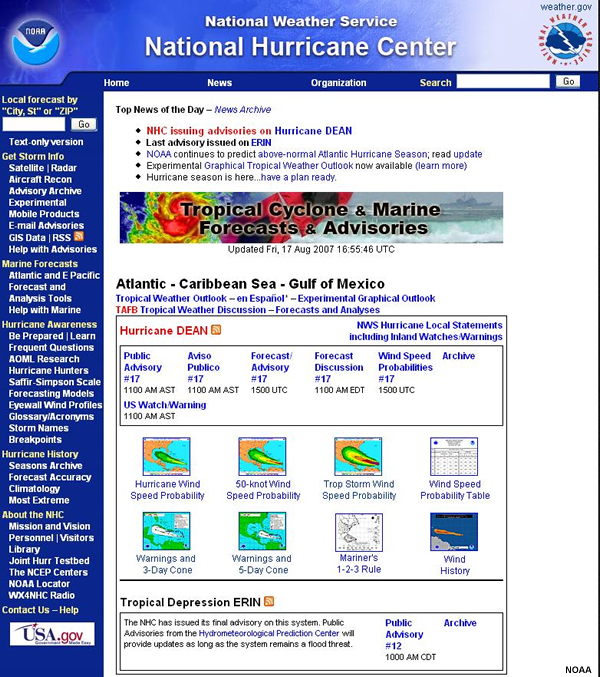
Weather Hazards » Extreme Events » Tornado Outbreaks
Additional Resources:
NWS Storm Prediction Center
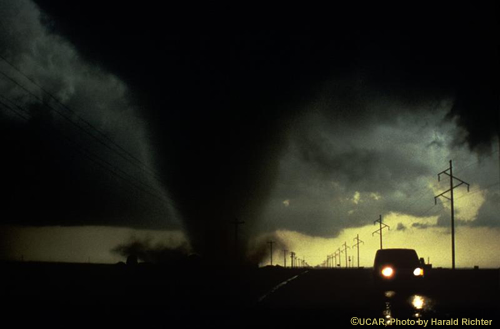
Tornado outbreaks, resulting in numerous tornadoes in a day, usually happen only a few times a year. Outbreaks usually occur in the nation's midsection from spring to fall or across the Gulf Coast at any time of year. The larger outbreaks are usually predicted several days in advance. The graphics initially displayed on the www.weather.gov site and the NWS Storm Prediction Center's website (http://www.spc.noaa.gov/) provide information on expected severe weather. Additional information is available from your local NWS office.
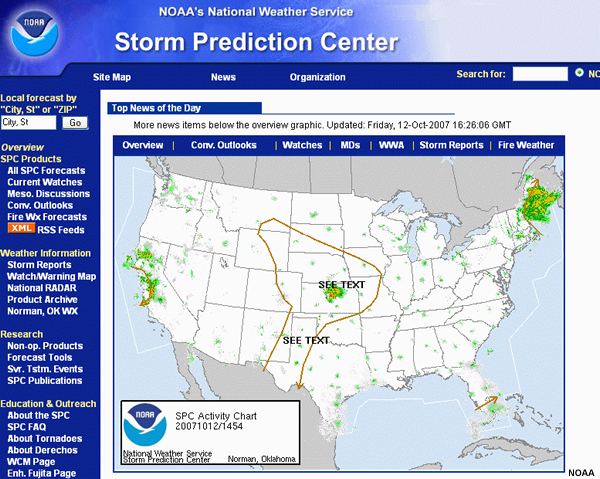
Weather Hazards » Questions
Question
Select the appropriate product (watch, warning, advisory) for the given situation.
a) A Lake Effect Snow Warning is for more than 6 inches in 12 hours. b) A High Wind Advisory is generally issued for winds between 30-39 mph. c) There is no product called a Low Visibility Advisory. d) Watches are issued farther in advance than a few hours. e) Flood Watches are issued for more gradual flooding events.
Concluding Remarks
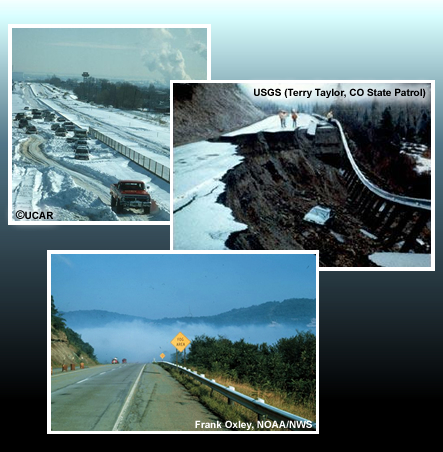
We have completed a review of available weather information, including data sources, types of hazards, and NWS products. The bottom line is that the weather forecasting job is a difficult one, much like keeping the roads plowed during a blizzard. If you make looking at weather data and forecasts part of your regular routine, you'll become more proficient at identifying potential weather-related problems in advance. Also, remember to look at a variety of data sources. Meteorologists review as much information as possible before making a forecast, and you should too. This includes talking with your local NWS forecasters, as well as the private vendors you contract with. Also remember to look at the observations in real-time to determine whether the forecast is verifying as expected.
To be able to make the best decisions related to weather events, our advice is to
- Understand the basics of meteorology
- Understand the hazards in your area for the different seasons
- Understand what forecast products will tip you off to potential problems
- Talk to your NWS office about which weather patterns are likely to mean trouble for you and what forecast products will be most helpful
- Access the forecasts every day and be sure to look for updates when the weather is changing rapidly
- Use multiple sources of information and data
Resources
NWS Websites (Note: These URLs may change)
- List of NWS forecast Offices: http://www.weather.gov/organization.php
- NWS weather portal (www.weather.gov): http://www.weather.gov
- Graphical Forecasts tab http://www.weather.gov/forecasts/graphical/sectors/. Click on map to go to local forecast
- National Maps tab (current and forecast): http://www.weather.gov/outlook_tab.php
- Radar tab: http://www.weather.gov/radar_tab.php. Click on map to go to local radar
- Water tab (river flood information): http://www.weather.gov/ahps/. Click on map to go to local stream data
- Satellite tab: https://www.star.nesdis.noaa.gov/GOES/index.php. Loop controls are below image
- Climate tab: http://www.weather.gov/climate/. Use drop-down boxes above map to choose product or go to Climate Prediction Center (CPC) http://www.cpc.ncep.noaa.gov/products/OUTLOOKS_index.shtml for more climate products
- Local forecasts: click on main map on http://www.weather.gov or enter city/state in the “Local Forecast” box
- Storm Prediction Center (severe weather): http://www.spc.noaa.gov/
- NWS Weather Prediction Center (WPC) (potential for excessive rain): https://www.wpc.ncep.noaa.gov/#page=ovw
- Experimental WPC impact graphics: https://www.wpc.ncep.noaa.gov/wwd/impactgraphics/
- National Hurricane Center: www.nhc.noaa.gov
NWS Forecast Products
- Hazardous Weather Outlooks: Issued every day by the NWS Storm Prediction Center and local NWS weather forecast offices (WFOs). Describe potential for any type of hazardous weather possible in the next seven days. More specific detail on the types, timing, and coverage of hazards provided for events expected within 48 hours.
- Advisories: Issued for events that are occurring or imminent, that can
cause significant inconvenience, and could threaten life and/or property. Examples:
- Flood Advisory: (issued for intersections that are underwater or for spotty lowland flooding)
- Urban and Small Stream Flood Advisory
- Dense Fog Advisory (widespread visibility below a quarter mile)
- Winter Weather Advisory (snow or mixed wintry precipitation below warning criteria)
- Frost Advisory (typically for agricultural concerns but also relevant to frost on roadways)
- Freezing Rain (or Drizzle) Advisory
- Lake Effect Snow Advisories
- Wind Advisory (strong winds that could cause buffeting to cars or loss of control to high profile vehicles)
- Blowing Dust, Blowing Sand, or Smoke Advisory (which reduces visibility below a quarter mile)
- Heat Advisory (high combination of heat and humidity)
- Wind Chill Advisory (combination of cold temperatures and strong winds)
- Watches: Issued when the risk of a hazardous weather or flood event has
increased significantly, but its occurrence, location, and/or timing remains uncertain, and
the NWS forecaster is reasonably confident that the event will reach warning criteria.
Issued 12 to 48 hours before the onset of hazardous weather. Examples:
- Severe Thunderstorm Watch
- Tornado Watch
- Flood Watch
- Flash Flood Watch
- Winter Storm Watch
- Lake Effect Snow Watch
- High Wind Watch
- Hurricane Watch (Could experience hurricane conditions within 36 hours)
- Warnings: Issued when the forecaster is very confident a hazardous weather event will occur within the next 12 to 36 hours. Indicate that a hazardous weather or flood event that poses an immediate threat to life and/or property is occurring, imminent, or is highly likely to occur. Issued for the same events as described for Watches and for the following:
- Winter Storm Warning
- Blizzard Warning (snow and winds are expected)
- Ice Storm Warning
- Dust Storm (Sand Storm) Warning
- Tornado Warning (Issued when a tornado is indicated by an NWS radar or sighted by spotters)
- Hurricane Warning (Sustained winds of at least 74 mph are expected within 24 hours)
Note:
- NWS outlooks and watches precede advisories or warnings.
- NWS weather offices set local warning and advisory criteria for various hazards like heavy snow, fog, high wind, blowing dust, etc. These criteria may vary from one location to another.
- NWS warning criteria may be much different from what you consider hazardous for traffic. Talk to your local forecast office to determine what their criteria are for various weather events and how to best determine when conditions fit your criteria of hazardous weather.
NWS Terms
- Showers: Precipitation will be intermittent and variable in intensity across the area or through time. The terms “rain” and “snow” signify steady precipitation from clouds that cover a much wider area.
- Trace of rain or melted snow: Defined as under 0.01 inch (rain), 0.1 inch (snowfall), .5 inch (snow depth).
- Measurable precipitation: Anything over a trace.
- Slight chance of precipitation: Event has a 10-20% chance of occurring.
- Chance of precipitation: Indicates a 30% to 50% probability of measuring at least 0.01 of an inch of rain or melted snow in a 12-hour period (e.g., 6 AM to 6 PM).
- Likely: Indicates a relatively high likelihood (60% to 70% probability) that at least 0.01 of an inch of precipitation will fall. However, the coverage may not be widespread over the forecast area. A “likely” event could be one that lasts for a long time and impacts a large area, or it could be a line of showers or storms that last only five minutes at any given location. It could be an event yielding only a few hundredths of an inch or several inches.
- Occasional: Signifies an 80% to 100% chance of precipitation in the 12-hour time frame. This event may last steadily for a few hours, be continuous all day or all night, or occur as frequent showers for all or part of the 12-hour period.
- Isolated: If precipitation does occur, about 10-20% of the forecast area will receive it. Low probabilities do not necessarily mean that precipitation amounts will be small.
- Scattered: Implies a coverage that is greater than “isolated” but still limited. When forecasters are fairly confident that precipitation will occur, but expect coverage to be limited, they may choose a phrase like, “Scattered showers. Chance of precipitation, 40%.” This indicates that the forecaster is fairly certain precipitation will occur, but the location and timing may be uncertain, and the coverage is expected to be limited.
Observations
- Surface
- NWS surface observations (ASOS): https://www.weather.gov/asos/
- Other sources: ESS systems, EPA systems, state systems
- Unofficial sources: stations operated by TV stations, schools, etc.
- Note: Data quality may vary, particularly from unofficial sources
- Use to time the movement of systems and to confirm radar and satellite data
- NWS surface observations (ASOS): https://www.weather.gov/asos/
- Radar
- Official NWS radars: http://www.weather.gov/radar_tab.php for national map, click on map to go to local view
- Do not mistake ground clutter for precipitation.
- Find out if the radar beam is blocked in any direction by terrain.
- Remember that snow tends to be fuzzier in appearance when compared to liquid precipitation and is often displayed in white on many non-NWS radar graphics.
- Be aware that very light precipitation such as light snow flurries or drizzle may not be detected by radar.
- Check the data.
- Is it current, or is there some problem and it hasn’t been updated? Do you need to click the page refresh button on your browser or set the loop to automatically update?
- Does it agree with what is being observed on the ground?
- Satellite
- Official NWS source: https://www.star.nesdis.noaa.gov/GOES/index.php
- Visible images: Taken only during daylight
- Infrared images: Available day or night
- Loop satellite images over several hours to see changes in storm movement, growth, extent, intensity
- Distinguish cloud cover from snow or fog on ground
- Use other tools (radar, surface observations) to determine the significance of what the satellite images show
Contributors
COMET Sponsors
This module was developed with funding from the Federal Highway Administration (FHWA) in close coordination with the NOAA National Weather Service (NWS) Surface Weather Program.
MetEd and the COMET® Program are a part of the University Corporation for Atmospheric Research's (UCAR's) Community Programs (UCP) and are sponsored by
- NOAA's National Weather Service
(NWS)
with additional funding by: - Bureau of Meteorology of Australia (BoM)
- Bureau of Reclamation, United States Department of the Interior
- European Organisation for the Exploitation of Meteorological Satellites (EUMETSAT)
- Meteorological Service of Canada (MSC)
- NOAA National Environmental Satellite, Data and Information Service (NESDIS)
- NOAA's National Geodetic Survey (NGS)
- National Science Foundation (NSF)
- Naval Meteorology and Oceanography Command (NMOC)
- U.S. Army Corps of Engineers (USACE)
To learn more about us, please visit the COMET website.
Project Contributors
Project Lead
- Dr. Vickie Johnson — UCAR/COMET
Instructional Design
- Dr. Vickie Johnson — UCAR/COMET
Principal Science Advisor
- David Tucek — NWS Weather Forecast Office, Indianapolis, IN
Additional Contributors
- John Ogren — NWS Central Region Headquarters
- Paul Pisano — FHWA
- Andrew D. Stern — Noblis, Inc.
Computer Graphics/Interface Design
- Steve Deyo — UCAR/COMET
- Brannan McGill — UCAR/COMET
Multimedia Authoring
- Carl Whitehurst — UCAR/COMET
Audio Editing/Production
- Seth Lamos — UCAR/COMET
Audio Narration
- Dr. Greg Byrd — UCAR/COMET
COMET HTML Integration Team 2020
- Tim Alberta — Project Manager
- Dolores Kiessling — Project Lead
- Steve Deyo — Graphic Artist
- Gary Pacheco — Lead Web Developer
- David Russi — Translations
- Gretchen Throop Williams — Web Developer
- Tyler Winstead — Web Developer
COMET Staff, Summer 2008
Director
- Dr. Timothy Spangler
Deputy Director
- Dr. Joe Lamos
Business Manager/Supervisor of Administration
- Elizabeth Lessard
Administration
- Lorrie Alberta
- Michelle Harrison
- Hildy Kane
Graphics/Media Production
- Steve Deyo
- Seth Lamos
- Brannan McGill
Hardware/Software Support and Programming
- Tim Alberta, Supervisor
- James Hamm
- Ken Kim
- Mark Mulholland
- Wade Pentz (Student)
- Dan Riter
- Carl Whitehurst
- Malte Winkler
Instructional Design
- Dr. Patrick Parrish, Production Manager
- Dr. Alan Bol
- Lon Goldstein
- Bryan Guarente
- Dr. Vickie Johnson
- Bruce Muller
- Dwight Owens (Alphapure Design Studio)
- Marianne Weingroff
Meteorologists
- Dr. Greg Byrd, Project Cluster Manager
- Wendy Schreiber-Abshire, Project Cluster Manager
- Dr. William Bua
- Patrick Dills
- Dr. Stephen Jascourt
- Matthew Kelsch
- Dolores Kiessling
- Dr. Arlene Laing
- Dr. Elizabeth Mulvihill Page
- Warren Rodie
- Amy Stevermer
- Dr. Doug Wesley
Science Writer
- Jennifer Frazer
Spanish Translations
- David Russi
NOAA/National Weather Service - Forecast Decision Training Branch
- Anthony Mostek, Branch Chief
- Dr. Richard Koehler, Hydrology Training Lead
- Brian Motta, IFPS Training
- Dr. Robert Rozumalski, SOO Science and Training Resource (SOO/STRC) Coordinator
- Ross Van Til, Meteorologist
- Shannon White, AWIPS Training
Meteorological Service of Canada Visiting Meteorologists
- Phil Chadwick