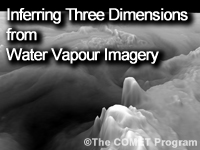
Satellite Feature Identification: Inferring Three Dimensions from Water Vapour Imagery
Languages: English, French, Spanish
Optional
Publish Date: 2013-06-25
Last Updated On: 2013-05-22
Skill Level: 2
Completion Time: .50 - .75 h
Topics:
Satellite Meteorology
(253 ratings)We think in three-dimensional space and a fourth dimension, time. Therefore, we should think about the atmosphere in similar terms. However, we are often stuck with two-dimensional maps. Water vapor imagery can help us break out of that flatland and move to more ... Read more »
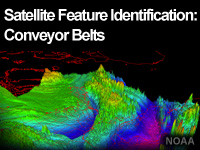
Satellite Feature Identification: Conveyor Belts
Languages: English, French, Spanish, German
Optional
Publish Date: 2014-03-18
Last Updated On: 2017-02-13
Skill Level: 2
Completion Time: .50 - .75 h
Topics:
Satellite Meteorology
(236 ratings)Conveyor belts highlight important atmospheric processes that can be advantageous for making forecasts. They can be used for identifying general temperature patterns, defining the extent of cloud cover, predicting moisture return, evaluating stability, forecasting wind ... Read more »
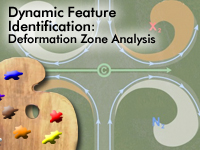
Deformation Zone Analysis
Languages: English, Spanish, French
Optional
Publish Date: 2007-03-22
Skill Level: 2
Completion Time: 1.25 - 1.50 h
Topics:
Aviation Weather, Satellite Meteorology
(231 ratings)The quick analysis of deformation zones provides an overview of system-relative atmospheric circulations. Since deformation is a primary factor in frontogenesis and frontolysis, understanding of these system-relative circulations is crucial to the diagnosis of atmospheric ... Read more »
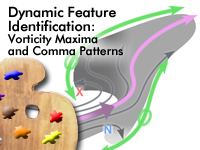
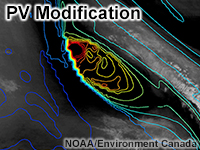
Vorticity Maxima and Comma Patterns
Languages: English, Spanish, French
Optional
Publish Date: 2006-05-22
Skill Level: 2
Completion Time: 1.25 - 1.50 h
Topics:
Aviation Weather, Satellite Meteorology
(323 ratings)Vorticity maxima signatures are very common and indicate areas of ascending circulation and atmospheric forcing. The correct placement of vorticity maxima is vital to the placement of related dynamic features such as the axis of maximum winds and deformation zones. This ... Read more »
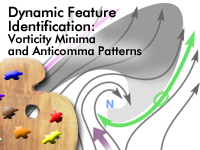
Vorticity Minima and Anticomma Patterns
Languages: English, French, Spanish
Optional
Publish Date: 2006-05-22
Skill Level: 2
Completion Time: 1.00 - 1.25 h
Topics:
Satellite Meteorology
(181 ratings)Vorticity minima signatures are common features of the atmosphere. They indicate areas of descending circulation and atmospheric forcing and can be used to diagnose dynamic features such as the axis of maximum winds and deformation zones. This module provides insight on the ... Read more »