Module Print Version
Table of Contents
- Section 5: Predictions
- 5.1 Drought Outlook
- 5.2 Inputs for Drought Outlook
- 5.3 Palmer Drought Index
- 5.4 Soil Moisture Forecast
- 5.5 Temperature Forecast
- 5.6 Seasonal Precipitation Outlook
- 5.7 Short Term Forecasts
- 5.8 Verification
- 5.9 Verification, cont.
- 5.10 Improvement of Predictability
- 5.11 Other Drought Forecasts
- 5.12 Other Drought Forecasts, cont.
Section 1: Introduction
1.1 Introduction
Welcome to the National Weather Service Professional Development Series entitled "Understanding Drought."
1.2 Audience and Purpose
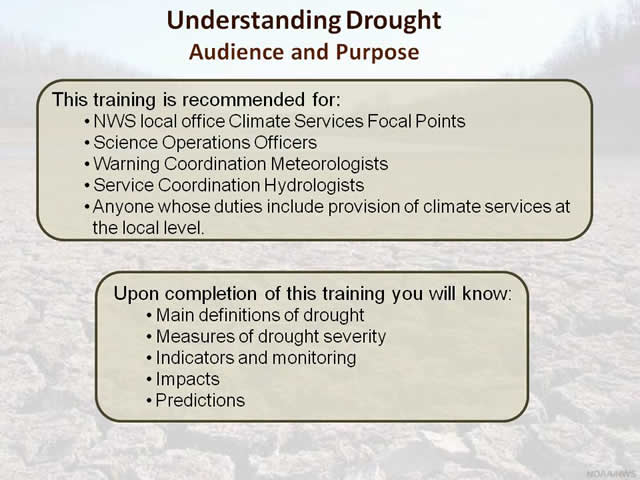
This training module has been prepared for field staff in the National Oceanic and Atmospheric Administration's (or NOAA's) National Weather Service. The training will provide a basic understanding of drought, how it is monitored and predicted, how its impacts can be assessed, and how staff can help communicate about drought in general.
1.3 Goals
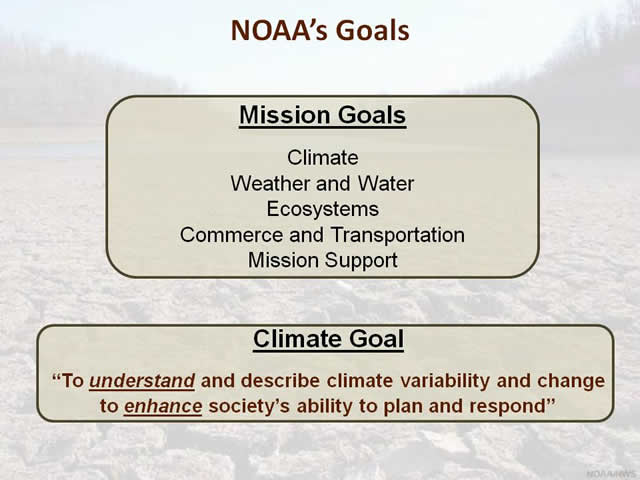
Drought impacts society and touches upon the five NOAA mission goals which are Climate, Weather and Water, Ecosystems, Commerce and Transportation, and Mission Support. From prediction to reducing vulnerability, understanding drought helps us meet the goal of NOAA's Climate Program, which is:
"To understand and describe climate variability and change to enhance society's ability to plan and respond."
1.4 Partnerships
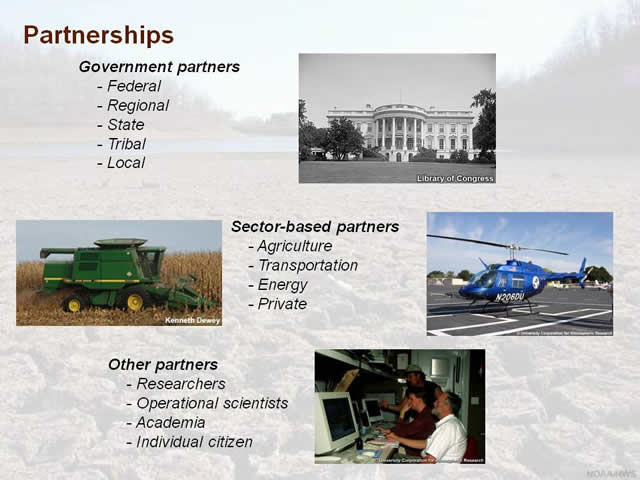
Drought does not respect political boundaries and it crosses multiple socioeconomic sectors. This means that
partnerships must be established to understand and respond to drought. Partners in understanding drought
include federal, regional, state, tribal and local governmental entities. There are also sector-based
interests such as agriculture, transportation, and energy. On a smaller scale, partnerships are needed with
researchers, operational scientists, academia, and other educators while also including the individual
citizen.
1.5 Key Contributors
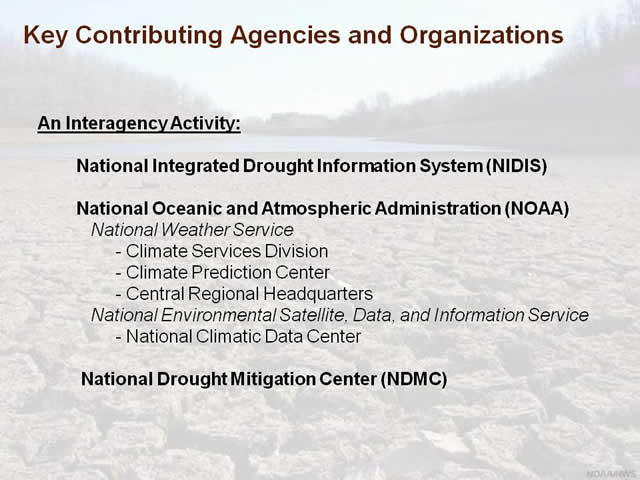
Simply establishing partners in an ad-hoc fashion is not sufficient to effectively deal with drought, thus an integrated approach is required. Through the National Integrated Drought Information System (or NIDIS), collaborative opportunities for effective partnerships are possible. Key players in NIDIS include NOAA and the National Drought Mitigation Center in Lincoln, Nebraska. Many other agencies and entities also play an active role in NIDIS.
1.6 Outline
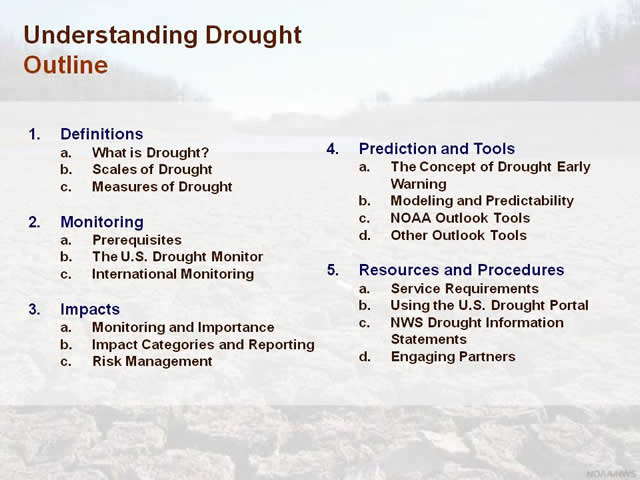
There are five areas where this training module will be focused. Relevant definitions will be listed, monitoring and impacts of drought will be discussed, followed by prediction and tools forecasters use, and finally resources and procedures. Taken together, the training will ensure that a National Weather Service Forecast Office, Regional Office, or River Forecast Center may successfully convey the importance of understanding drought to colleagues, partners, and the public. We will begin by talking about definitions associated with drought.
Section 2: Definitions
2.1 What is Drought?
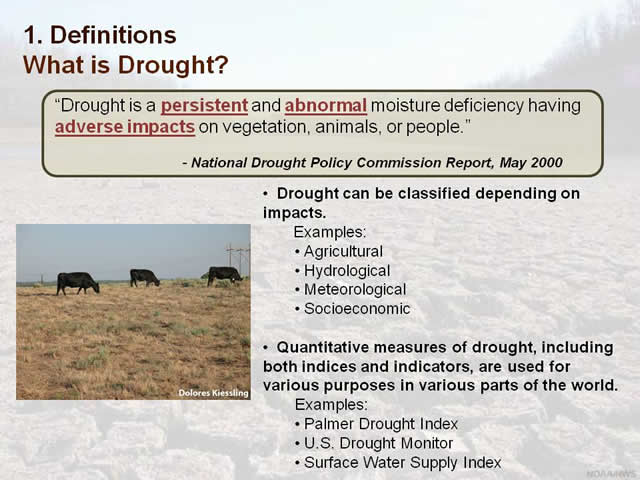
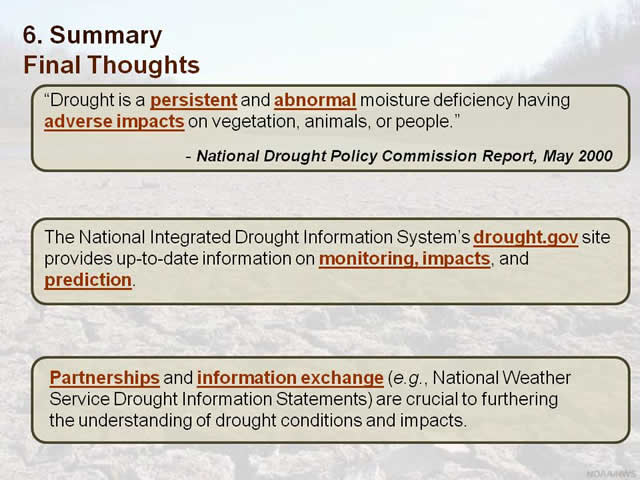
Let start with the simple question of "What is drought?" In short, moisture deficiency is a necessary but not sufficient element in defining drought. The deficiency must be abnormal and persistent, and there must be some adverse impact. Typically, drought has an adverse impact on a well-defined sector - be it agricultural, hydrological, or forest and rangeland resources.
Establishing the presence of drought is both a science and an art. Quantitative indices and indicators are important for a broad perspective of moisture deficiency over a region. This information must be combined with 'on-the-ground' reports of drought impacts to fully characterize a given drought condition. As we will see, these combined objective measures and expert inputs underpin the state-of-the-art drought monitoring system in the United States today.
2.2 Societal Impacts
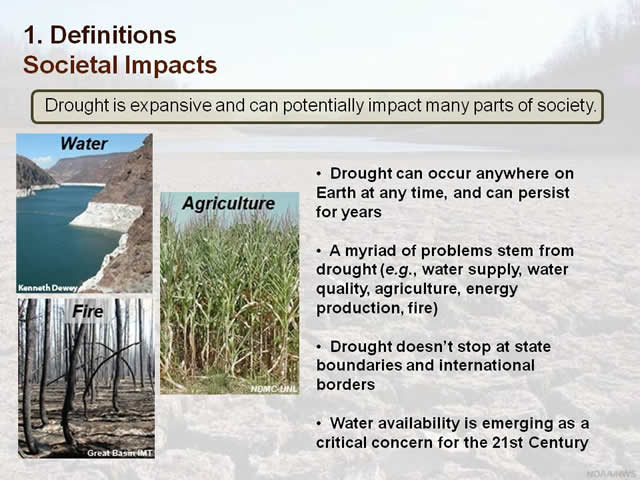
Drought is a natural phenomenon and a normal part of our climate. It can develop anywhere on Earth and can last for a long time. It contributes to water scarcity that can impact all parts of our society. In fact, according to the World Health Organization, in 2008, water scarcity is a life-or-death threat to 4 out of every 10 people. In the United States, approximately 15 to 20 percent of the country is in drought at any one time. Water availability clearly promises to be a key societal concern in the 21st Century.
2.3 The "Creeping Disaster"
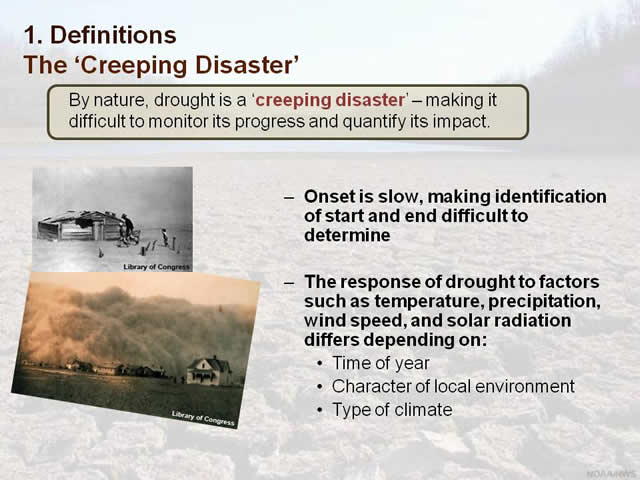
Drought is often called the 'creeping disaster.' Its onset and end are often not realized with any real accuracy until long after the event has come and gone. This is a great challenge and frustration for forecasters, but also for planners and resource managers at all levels. Droughts differ in their characteristics depending upon the time of year, the local environment, and the type of climate.
2.4 Time Scales of Drought

Drought can occur at all time scales - from the 'flash drought' that comes into existence in a matter of weeks that hampers crop development – to multi-decadal droughts that can threaten whole civilizations (like the 13th Century Anasazi in present-day New Mexico). The time scales of drought are influenced by meteorological and other conditions on the ground. Environmental patterns, like El Nino, can cause natural feedback cycles that can reduce, maintain, or even enhance drought.
2.5 Paleoclimate Evidence
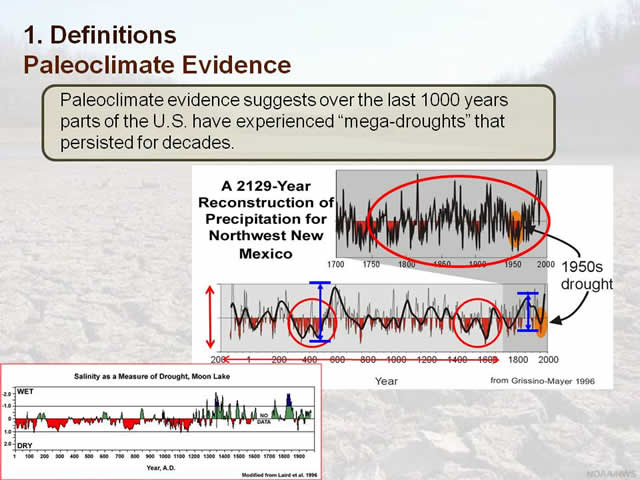
A look back in time helps us better understand how droughts unfold. While we only have about 150 years of good instrument records (like direct precipitation measurements using rain gauges), we can look back many centuries using paleoclimate data. Paleoclimate data are natural recordings of moisture deficit using indirect (or so-called proxy) measurements such as the thickness of tree rings or the chemical makeup of sediments at the bottoms of oceans and lakes. Shown here are plots of tree ring and salinity levels that serve as proxy measures. Nature, as a living organism, is a steadfast observer of remarkable droughts that have occurred in the past that are not part of the instrumental record.
In many cases, the range of variability in the paleoclimate record is far greater than what is in the historic record. It can help us to conceive of extremes we may face in the future, particularly given that climate scientists are beginning to warn us that the past may no longer be a reliable guide to the future.
If the old adage that 'past is prologue' holds, knowing conditions of moisture deficit in the distant past for a given location can help us assess the relative vulnerability of that location for a recurrence of a similar drought in the future.
2.6 Spatial Scales
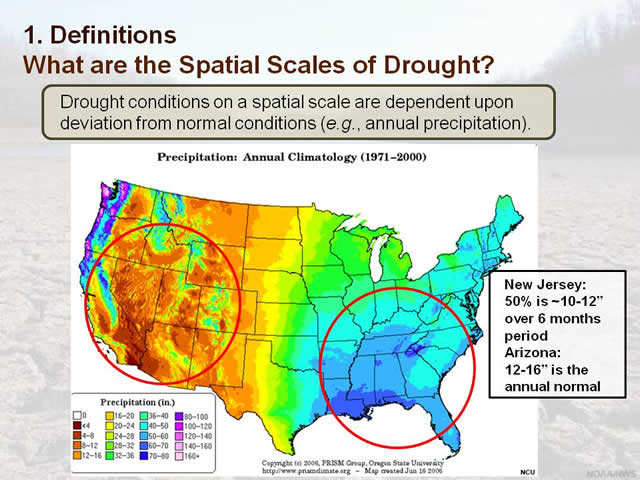
As an abnormal moisture deficit, drought is typically measured against a 'benchmark', such as a thirty-year average of precipitation, or so-called normal. Using such benchmarks, it is clear that some areas of the United States are much drier than others. This means that the hurdle for reaching an abnormal deficit leading to the onset of drought differ substantially from one region to another. For example, 50 percent of normal rainfall over 6 months would be a notable drought in New Jersey, while the same percent of normal in Arizona might be only unusually dry.
2.7 Spatial scales, cont.
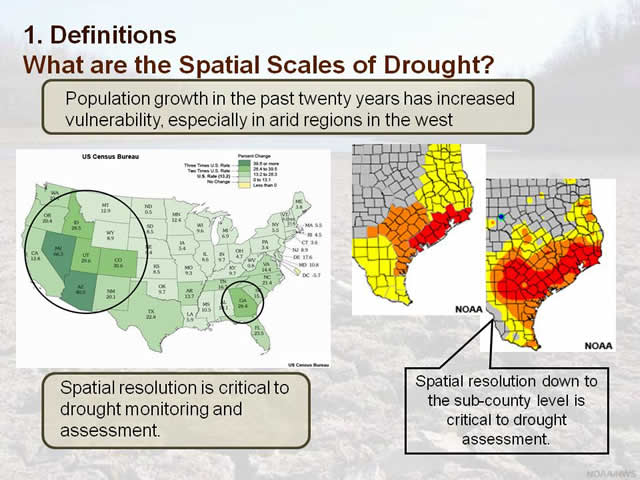
Population growth in the United States in recent decades has been concentrated in the so-called 'sunbelt' areas of the southwest and southern parts of the country. Areas in the western U.S. are especially vulnerable to experiencing lengthy and severe droughts, with significant societal vulnerability due to population growth, unregulated water use, and limited water availability in this part of the country. By considering paleoclimate data, it is clear that portions of the west regularly have multi-year droughts.
When considering the spatial extent of drought, it is important to recognize the wild variability in the severity of drought that can occur over a short distance, due to terrain, weather patterns, and other effects. This underscores the need for good observations at the highest possible spatial resolution. For many socioeconomic applications, spatial resolution down to the county or even sub-county level is needed.
2.8 Observations
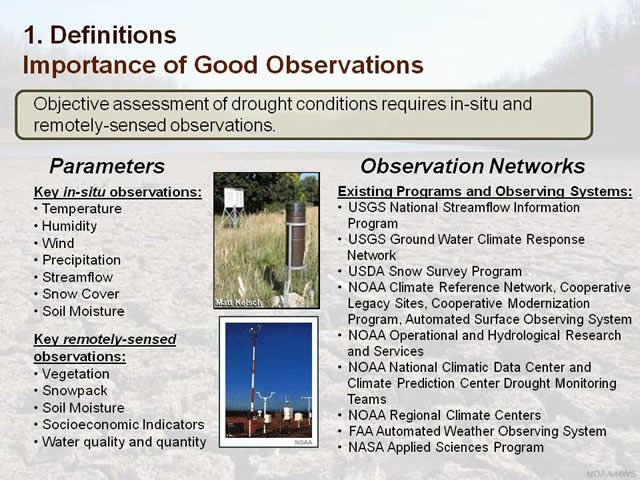
Our ability to understand drought over time and space is dependent upon accurate observations. Observations of different parameters, like on-the-ground (or in-situ) measurements of temperature, humidity, wind, and precipitation are important. Likewise, other in-situ measures of moisture deficit such as streamflow, snow cover, and soil moisture provide additional points of reference for monitoring and prediction. Remotely-sensed measures of moisture deficit, like vegetation indices, help fill important gaps where ground-based measures are not available. Taken together, individual observations contribute to observation networks that, in turn, can be used to develop drought indices, run forecast models, and underscore assessment studies.
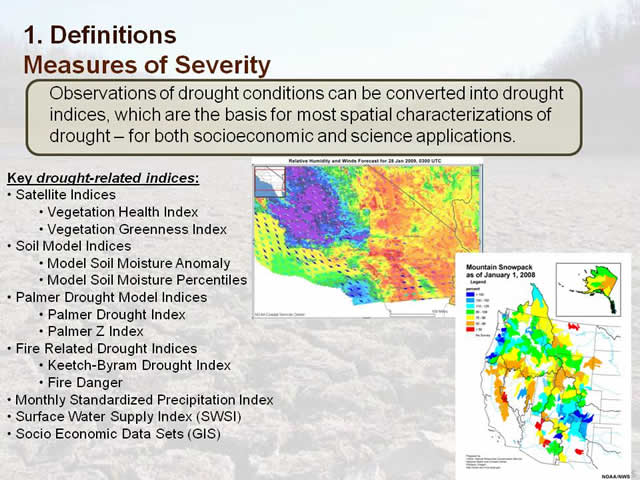
2.9 Measures of Severity
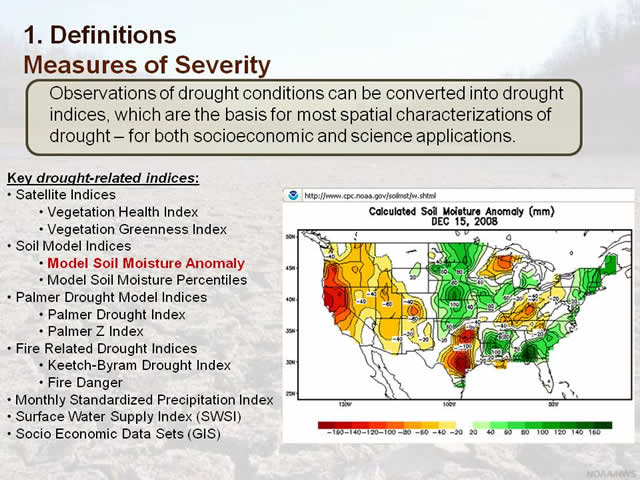
We are all familiar with rating items or events on a scale of 1 to 10. When we do this, we are, in fact, creating an index. Indices are particularly helpful in understanding drought because they allow a large volume of data to be boiled down to a number that represents a measure of severity while offering 'apple to apple' comparisons over space and time. Listed here are the key drought-related indices used by drought experts as they assess drought and its impact.
In defining moisture deficit conditions leading to drought, observation network data can be weighted in innumerable ways to yield indices that address specific applications.
For example, short-term humidity and wind conditions might be emphasized in assessing risk of wildland fire, while snow cover in the Sierra Nevada Mountains might be emphasized to characterize the longer-term risk of hydrological shortfalls in California some months later.
Indices are also extremely valuable in monitoring and assessment as they can be spatially compared with
socioeconomic indicators (such as population centers and croplands) to determine general impacts. They can
also be used to place a drought in a historical perspective (such as comparing 1895 to the present).
Simplicity, flexibility, reliability, and relevance are all hallmarks of good drought indices.
This ends our discussion on definitions. Let's move on and discuss the importance of monitoring with regard to drought.
Section 3: Monitoring
3.1 Collaborations
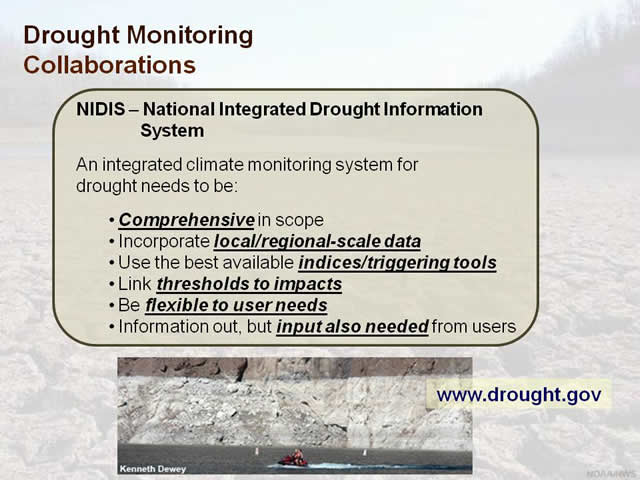
NIDIS – the National Integrated Drought Information System – is an interagency project to foster good communication of drought-related issues. Integration and coordination are never easy, and require fertile ground for cultivating collaborations. "Drought.gov" is a starting point for this collaboration, as it brings together many indices and indicators of drought through customizable tables and maps. National Weather Service field offices can contribute to NIDIS by learning more about "drought.gov" and promoting the tools and resources available there.
3.2 Data and Information Inputs
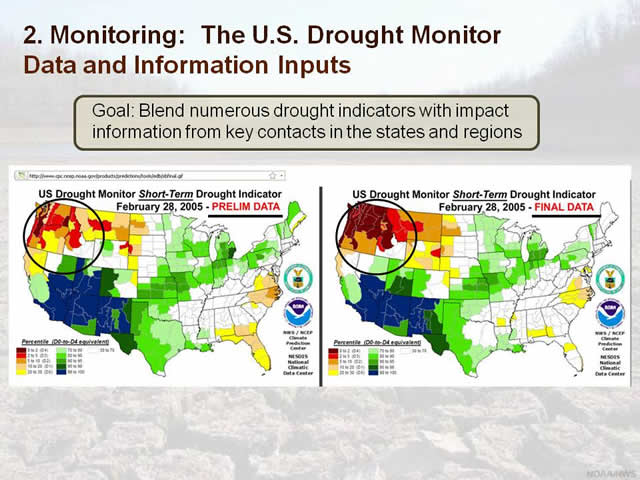
Drought monitoring is challenging in a number of ways. Not only are accurate data required, but they are required in near real-time (within a day or so) for incorporation into monitoring assessments, forecast models, and alerts for the public. Delayed information can cause incorrect identification of drought severity, as shown here by underrepresented drought intensity in the preliminary map for the Northwest U.S.
3.3 Formats and Product Interpretation
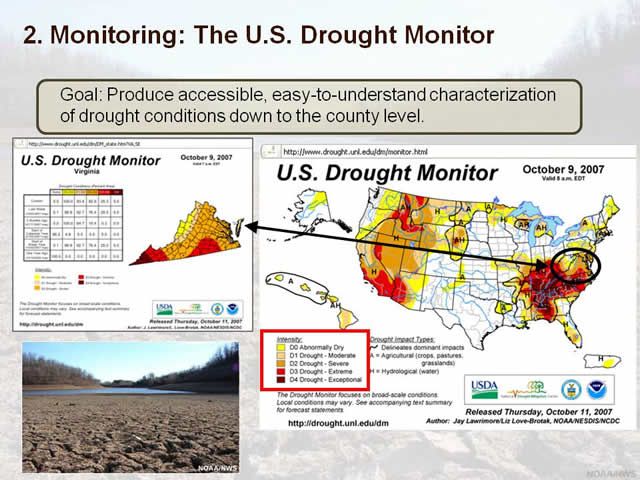
Over the past decade, the U.S. Drought Monitor has emerged as a powerful and respected tool for characterizing drought in the United States. The Drought Monitor is well-established as an authoritative instrument for drought assessment because of its timeliness with weekly releases, its multi-agency effort (such as the USDA, NOAA, and the National Drought Mitigation Center) and professional development combining indices, indicators, and objective blends of data. Further, with drought expert input and oversight from nearly 250 people in the field, the monitor is thoroughly vetted by scientists on a weekly basis. One of the keys to the success of the monitor is its use of a drought intensity scale similar to the Enhanced Fujita scale for tornadoes and Saffir-Simpson scale for hurricanes.
3.4 U.S. Drought Monitor
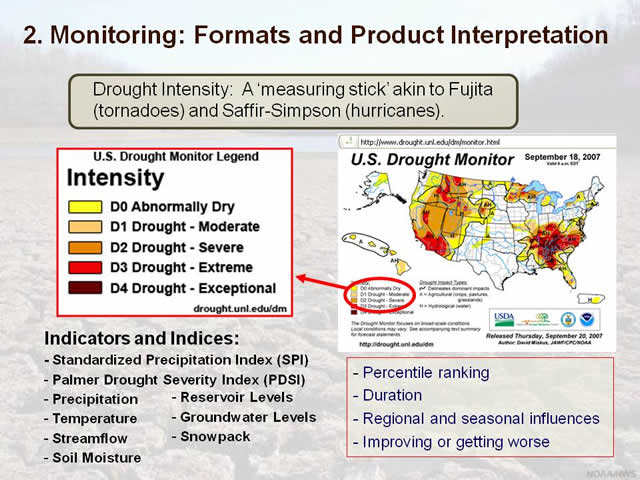
The U.S. Drought Monitor's intensity scale is based upon drought impact guidelines, indicators, and index and model thresholds taken into consideration every week by rotating drought monitor authors. Examples of basic input indicators and indices include the Standardized Precipitation Index, or SPI, Palmer Drought Severity Index or PDSI, precipitation, temperature, streamflow, soil moisture, reservoir levels, groundwater levels and snow pack. A percentile ranking approach serves as the objective scientific backbone allowing the authors to compare different parameters having different units and lengths of record regardless of location. In addition, duration and both regional and seasonal influences are taken into account, as well as whether a given location is improving or getting worse in terms of drought condition. So let's summarize the different intensity levels of the Drought Monitor.
3.5 Intensity Level D0
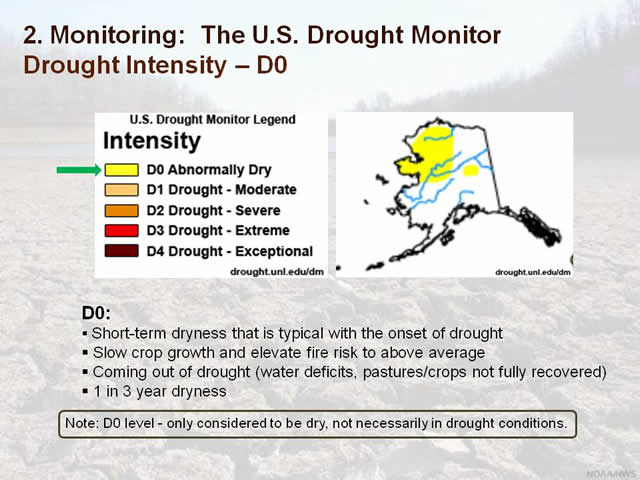
An intensity level of D zero corresponds to 'Abnormally Dry' conditions. At this level, an area experiences short-term dryness that is typical with the onset of drought. Such dryness can slow crop growth and elevate fire risk to above average. This level also refers to an area coming out of drought, with lingering water deficits and pastures or crops not fully recovered. D zero is noted when a convergence of indicators fall into the 30th percentile. In other terms, this equates to roughly a 1 in 3 year dryness. : Note that for the D0 level, the area in question is only considered to be dry, not necessarily in drought conditions.
3.6 Intensity Level D1
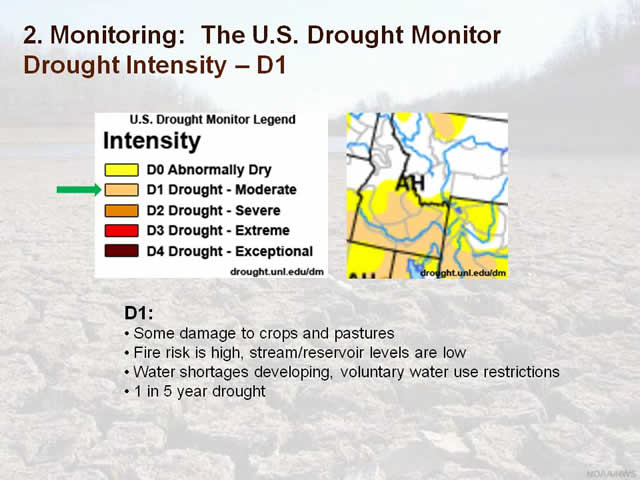
An intensity level of D1 corresponds to 'Moderate Drought' conditions. At this level, some damage to crops and pastures can be expected. Fire risk is high, while stream, reservoir, or well levels are low. Some water shortages are developing or imminent and voluntary water use restrictions could be requested. In terms of percentile rankings, D1 is the first "drought" class and falls into the 20th percentile, or a 1 in 5 year type event.
3.7 Intensity Level D2

An intensity level of D2 corresponds to 'Severe Drought'. At this level, crop or pasture losses are likely, fire risk is very high, water shortages are common, and water restrictions are typically voluntary or mandated. This category is the 10th percentile, which roughly equates to a 1 in 10 year drought.
3.8 Intensity Level D3
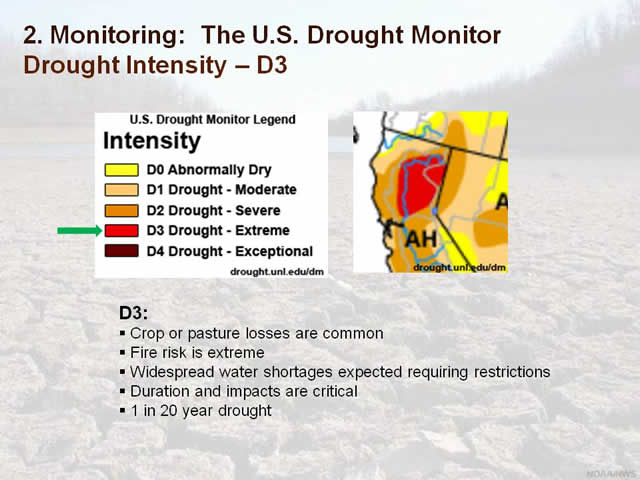
An intensity level of D3 corresponds to 'Extreme Drought'. At this level, major crop and pasture losses are common, fire risk is extreme, and widespread water shortages can be expected requiring restrictions. Duration and impacts are critical in looking at D3 droughts, which fall into the 5th percentile, or a 1 in 20 year type of drought.
3.9 Intensity Level D4
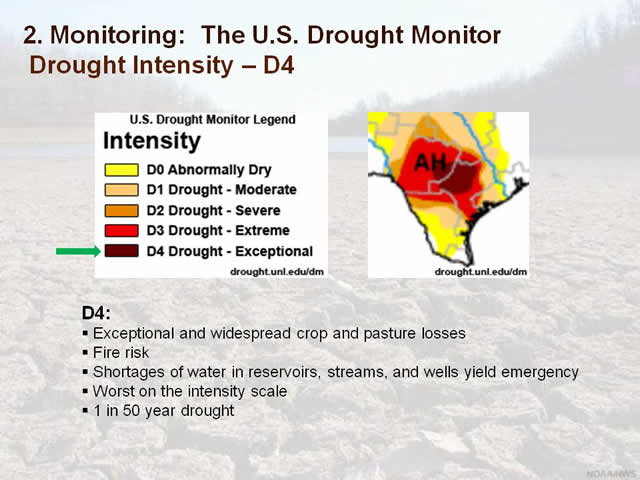
The final intensity level, D4, corresponds to 'Exceptional Drought'. At this level, there are exceptional and widespread crop and pasture losses, fire risk, shortages of water in reservoirs, streams, and wells that yield water emergencies. Worst on the scale, D4 can loosely be likened to a "once-in-a-generation" type of drought noted by the 2nd percentile, or a 1 in 50 year drought.
3.10 Intensity Level Summary
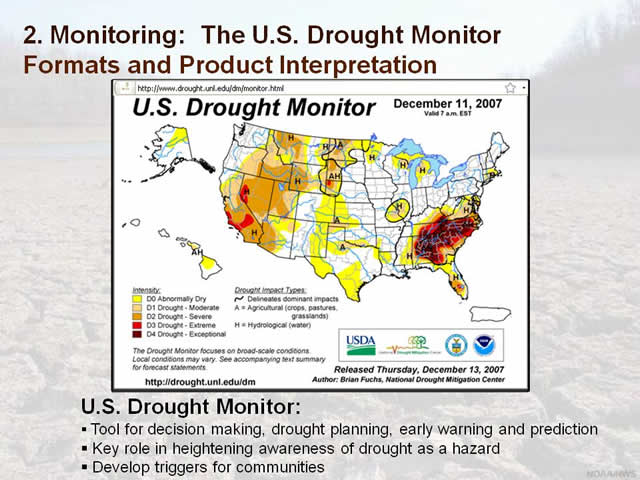
The practical use of the U.S. Drought Monitor is to serve as a tool for decision making, drought planning through monitoring, early warning, and prediction. It also plays a key role in heightening awareness of drought as a hazard through dissemination by various media sources and state and federal agencies. Indices that are linked to impacts, such as the U.S. Drought Monitor, can be subsequently used to develop triggers (or thresholds for alerts) for communities to take action to respond to drought conditions.
3.11 International Efforts
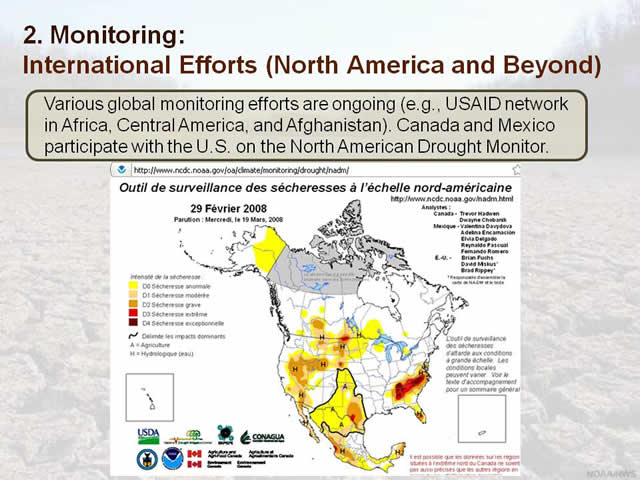
The success of the U.S. Drought Monitor has been leveraged internationally into an expanded North American Drought Monitor product. This product has been provided on a monthly basis through the collaboration of meteorological, hydrological, and agricultural agencies in the United States, Canada, and Mexico. This product has served as a model for other international efforts to improve capabilities in drought early warning in particularly vulnerable parts of the world.
Section 4: Impacts
4.1 The "Face" of Drought
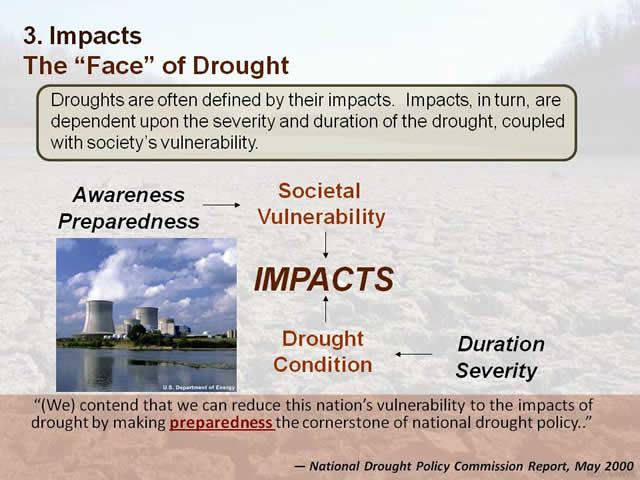
As we now turn our attention to drought impacts, let's consider the contributors to a negative impact from drought. Risk from drought leading to an impact has two components – societal vulnerability and the duration and severity of a drought that defines its condition. When, for a certain drought condition, vulnerability exists, an impact will occur.
As an example, consider a reservoir for a nuclear power plant. There is a minimum water level at which the power plant can obtain water for steam generation and cooling to safely operate. When a drought condition, defined by its duration and severity, causes the water level to drop below that limit, an impact – the suspension of power plant operation – is realized.
4.2 Monitoring Impacts
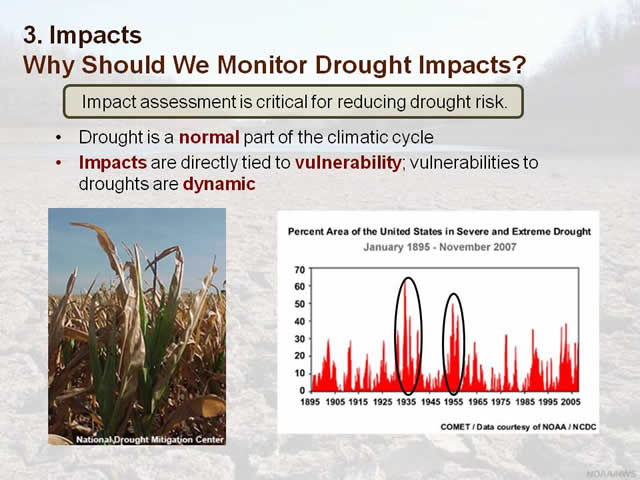
As we can see, drought condition is but one side of a two-sided coin. We cannot fully understand drought without understanding its impacts. While the graph of the area of the United State in severe and extreme drought over time helps us highlight periods of expansive drought in the country, specifically the 1930s and 1950s, information on the impacts during these and other periods is also needed to understand the consequences of these historic drought periods. Drought condition and societal vulnerability together provide lessons learned on historic impacts and, hopefully, how they can be minimized or even avoided in the future.
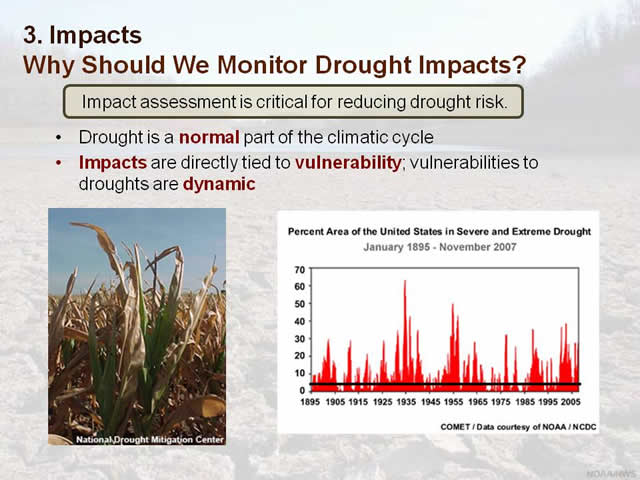
What is the general state of drought in the United States? The answer is that drought is almost always with us - there are very limited times when less than 5% of the U.S. has experienced drought during the past 100 years or more. To improve our understanding of drought and its risk, we must be diligent in assessing impact whenever possible. This effort, in turn, will also serve to begin building a baseline of impacts from which we can compare future droughts or gauge the influence of changes to our vulnerability of climate.
4.3 Drought Disaster
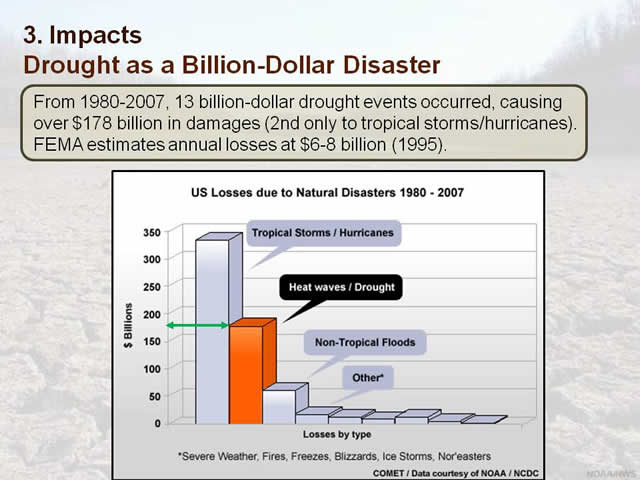
Drought might not offer the same immediate and dramatic visuals as the violent images associated with hurricanes and tornadoes. This masks the fact that drought impacts have a huge price tag. In fact, droughts rank second in types of phenomena associated with billion-dollar weather disasters during the past three decades. With annual losses over 5 Billion dollars per year, drought is a serious hazard with substantial socioeconomic risks for the United States.
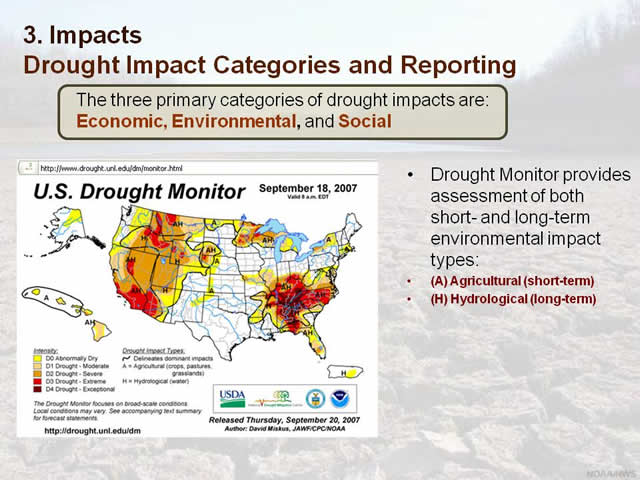
4.4 Impact Categories
Diligent assessment of drought is accomplished through systematic categorization and reporting of impacts. By considering the economic, environmental, and social impacts of drought, specific events and underlying meteorological contributors may be studied in order to improve future societal preparedness. The National Drought Mitigation Center's Drought Impact Reporter is a web-based tool that allows individuals to characterize drought impacts in a manner that used to be limited to ad-hoc local information collection.
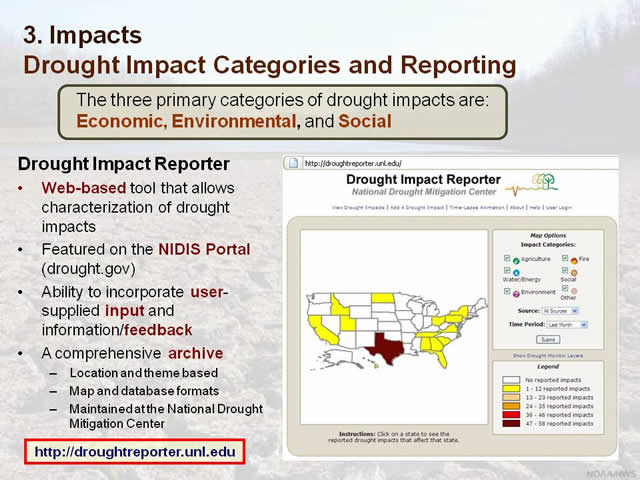
The Drought Impact Reporter is on-line at "droughtreporter.UNL.EDU" and its developers encourage weather service personnel and other drought observers to use the online form to submit drought impacts and photos. Before-and-after photos are ideal for showing the contrast between normal and drought conditions.
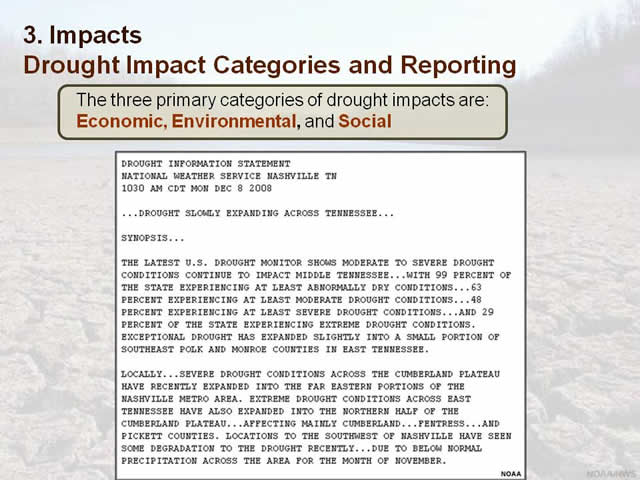
One reflection of the increased need to focus on impacts is the requirement (as of June 2008) for Weather Forecast Offices to issue a Drought Information Statement at least monthly when the Drought Monitor shows any part of their area in D2 or worse conditions.
4.5 Risk Management
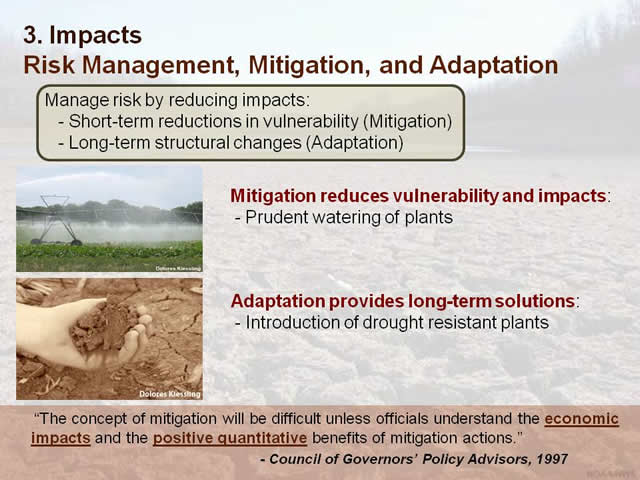
We have established the link between impacts and risk. So how do we manage risk? Both short-term reductions in vulnerability or mitigation and long-term structural changes or adaptation, are key risk management strategies. An example of mitigation is prudent watering of plants. An example of adaptation is the introduction of drought-resistant plants.
4.6 Estimating Loss
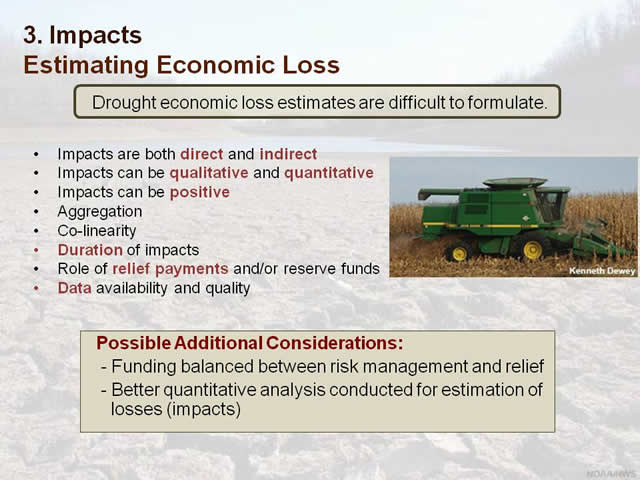
While compiling individual drought impacts seems fairly straightforward, providing economic loss estimates is not. Risk management is often overlooked in the rush by society to rebuild and rehabilitate - or to 'get back to normal as soon as possible' An additional consideration should be to make changes in practices or infrastructure in a way that reduces risk for the future.
4.7 Direct and Indirect Impacts
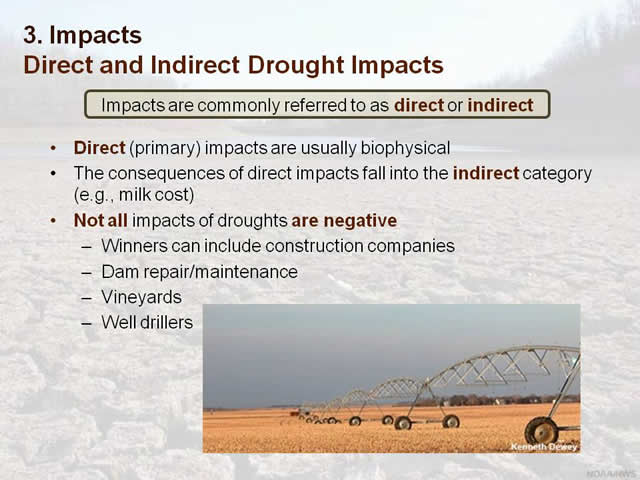
The impacts of drought can be both direct such as decreases in dairy production and indirect as seen by increases in the price of cheese. It is worth noting that not all impacts from drought are automatically negative. Drought can be good for construction, maintenance and repair of infrastructure, and airlines. It can also be helpful to some crops, for example, wine grapes during key development periods.
4.8 Potential Benefits
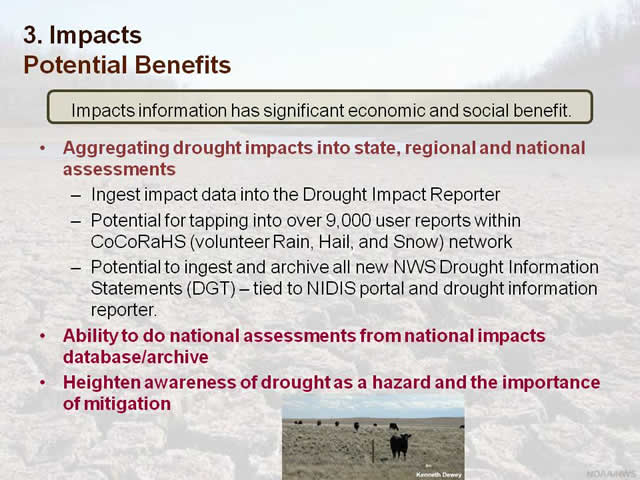
Impacts information has significant economic and social benefit. By aggregating drought impacts into state, regional, and national assessments, weaknesses in infrastructure or practices that lead to vulnerability can be identified and corrected. Impacts information heightens the awareness of all, from decision makers to citizens.
Section 5: Predictions
5.1 Drought Outlook
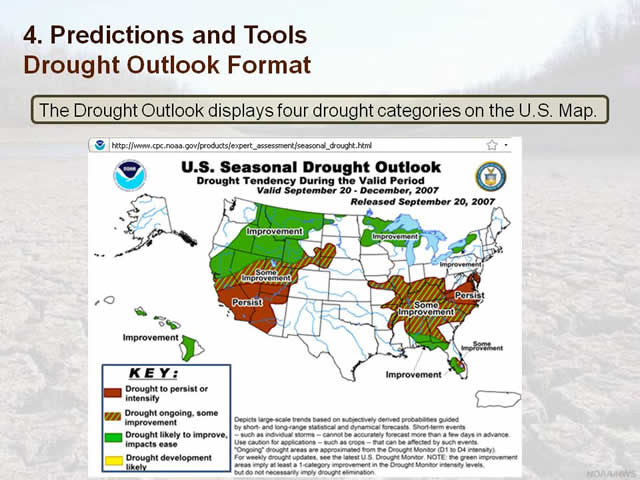
Now let's turn our attention to drought prediction. The most prominent predictive product focused on drought for the general public is the U.S. Seasonal Drought Outlook. This product is issued on a bi-weekly schedule by NOAA's Climate Prediction Center (or CPC). For the period extending from the release date to the end of the third month following the release date, the Outlook characterizes medium-term trends in drought persistence, enhancement, and reduction.
The Outlook displays 4 drought change categories on the U.S. map, including drought persistence or intensification; drought ongoing with some improvement; drought likely to improve with impacts easing; and drought development likely. Let's define each of these categories:
Drought persistence or intensification means that drought intensity categories as measured by such composite indicators as the U.S. Drought Monitor either do not change or grow worse.
Drought ongoing with some improvement indicates more limited improvement than designated by the other improvement category, usually because surface moisture conditions are expected to improve while hydrologic drought persists, or the improvement is expected early or late in the forecast period.
Drought likely to improve with impacts easing implies at least a 1-category improvement in the Drought Monitor intensity levels. This results in drought impacts easing, meaning the impact on crops, water supplies, etc. is less serious.
Drought development likely means that drought has a better than 50 percent chance of
developing sometime in the forecast period.
The drought forecast does not presently distinguish between agricultural or hydrological drought,
although appropriate comments are often made in the discussion accompanying the forecast.
The Seasonal Drought Outlook tracks areas experiencing moderate drought or worse, corresponding to the intensity levels of D1 or higher as defined by the U.S. Drought Monitor, and is verified using the change in drought intensity over the forecasted period.
5.2 Inputs for Drought Outlook
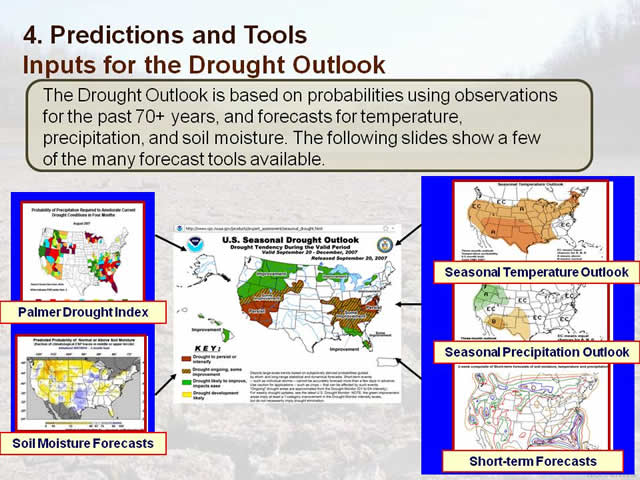
The Drought Outlook is based upon a broad array of forecast tools and drought-related indices and indicators. There are five forecast tools that are especially important: 1) the historical Palmer Drought Index; 2) Soil Moisture Forecasts; 3) Seasonal Temperature Outlook; 4) Seasonal Precipitation Outlook; and 5) Short-term Forecasts of the elements described above excluding the Palmer index.
5.3 Palmer Drought Index
Let's look at each of these five underlying forecast tools and see what role they play in the Drought Outlook.
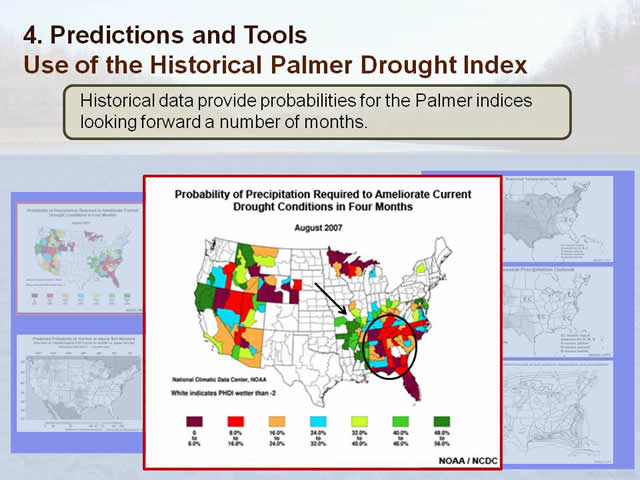
The Palmer Drought Index (or PDI) is a long-term measure of moisture based on water balance equations using temperature and precipitation. PDI values are best correlated with 7 to 10 month precipitation anomalies.
The PDI is a key measure of drought, so expected changes have a strong impact on the Drought Outlook. However, the PDI does poorly with short-term agricultural drought, and that is the reason the Crop Moisture Index, which uses a meteorological approach to monitor week-to-week crop conditions, was developed.
In this example, the map from NOAA's National Climatic Data Center indicates the probability of the PDI improved to better than negative 2 point zero by December (which means basically emerging from drought). The PDI shows a tendency for drought to hang on in many parts of the Southeast, but improve in the northern and western fringes of the drought region. Verification of the drought outlook using the January 1, 2008 Drought Monitor shows that this is a pretty good description of how drought evolved during this period.
5.4 Soil Moisture Forecasts
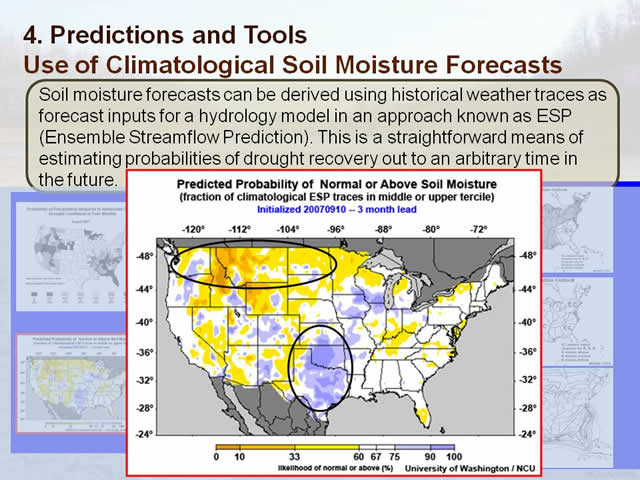
The Soil Moisture Map, produced by the University of Washington, shows probabilities of soil moisture being normal or above normal in 3 months based on past data. In this example, the map shows a tendency for dryness to linger in the Northwest and northern Plains (the areas in yellow) and stay moist in the southern Plains (areas in blue).
In this case, short- and long-range forecasts of precipitation took priority (note the moisture in the Northwest), such that little weight was put on this forecast tool.
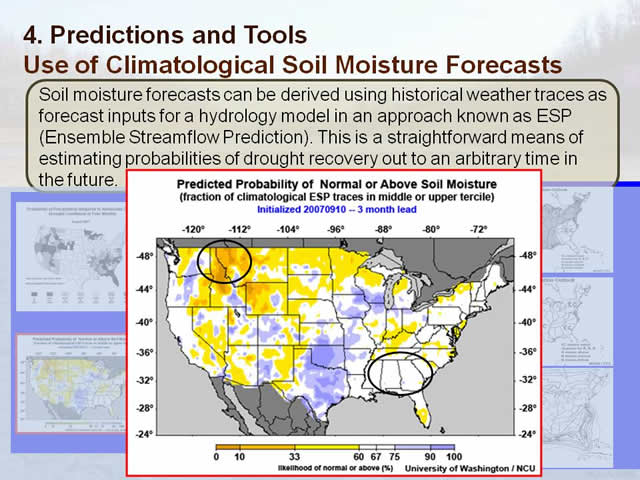
In the Southeast, the lack of dryness shown in the probability map supported a general forecast of at least some improvement.
5.5 Temperature Forecasts
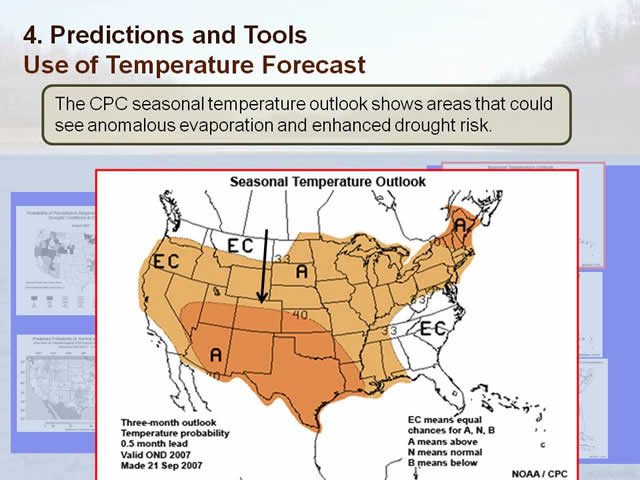
The Seasonal Temperature Outlook from CPC shows areas that could see anomalous evaporation and enhanced drought risk. In this example, the elevated probability of above-normal temperature in the southwestern U.S. is reflected in the Drought Outlook by persistence of drought conditions there.
5.6 Seasonal Precipitation Outlook
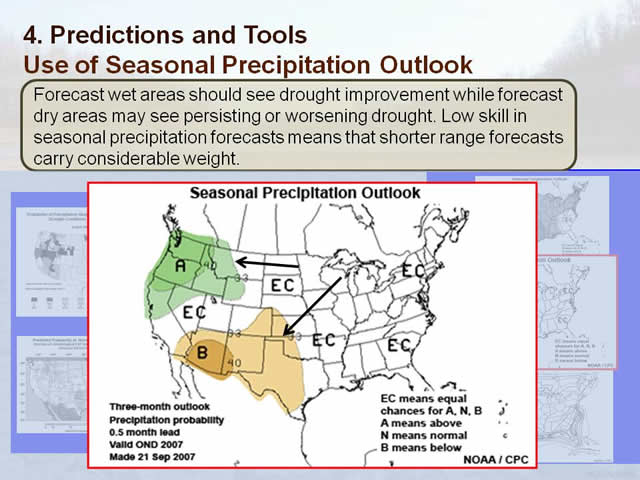
The Seasonal Precipitation Outlook also from CPC shows wet areas that should see drought improvement and dry areas that might see persisting or worsening drought. Low skill in seasonal precipitation forecasts means that shorter-range forecasts carry considerable weight, especially the initial 2 weeks. In this example, the probabilistic outlooks in the western U.S. are reflected in the Drought Outlook as improvement in the northwest and persistence in the southwest.
5.7 Short-Term Forecasts
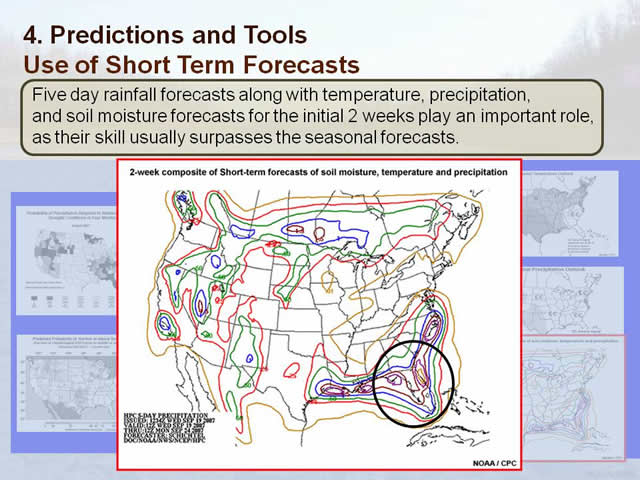
Rounding out the five tools is a NOAA composite of 2-week short-term forecasts of soil moisture, temperature, and precipitation. Five-day rainfall forecasts along with temperature, precipitation, and soil moisture forecasts for the initial 2 weeks play an important role, as their skill usually surpasses the seasonal forecasts. In this example, the short-term forecast for precipitation over the Florida peninsula influences the decision to show some improvement over Florida in the Drought Outlook.
5.8 Verification
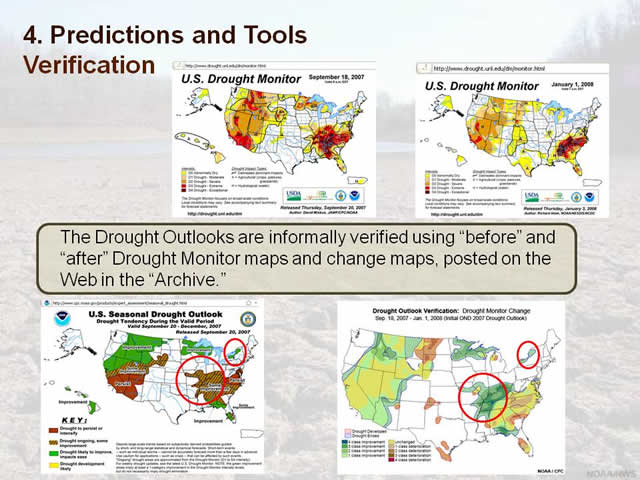
The Drought Outlooks are informally verified using "before" and "after" Drought Monitor maps and change maps, posted on the CPC web site. The difference maps subtract intensities indicated by the Drought Monitors before and after the forecast and show in colors where drought increased or decreased. In this example, there was good agreement (meaning that there was improvement where it was forecast in space and time) over the Mississippi Valley and upstate New York, with mixed results elsewhere, when comparing the Outlook with the actual difference shown in the lower right map.
5.9 Verification, cont.
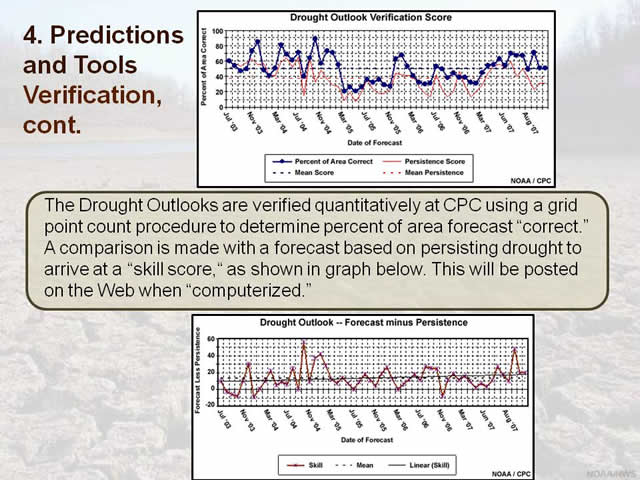
Another way to look at verification is to track the skill over time. The Drought Outlooks are verified quantitatively at CPC using a grid point count procedure to determine percent of area forecast "correct."
The top graph shows quantitative verification in blue, with persistence in red. A comparison is made with a forecast based on persisting drought to arrive at an informal skill score, which is calculated by subtracting the verification from the persistence, as shown in the bottom graph. Verification scores are maintained internally at CPC and may be posted on the Web when the process is automated.5.10 Improvement of Predictability
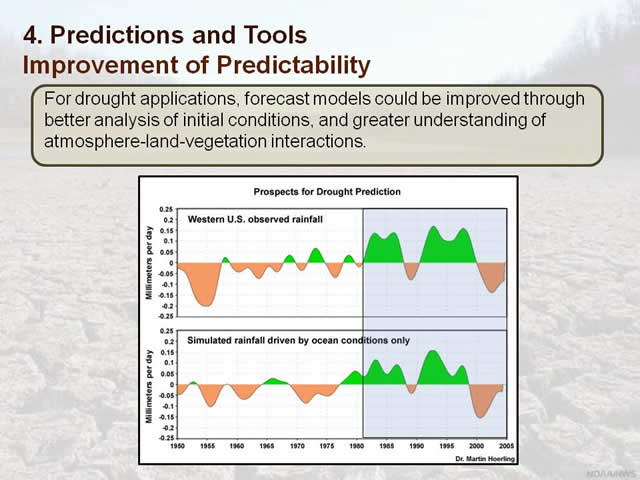
For drought applications, forecast models could be improved through better analysis of initial conditions, and greater understanding of atmosphere, land and vegetation interactions. In this example, the major anomalies in the latter part of the 55-year comparison between observed and ocean-based simulations of precipitation agree, but the comparison diverges from there. Research continues to help us gain a better understanding of the interactions between regional moisture deficits and the Earth, Atmosphere and Ocean system.
5.11 Other Drought Forecasts
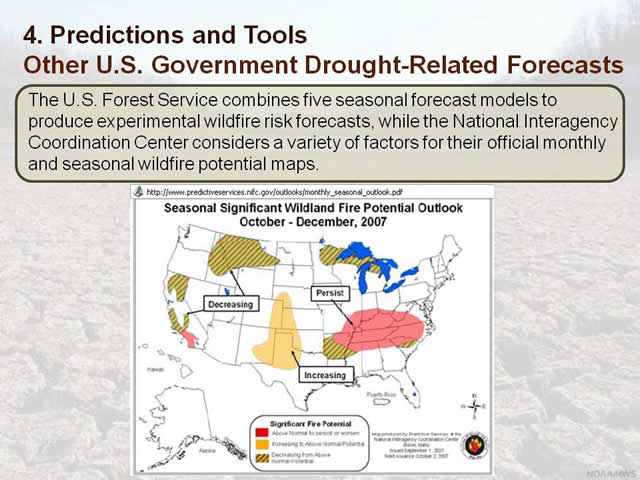
Just as specialized observing networks and indices and indicators address specific sector-based drought impacts, specialized forecasts are also generated. Here, the risk of wildland fire related to drought is presented in a map-based seasonal forecast.
5.12 Other Drought Forecasts, cont.
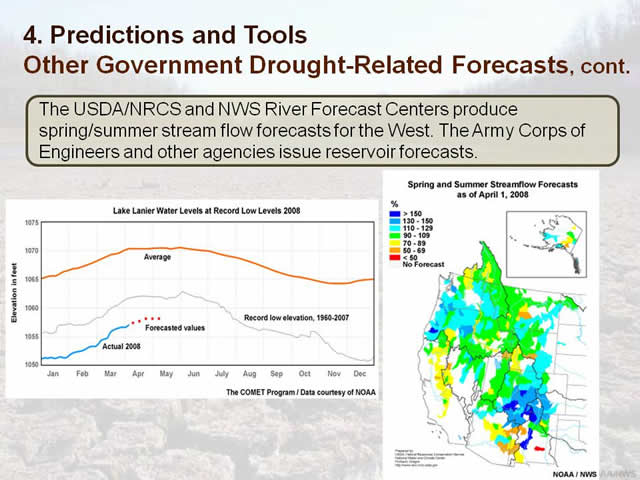
The forecast needs of the hydrological community warrant specialized forecasting tools as well, particularly in the western United States. Here, a River Forecast Center application highlights streamflow conditions, and basin-specific streamflow forecasts are presented in a map for the benefit of reservoir managers.
Section 6: Resources
6.1 Service Requirements
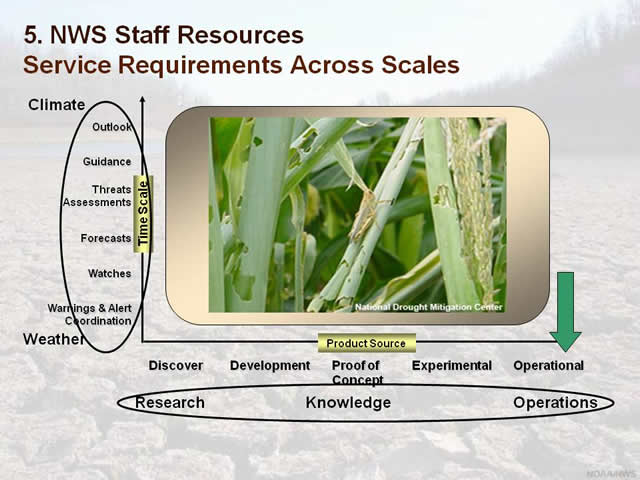
Having discussed drought definitions, monitoring, impacts, and prediction, how can this information be brought together in a meaningful way for NWS staff to convey to the public? First, let's consider the context in which the drought information will be used. On the one hand, drought information covers a time scale from the present weather conditions to longer-term climate outlooks. On the other hand, drought is considered by researchers, information translators, and operational entities. Clearly, National Weather Service field offices are focused on the operational, near- and medium-term delivery of information, more or less within the lower right quadrant of the graphic shown here.
6.2 Drought Portal
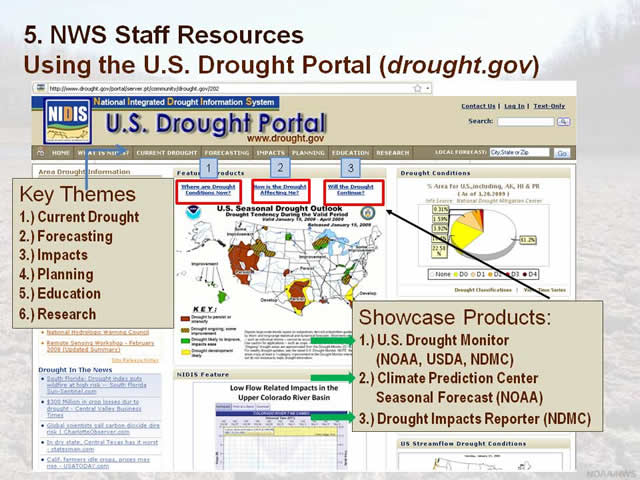
As we have already discussed, "drought.gov" is a handy and rich resource for drought information that cuts
across geographic and sectoral boundaries. This primary presence for NIDIS highlights three so-called
'showcase' products – the Drought Monitor, the Seasonal Drought Outlook, and the Drought Impacts
Reporter. These three products help us answer critical questions about drought such as:
Where are
drought conditions now?
How is the drought affecting me?
Will the drought continue?
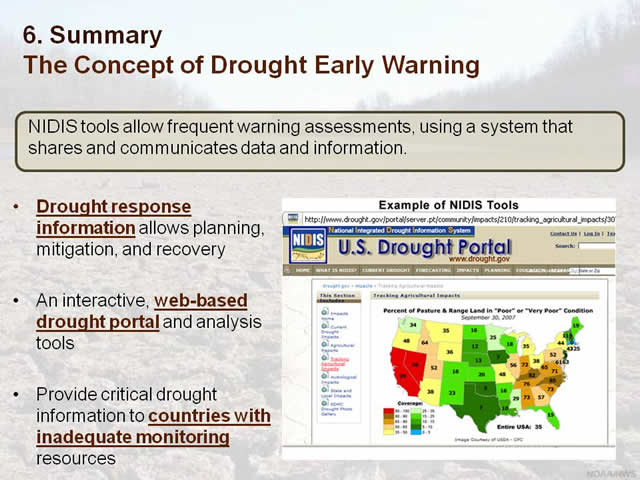
6.3 Drought.gov
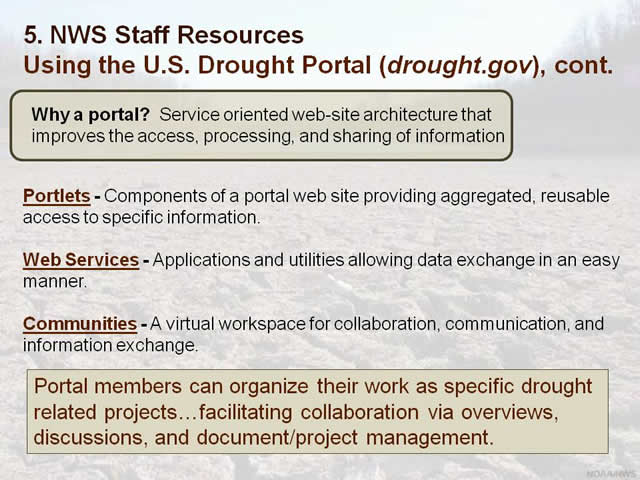
One of the great strengths of "drought.gov" is its structure as a web-based portal. Portals allow information from many different sources to be consolidated in text and map presentations using agreed-upon standards with communities of users. This flexibility is essential given the interagency collaborations that are necessary to understand and respond to drought.
6.4 Drought Information Statements
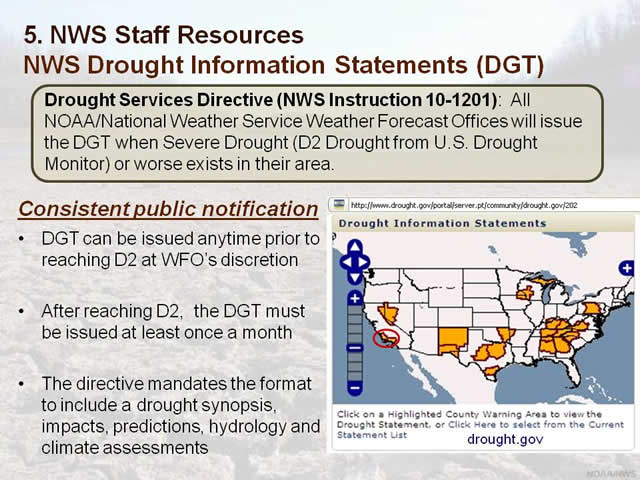
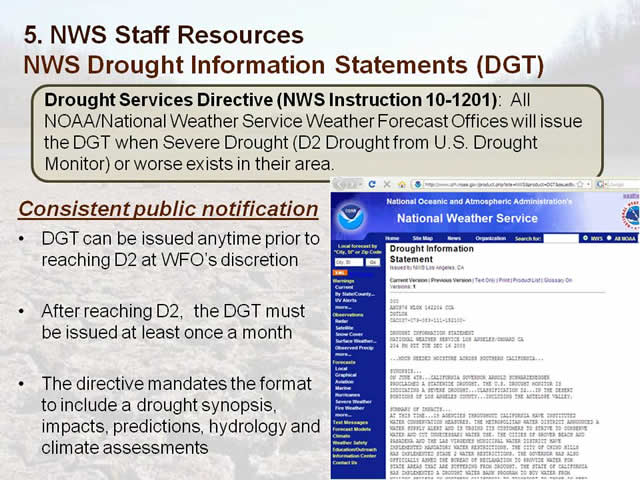
When it comes to issuing drought statements, the National Weather Service operates under the Drought Services Directive. This directive calls for field offices to issue a drought information statement (or DGT) whenever severe drought or worse, as defined by the Drought Monitor, exists within a field office's area of responsibility. Additional notification is permissible at the discretion of an office.
6.5 Best Practices
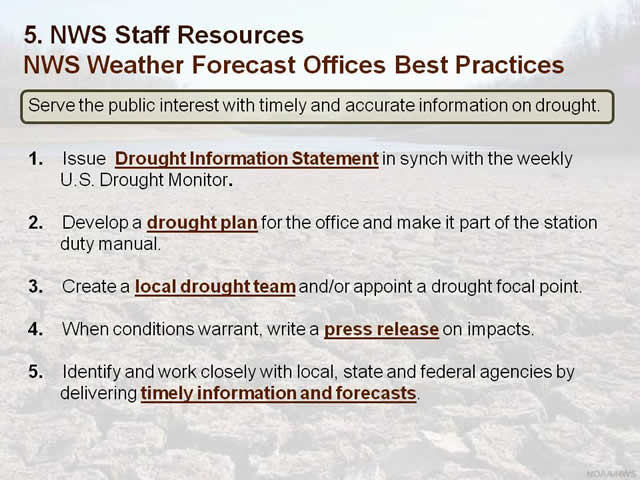
Beyond the issuance of drought information statements, National Weather Service Offices can follow these best
practices to optimally serve the public interest with timely and accurate information on drought. Listed here
on these two slides, are the ten best practices based upon organizational structures and preparedness steps
that should be taken before drought strikes. Here are a few practices worth highlighting:
Create a local drought team
Collect and write a press release on impacts
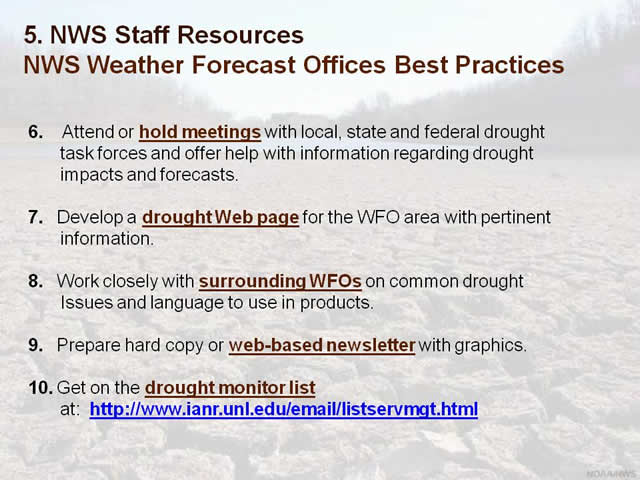
Participate or host meetings with local, state or other officials
Develop a local drought Web page
Get involved with the drought monitor list server at the url listed here.
For other ideas, please
read over all 10 steps following this presentation.
Section 7: Summary
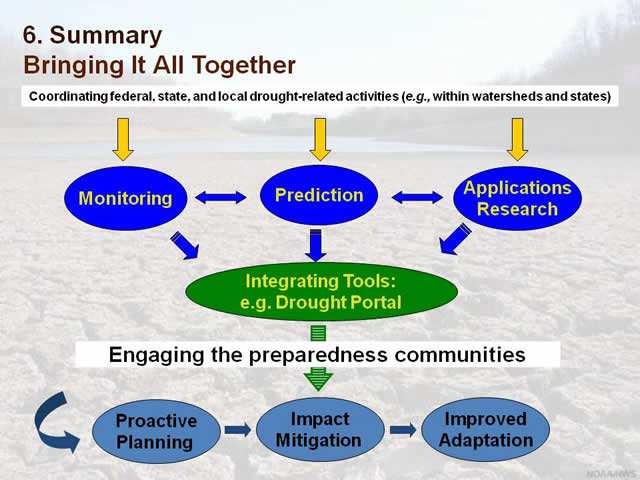
7.1 Engaging Partners
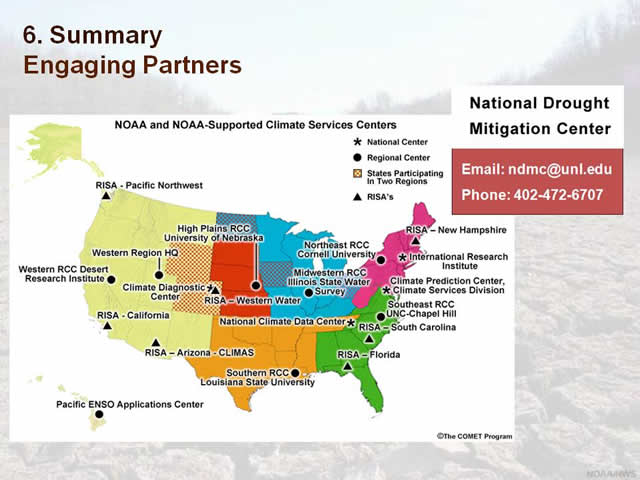
To summarize, National Weather Service Offices can rely on a broad community of partners in climate services, including other NOAA offices and laboratories, State Climatologists, Regional Climate Centers, and universities and Regional Integrated Science and Assessments teams to address drought and other hazards questions. While climate focal points are the primary resource for engaging these groups, all field office personnel should understand the array of partners. You are especially encouraged to contact the National Drought Mitigation Center if you have related questions.