1. Introduction » Overview
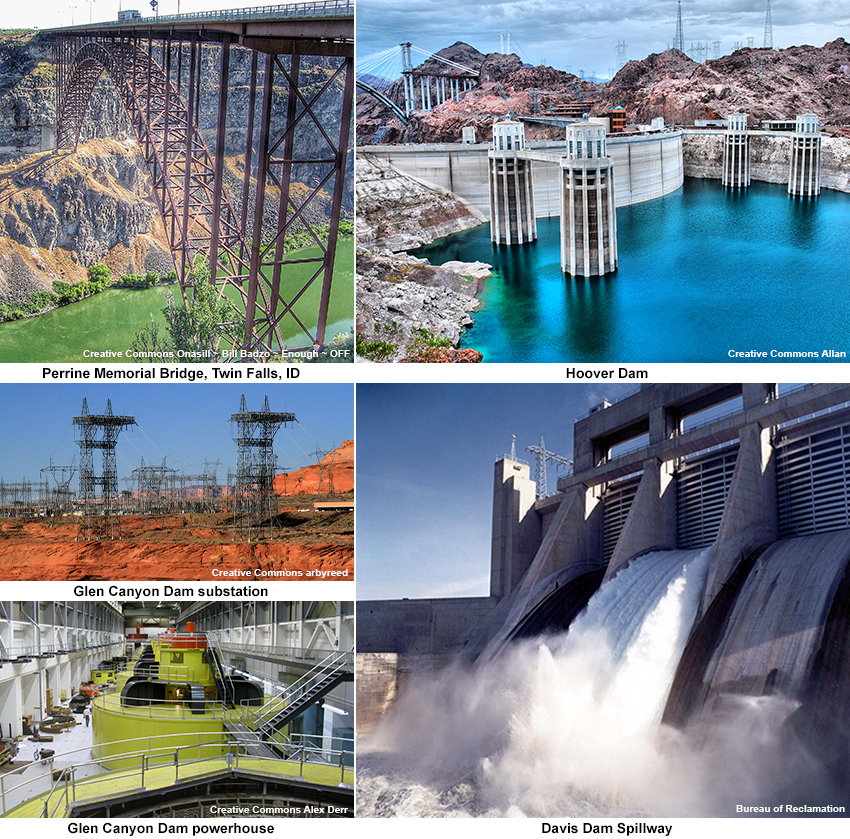
Across the United States, a range of infrastructure associated with reservoirs must be maintained for efficient and continuous operation. These infrastructure may include dams, pipes, spillways, power plants, power transmission, diversion structures, shoreline structures, roads, bridges, and buildings.
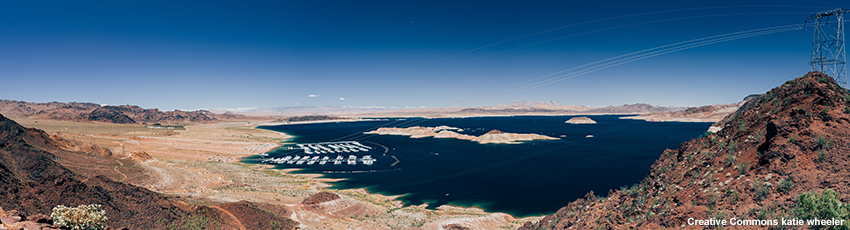
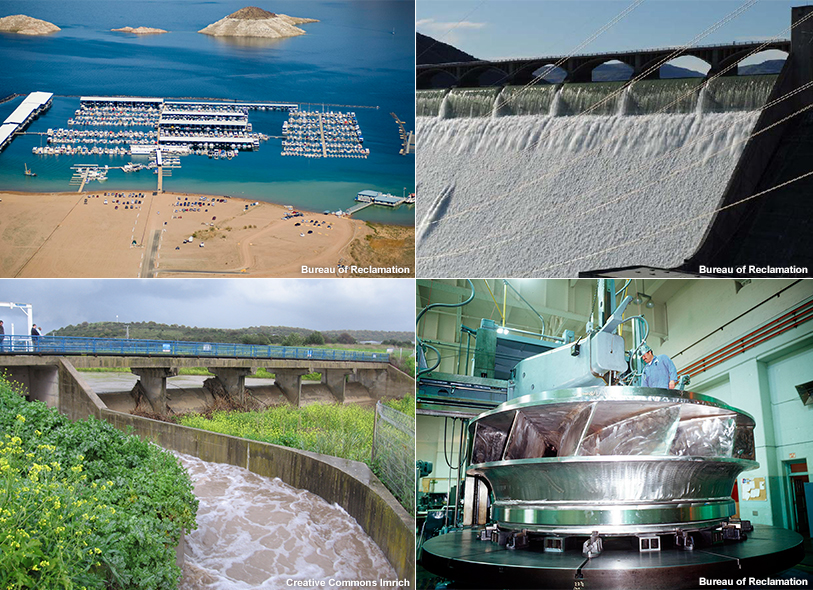
Lake Mead
Along with this diverse set of structures, there are diverse hydrologic conditions under which infrastructure must perform and be maintained. A common principle is that infrastructure is designed and maintained based on expected environmental conditions. Reservoir pool elevation is the outcome of those conditions and in many cases this elevation dictates how, when, and what type of maintenance, repairs, and replacement activities are pursued.
1. Introduction » Infrastructure Management
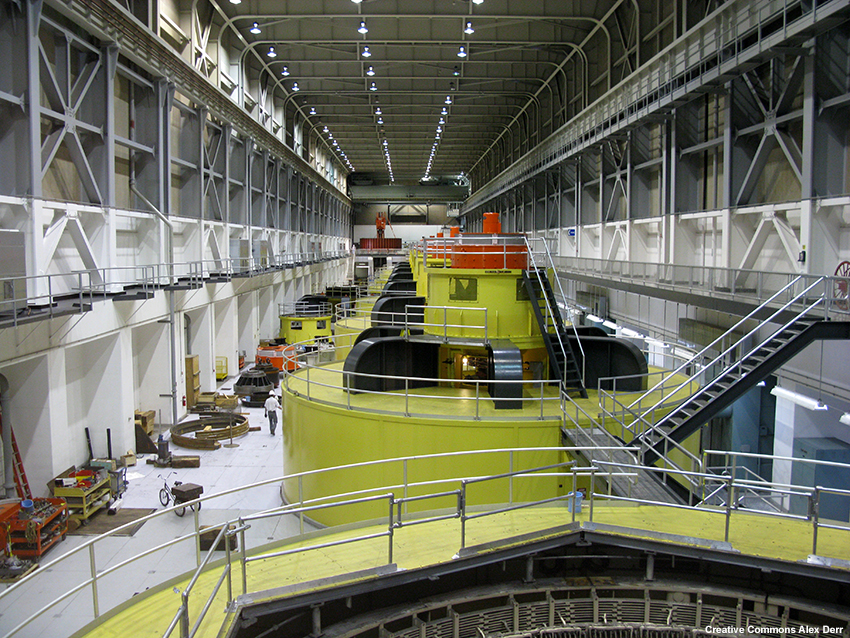
Glen Canyon Dam powerhouse
Maintenance, repair, and replacement for continuous and efficient operation of facilities occurs at a variety of timescales, and components have different lifecycles. The possible effects due to climate change are particularly important to consider when looking at components and repairs intended to last for decades. Additionally, information on expected trends may be relevant in planning repair activities that require particular reservoir conditions.
1. Introduction » About This Lesson
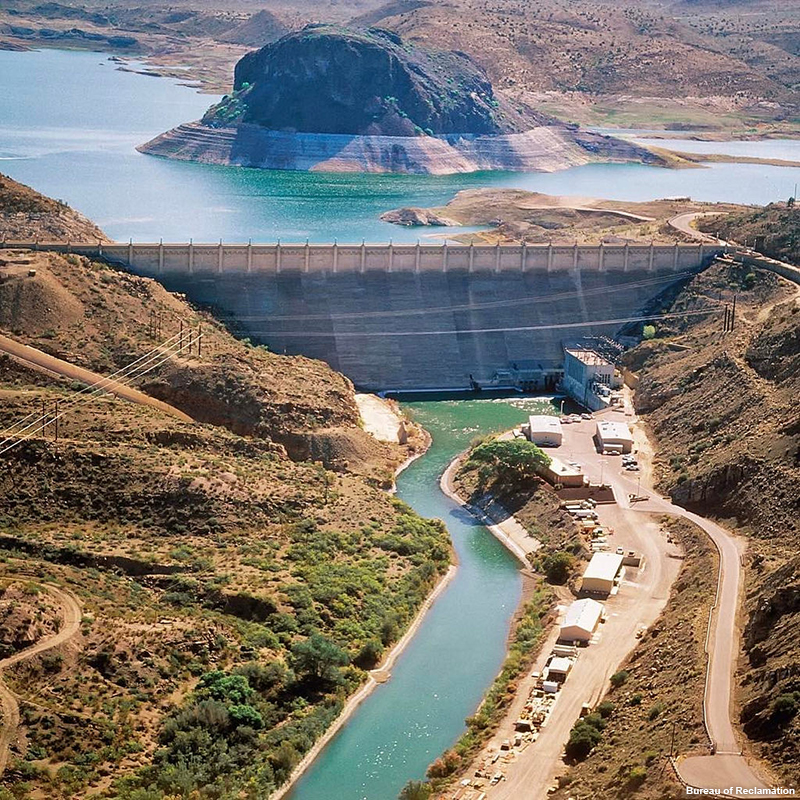
Elephant Butte Dam on the Rio Grande
In this lesson we will examine how climate change may impact reservoir pool elevations in the context of infrastructure (asset) management.
After completing this lesson you will be able to:
- Describe the projected changes in climate that are likely to affect reservoir elevation
- Describe key features of projected temperature changes in for the Western United States (mean annual temperature, seasonality).
- Describe the key features of projected changes to precipitation for the Western United States (amount, phase, timing, intra-year and inter-annual variability).
- Describe the impacts on reservoir elevation from changes to temperature, precipitation and streamflow due to climate change
- Describe climate impacts that change inflows, including the following:
- Streamflow changes due to changes in the timing, amount, and phase of precipitation
- Streamflow changes due to changes in temperature including seasonality and efficiency of snowmelt runoff
- Describe climate impacts that change direct losses from reservoirs, including the following:
- Evaporation changes due to changes in temperature
- Describe climate impacts that change outflows, including the following:
- Changes in irrigation demand due to changes in temperature and seasonality
- Evapotranspiration changes due to changes in temperature
- Describe climate impacts that change inflows, including the following:
- Describe the typical challenges that changes in reservoir elevation may pose to asset management and planning
- List and describe several examples of impacts to asset management (e.g. infrastructure investment) due to climate change
2. Reservoir-Associated Infrastructure Impacts
Please answer the following question.
Question
Choose which infrastructure type is best associated with the following statements. Please use each item once.
The correct answers are:
- Spillways: Maintenance may require a period of stable pool elevations within a certain range. Changes in timing and variability of inflows may make this challenging.
- Powerplants: Lower pool elevations may reduce efficiency of operation, and result in damages.
- Shoreline infrastructure: In response to changing reservoir conditions, may require modification to accommodate further distance from shore or relocation to deeper water.
- Diversion structures: To ensure water delivery reliability, may need to be modified or relocated to accommodate low or fluctuating lake levels.
Infrastructure is central to a reservoir and the benefits it provides. Here we explore example considerations that changes in reservoir pool elevation may pose to various infrastructure components frequently found at reservoirs.
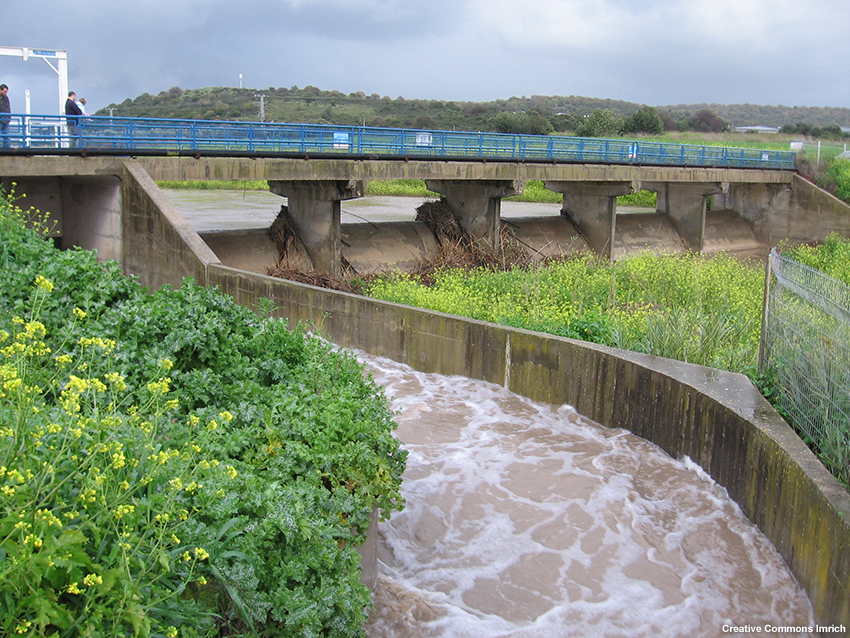
2. Reservoir-Associated Infrastructure Impacts » Spillways
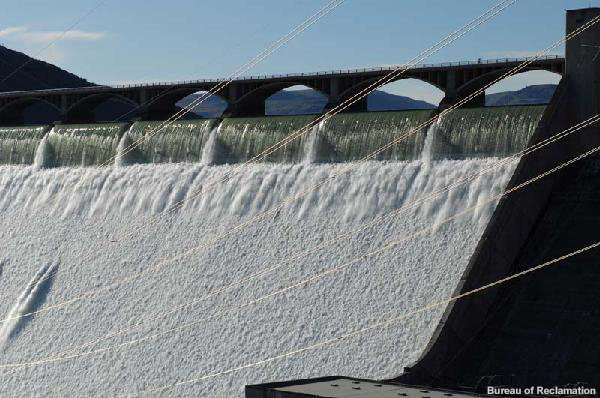
Grand Coulee Dam uses a series of drum gates to regulate releases.
Maintenance of spillway gates may require a period of stable pool elevations within a certain range. Changes in timing and variability of inflows may make this challenging, potentially requiring an alternate timing or approach to the maintenance. Additionally, it may be beneficial to consider infrastructure and technologies that could reduce sensitivity to such variations.
2. Reservoir-Associated Infrastructure Impacts » Powerplants
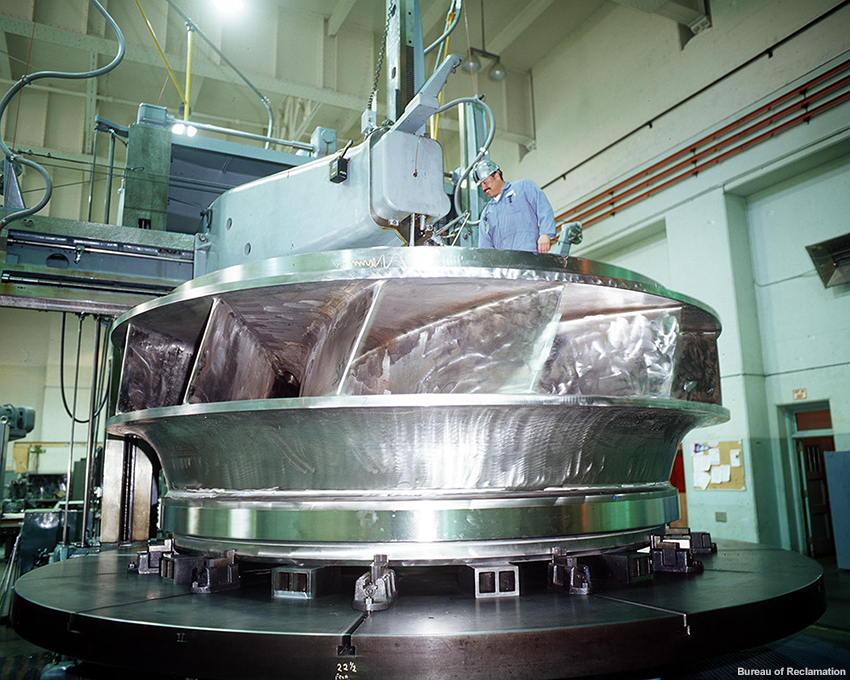
Turbine runner maintenance on Unit A4 Hoover Dam
Extended periods of reservoir elevation outside the expected design conditions of a turbine may result in reduced performance and possible damages associated with cavitation. Alternate designs or operations may help to mitigate these conditions.
2. Reservoir-Associated Infrastructure Impacts » Shoreline Infrastructure
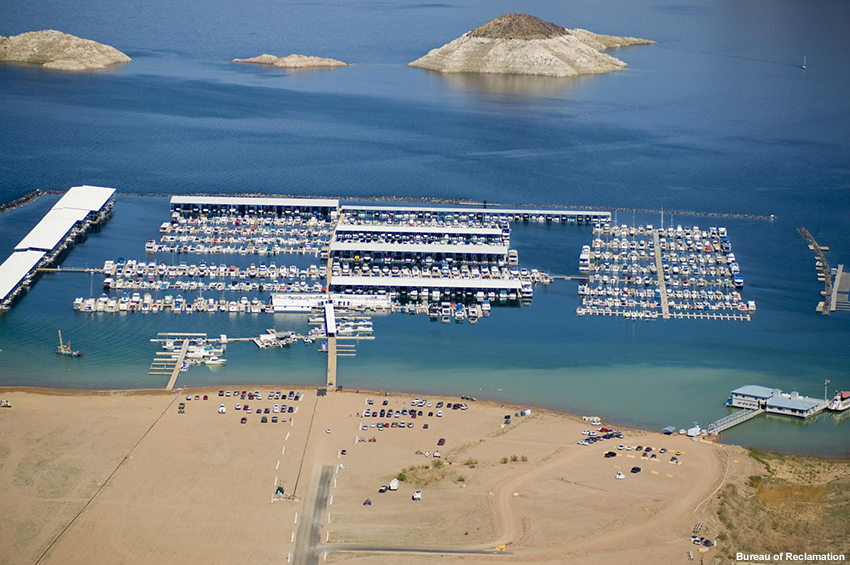
Lake Mead Marina, which has already been relocated once and extended multiple times to accommodate low lake levels.
Recreational infrastructure such as marinas, must be sited in locations conducive to continued operation for a range of pool elevations. In some cases, this may be in conjunction with additional infrastructure, such as extensions to marina utilities to accommodate further distance from shore or possibly overall relocation to deeper water.
2. Reservoir-Associated Infrastructure Impacts » Diversion Structures
Dams have a range of designs and purposes, which often includes impounding water to be diverted out of the river channel. This occurs at facilities ranging from larger storage reservoirs to small, run–of–the–river diversion dams. Associated diversion infrastructure may need to be modified or relocated to accommodate low or fluctuating levels to ensure continued diversion reliability.
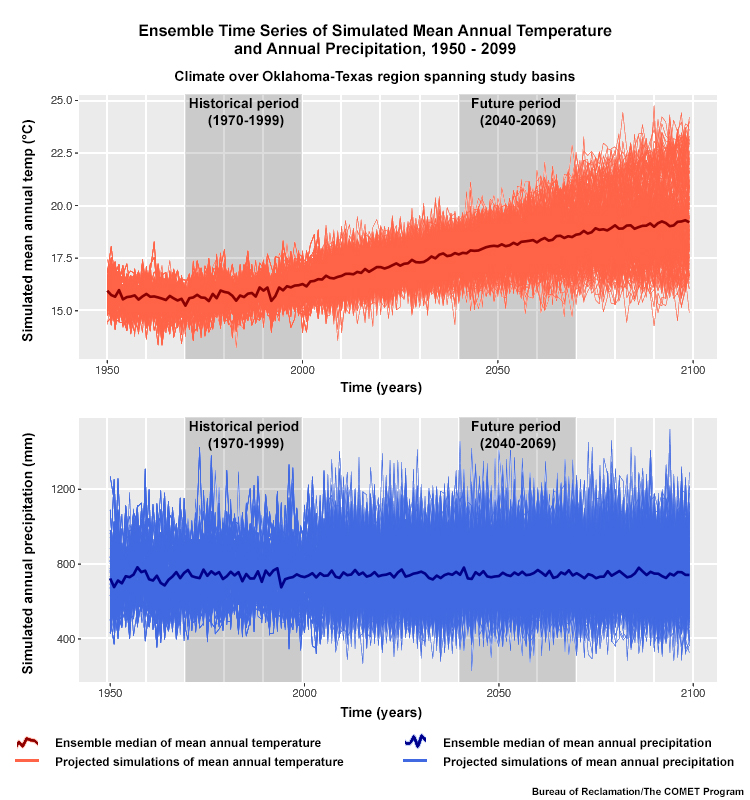
3. Factors Impacting Reservoir Pool Elevation
Temperature Projections
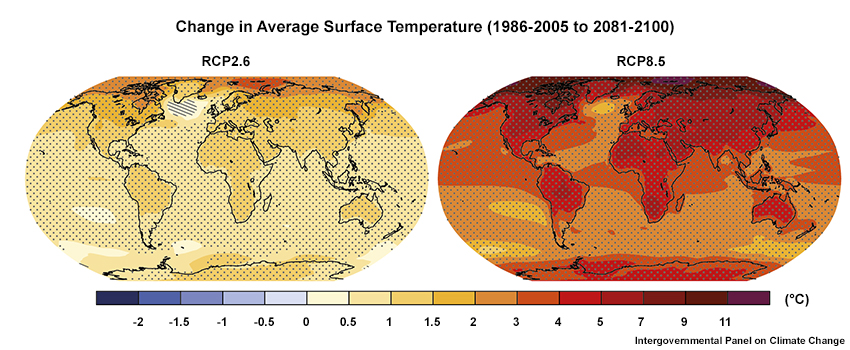
These two plots show projected global temperature changes by the end of the 21st century comparing the lowest (RCP2.6) and highest (RCP8.5) emissions scenarios used in the CMIP5 model projections. Hatching (e.g., around Greenland) indicates regions where the multi-model mean is small compared to natural internal variability (i.e., less than one standard deviation of natural internal variability in 20-year means). Stippling indicates regions where the multi-model mean is large compared to natural internal variability (i.e., greater than two standard deviations of natural internal variability in 20-year means) and where at least 90% of models agree on the sign of change.
Precipitation Projections
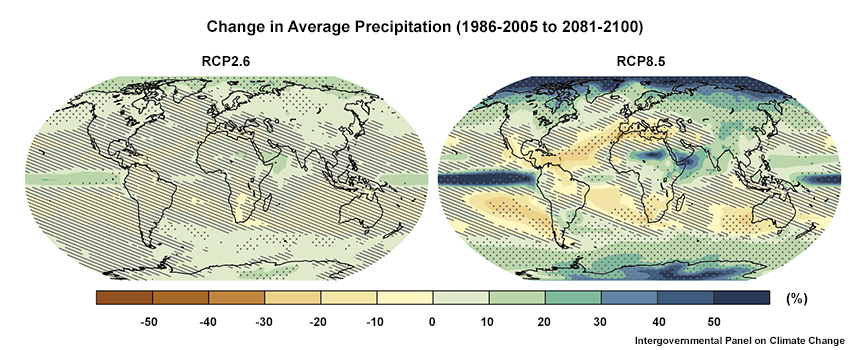
These two plots show projected global precipitation changes by the end of the 21st century comparing the lowest (RCP2.6) and highest (RCP8.5) emissions scenarios used in the CMIP5 model projections. Hatching indicates regions where the multi-model mean is small compared to natural internal variability (i.e., less than one standard deviation of natural internal variability in 20-year means). Stippling indicates regions where the multi-model mean is large compared to natural internal variability (i.e., greater than two standard deviations of natural internal variability in 20-year means) and where at least 90% of models agree on the sign of change.
Changes in temperature and precipitation can affect timing and magnitude for reservoir inflows, losses, and releases—and these processes directly impact pool elevation. As a result of pool elevation changes, reservoir-associated infrastructure facilities may experience operating conditions different than the historical norms. When making long-term planning decisions, it is important to consider how the ranges of projected changes in temperature and precipitation patterns will impact reservoir elevations and consequently influence plans for maintenance, repair, and replacement of infrastructure.
Compare the images shown in the tabs above. They show the projected global changes in temperature and precipitation for the period from 1986-2005 to 2081-2100. The images show a multi-model mean for either lower greenhouse gas emissions (RCP2.6) or higher emissions (RCP8.5) . The hatched areas (lines) indicate areas with less certainty, while the stippled areas (dots) show areas of higher certainty. (See figure captions for details.)
Question
Based on these figures, use the selection boxes to complete the following statements.
There is strong consensus that the vast majority of the U.S., and the globe will warm over this century. Since the 1970’s temperatures have steadily increased, with recent years recording anomalies around 1.7 degrees fahrenheit relative to the 20th century average. Projections indicate that temperatures are likely to increase several degrees more by the end of the 21st century.
Projections of changes in annual precipitation vary greatly across regions. In addition, projections from different models often offer greatly differing scenarios for the same region. Relative to the companion temperature plot, there is less stippling and more hatching, which indicates less consensus.
For more information on documented changes and their significance see:
https://www.climate.gov/news-features/understanding-climate/climate-change-global-temperaturehttps://www.climate.gov/news-features/featured-images/precipitation-changes-over-north-america-do-models-agree
3. Factors Impacting Reservoir Pool Elevation » Projected Changes in Temperature
Shown here are projected changes in mean annual temperature between the 30-year period starting in 1970 and the one starting in 2070 for the western United States. Data are derived from 97 climate model projections from CMIP5 (the Coupled Model Intercomparison Project Phase 5; http://cmip-pcmdi.llnl.gov/cmip5/). We can see that warming of 3-5°C is expected for much of the West.

Data from a large collection of WCRP’s Coupled Model Intercomparison Project phase 5 climate projections spatially downscaled over the U.S.
Question 1 of 2
Referring to this figure, in which region is the mean annual temperature projected to decrease?
The correct answer is d.
All parts of the area shown are projected to have temperature increases!
3. Factors Impacting Reservoir Pool Elevation » Implications of Projected Warming
Question
What are potential implications of warming temperatures for reservoir inflows, outflows, and losses in snowmelt-dominated basins? (Choose all that apply).
The correct answers are b, c and d.
Warmer temperatures have implications for timing and magnitude of annual runoff, especially in snowmelt-dominated basins. Temperature changes will also affect the proportion of precipitation falling as snow compared to rain. Warmer temperatures are likely to increase losses; both directly from the reservoir as evaporation and in river channels through evapo-transpiration of phreatophytes*. Warmer conditions are also likely to increase water use/demands. Thus, the expected effect of warming is drier conditions, absent a mitigating increase in precipitation.
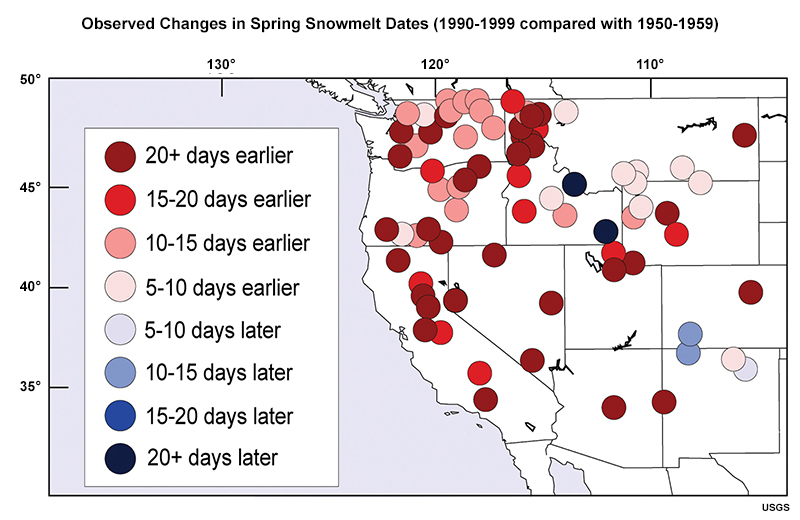
The figure above shows the observed change in onset of spring runoff pulse. Reddish-brown circles indicate significant trends toward onset more than 20 days earlier. Lighter circles indicate less advance of the onset. Blue circles indicate later onset. The changes depend on a number of factors in addition to temperature, including altitude and timing of snowfall.
*Phreatophyte: a deep-rooted plant that has its roots constantly in touch with moisture. Phreatophytes can usually be found along streams where there is a steady flow of surface or groundwater in areas where the water table is near the surface.
For a comprehensive introduction to how climate projections are prepared, see:
Preparing Hydro-climate Inputs for Climate Change in Water Resource Planning
https://www.meted.ucar.edu/training_module.php?id=959
3. Factors Impacting Reservoir Pool Elevation » Projected Changes in Precipitation
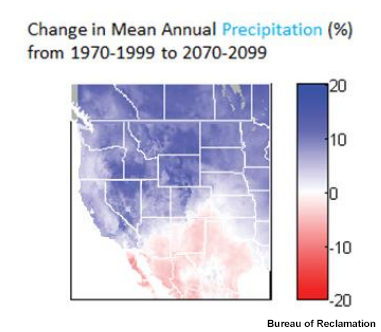
Shown here are projected changes in mean annual precipitation between the same 30-year periods for the western United States, also derived from CMIP5. (See http://cmip-pcmdi.llnl.gov/cmip5/ for more information.)
Question 1 of 3
Mean projected changes in precipitation show _____ across geographic locations.
(Choose the best answer.)
The correct answer is c.
Projected changes in precipitation are more variable across locations. Portions of the country may see increases, while others may see decreases. It is important to note that although for a given region the mean projection may be wetter, individual projections may range from drier than historical conditions to much wetter.
3. Factors Impacting Reservoir Pool Elevation » Effects of Seasonality and Precipitation Phase
Mean annual change in temperature and precipitation does not fully capture the complexity of climate change impacts on reservoir pool elevations. Climate change impacts also depend on factors such as seasonality of changes in runoff timing and efficiency.
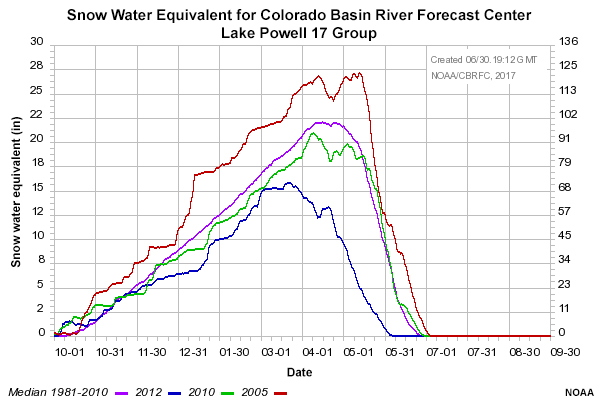
Much of the supply for western water projects originates as snow. Many reservoirs in this region must manage a snowmelt-dominated watershed and associated Spring runoff. Traditionally, April 1st snow water equivalent is used as the benchmark for determining whether runoff will be above or below average. However, looking to a warmer climate, with higher temperatures and less precipitation falling as snow, runoff is likely to occur earlier.
The figure above shows the 30 year median snow accumulation in the Upper Colorado River Basin.
Question
Which plot above represents a more likely pattern under climate change?
The correct answer is c.
The 2012 line shows the type of year that could become more common in the future due to warmer conditions associated with climate change. Note that the peak is lower than the historical median and occurs approximately 3 weeks earlier.
3. Factors Impacting Reservoir Pool Elevation » Regional Trends

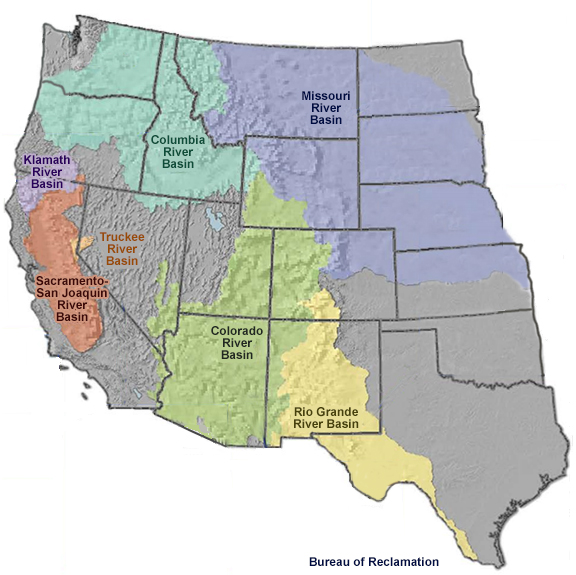
Click on the above image to see information on overall projected trends for each basin.
Question 1 of 2
Overall, there is a shift to greater winter flows, lower summer flows, and an earlier runoff peak. Annual volumes also appear to decline, although some areas may experience modest increases.
Climate assessments, such as the National Climate Assessment (NCA) (http://nca2014.globalchange.gov/) provide information about observed changes, current climate and expected future trends. Ensemble modeling makes use of multiple model outputs to provide us with a sense of the range of possibilities in an uncertain system. Most climate assessments rely on an ensemble of projections from leading climate modeling centers around the world. The most well known of such ensembles is the Coupled Model Intercomparison Project (CMIP) (http://cmip-pcmdi.llnl.gov/cmip5/) which provides a standard experimental protocol for climate modeling. CMIP ensembles are produced approximately every five years.
From one ensemble to the next, projections for a particular climate variable at a location and time in the future may change for a variety of reasons, including implemented enhancements in the model, different emission-forcing data, and the inherently chaotic nature of climate modeling (i.e., the same model will produce different results from one run to the next, even if run exactly the same way). If a single model’s projection changes from one generation to the next, it will have implications for the ensemble’s distribution. Additionally, as new modeling centers continue to emerge with models to include in the ensemble, this can also contribute to changes in the ensemble distribution.
Differences between ensemble generations can be challenging to contend with, especially if the changes are significant. In these situations, it is important to be “an informed consumer”. By evaluating the differences between models or ensemble generations, it is possible to diagnose the origins of the differences. This can help us to make informed decisions as to which projections to use.
Please note, when comparing projections, it is important to compare the full distribution of each ensemble, not just the change in means. Comparing only the means can hide information and implies more certainty than actually exists. Planning for a range of potential future conditions in a flexible framework will better position you to accommodate changes in a model or ensemble’s projections, should they occur.
3. Factors Impacting Reservoir Pool Elevation » Increased Demand
Demands for water may increase under climate change, especially for outdoor water uses—notably for outdoor municipal and industrial (M&I) and irrigated agriculture uses. Warmer temperatures extend the growing season and can result in higher plant evapotranspiration rates. As such, the irrigation season may become longer, and the average daily irrigation demand may increase.
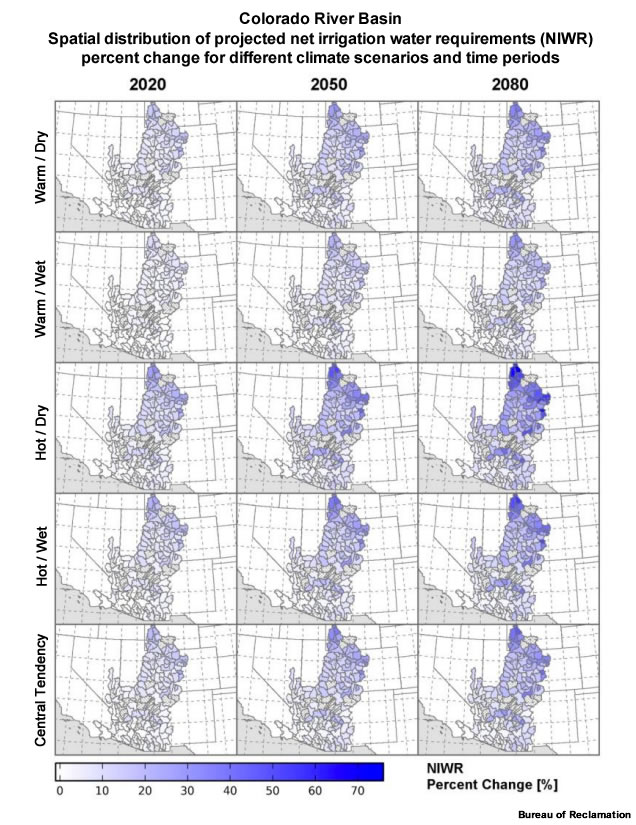
The figure above shows projected changes in the net irrigation water requirement (NIWR) for the Colorado River Basin, for several future climate scenarios and for different time periods.
Question
In which part of the basin do we see the largest projected percent increases?
The correct answer is b.
Interestingly, the largest percent increases in NIWR occur in the Upper Basin. By virtue of the current essentially year-round growing season in much of the Lower Basin, and the typically warm weather, the NIWR increases are modest as percentages. In the Upper Basin, there is considerable room for the growing season to expand earlier in the spring and later in the fall due to warmer temperatures, hence the large relative (percent) change. (Of course, despite the higher projected change, the total use is still much lower compared to the Lower Basin on a per acre basis.)
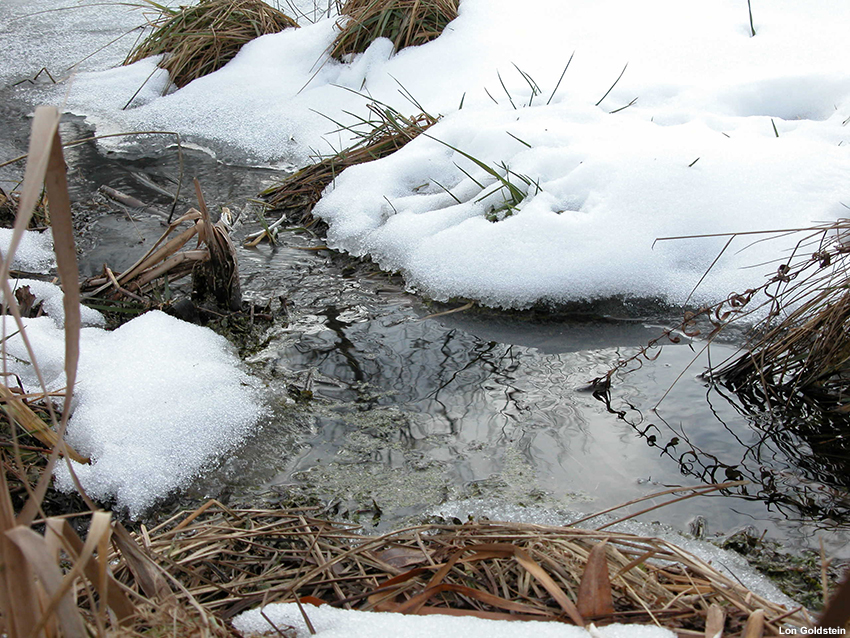
3. Factors Impacting Reservoir Pool Elevation » Increased Releases and Losses
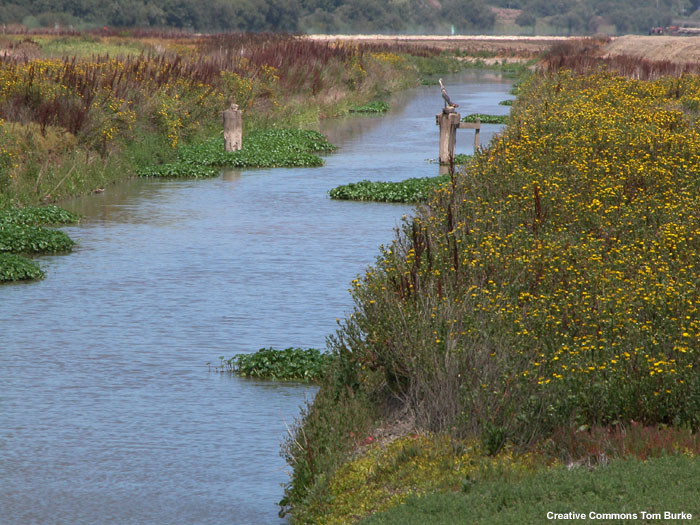
Increased net irrigation water requirement (NIWR) may contribute to a greater demand for water, which may result in larger releases from the reservoir. Releases may need to be further increased to offset travel losses between the reservoir and the point of diversion/delivery.
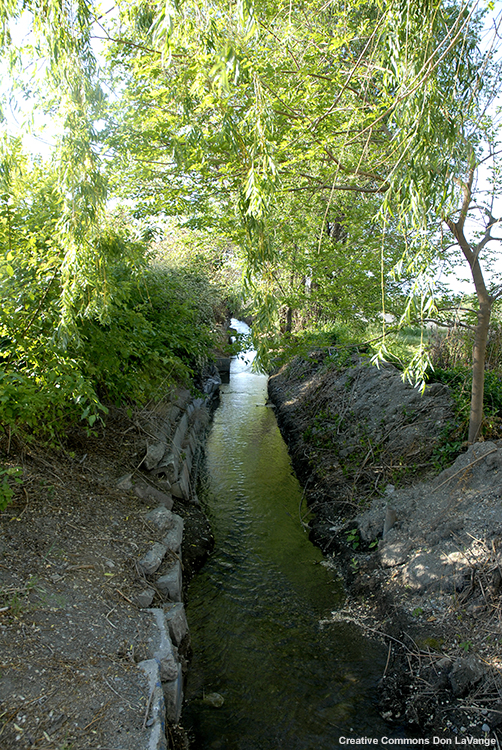
Waterway with phreatophytes along edges.
Question
Much in the same way that warmer temperatures create a longer growing season for crops, they also create a longer “season” for streamside phreatophytes, plants which deplete flow from the river channel. Under expected climate change conditions, losses from streamside evapotranspiration may start earlier and increase in magnitude. This also plays a role in explaining how warmer conditions lead to lower expected runoff efficiencies.
3. Factors Impacting Reservoir Pool Elevation » Reservoir Evaporative Losses
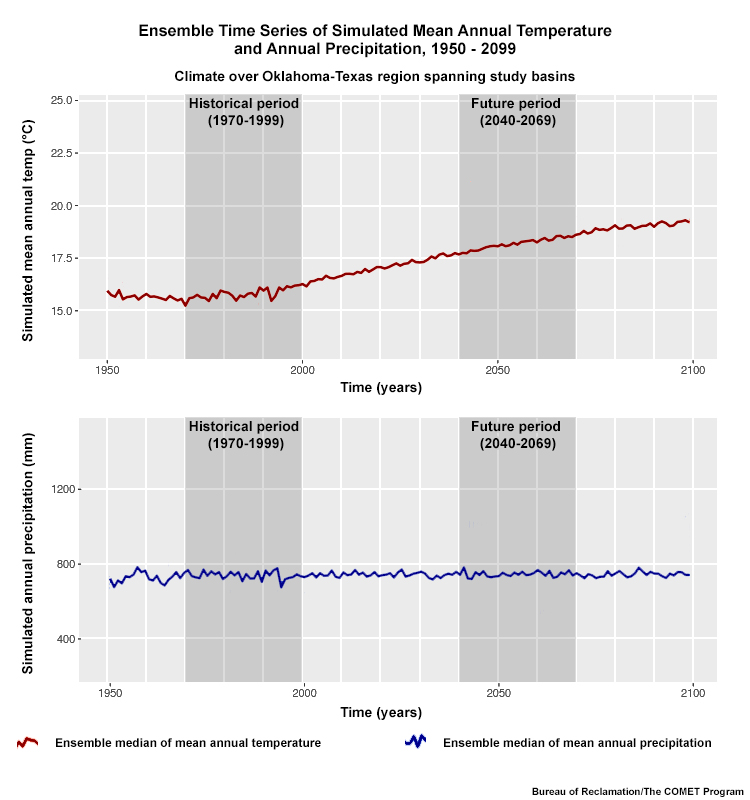
Changes in precipitation and temperature; notably temperature increases, have the potential to increase evaporative losses from reservoirs themselves. In much of the Western U.S., reservoir evaporation is a considerable source of loss.
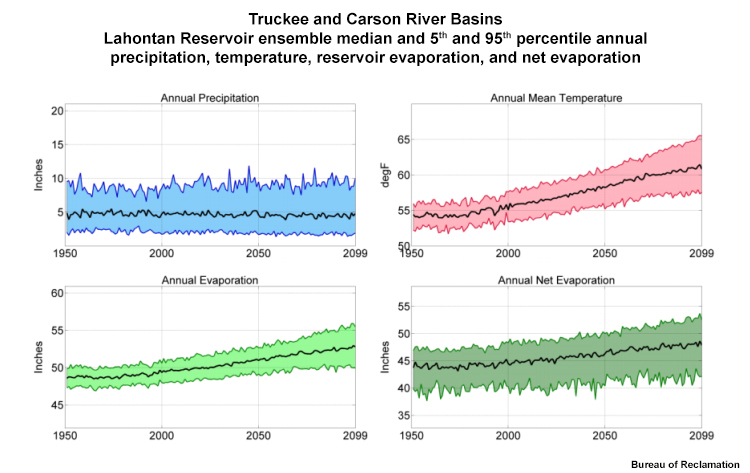
The above figure shows modeled precipitation, temperature, evaporation, and net evaporation (evaporation reduced by precipitation) for 1950–2099 at Lahontan Reservoir. Precipitation changes do not show a strong trend, but they do show large variability. However, temperature shows a clear increase, albeit with varying magnitudes across the model spread. Expected changes in evaporative loss are largely driven by this temperature signal and accordingly the two variables’ plots track quite similarly. Net evaporation shows the same trend as evaporation, but with the added variability from precipitation. Other important drivers of direct evaporation include winds and relative humidity.
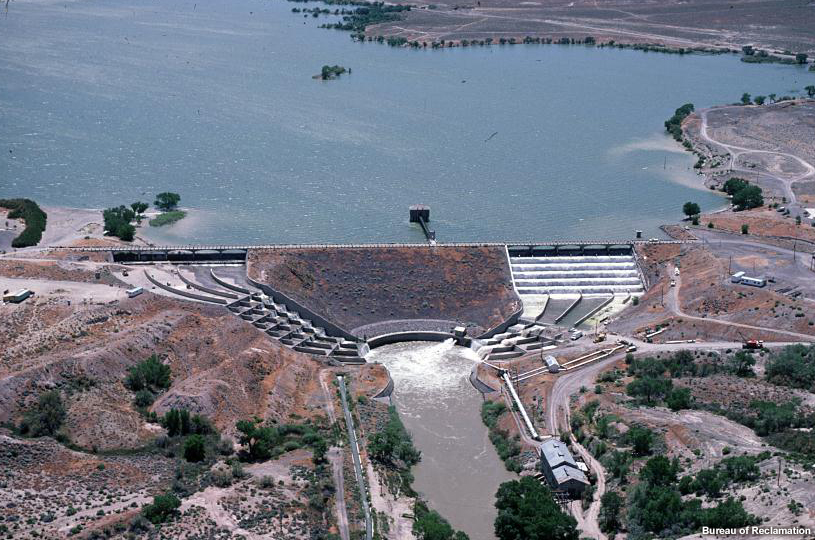
Lahontan Reservoir
Current annual net evaporation from Lahontan Reservoir is almost 4 feet of pool elevation loss every year. Warmer conditions are anticipated to increase this net loss by approximately 7.5% over the current century.
4. Planning for Change
In approaching the issue of planning for asset management over time, we can either start from projected climate conditions and work down to the infrastructure decisions needed to be prepared—a top-down approach. Alternatively, we can start with the known characteristics of the infrastructure and use climate projections to identify vulnerabilities—a bottom-up approach.
Using the top-down approach, for example, we might rely on specific regional climate projections to estimate future conditions at our facility. We might then compare the existing or proposed infrastructure against the projected conditions to assess resiliency.
With a bottom-up approach, if we know for example that pool-elevation below a certain level will result in damaging cavitation to turbines, we could use the projections of future climate coupled with a reservoir operations model to understand the likelihood of going below that level.
4. Planning for Change » Planning With High Uncertainty
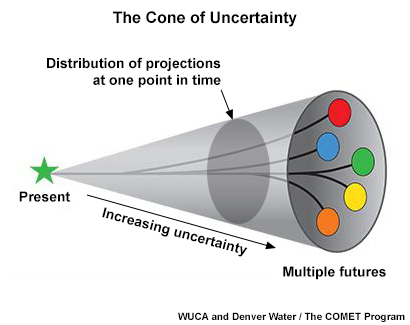
How to plan under wide range of possible projections?
The levels of uncertainty related to climate change impacts can be daunting. Will conditions become wetter or will water become increasingly scarce? This may seem overwhelming, but water managers have long dealt with hydrologic and other sources of variability in their planning and operations processes. In the past we characterized uncertainty based on the patterns of variability over time. The difference going forward is that as the patterns change, we expect the uncertainties to continuously change as well. Looking to the future, we need to think differently about our approaches to operations and planning, as well as how we use observations and projections.

Decision makers have been increasingly using a new class of methods for dealing with uncertainties. These methods, sometimes referred to as DMDU – Decision Making under Deep Uncertainty, offer a new approach for improving decision-making in the face of considerable uncertainty. DMDU techniques often approach a decision from the “bottom up” – meaning rather than try to predict future conditions precisely and plan for that scenario, they aim to better understand a system and how it will respond under a range of conditions. This allows potential decisions to be evaluated for “robustness” relative to the uncertainty at hand.
Using this knowledge of “robustness”, coupled with an understanding of the potential consequences or impacts of a decision for a given scenario can provide valuable guidance in decision-making. If a particular outcome is critical, one might select a more expensive approach that all but guarantees a positive result. However, for a situation where there is more flexibility in the range of acceptable outcomes, a cost-effective approach that addresses some portion of the uncertainty range may be sufficient.
For more information about DMDU, see http://www.deepuncertainty.org/
5. Infrastructure Management Examples
Lake Mead
Lake Mead has experienced protracted below average pool elevation conditions over the past 15+ years. Although it is difficult to discern the degree to which this is due to/associated with climate change, it is believed that these types of conditions are increasingly likely and will be more severe in the future due to climate change for many of the earlier discussed reasons.
Two examples of infrastructure investments associated with the low reservoir elevations at Lake Mead include the design of replacement turbine runners for the Hoover Dam Power Plant and the Southern Nevada Water Authority's (SNWA) decision to invest in a new intake and pumping station to draw water from a deeper part of the reservoir.
5. Infrastructure Management Examples » Hoover Power Plant
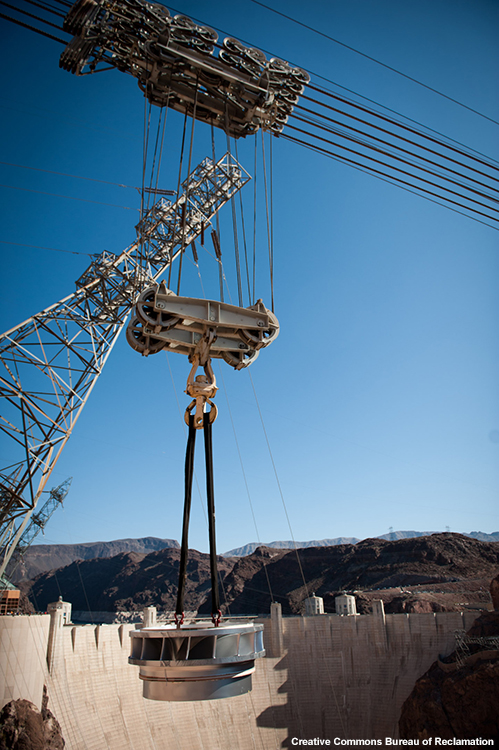
In the case of the turbine runner replacement, a wide-head design was chosen. This design better maintains generating efficiency across a range of head or pool elevation conditions, as compared to a design more suited for high head or a full reservoir.

At Hoover, the original turbines were designed for a head range of 400 feet to 570 feet, which corresponds with lake elevations of 1050 to 1220 feet (above sea level) respectively. The wide head turbines were designed for a head range 350 feet to 570 feet, or lake elevations of 1000 to 1220 feet respectively. In recent years, elevations have largely been lower than 1100 feet. The new wide head turbines are more efficient, have smaller rough zones*, and work more efficiently at low heads.

Single widehead turbine runner for Hoover Dam.
In the past, under lower reservoir pool elevations, there were certain load ranges that required two units to operate below their individual rough zones. This was inefficient for both units. With the wide-head turbines and their smaller rough zones, often a single wide-head turbine unit can meet that entire load and do it more efficiently, which raises the plant efficiency as a whole. The objective of this investment is to reduce operation and maintenance costs by significantly reducing damaging operating conditions while increasing generation efficiency. The investment in these new turbine runners is projected to pay for itself multiple times over the life of the runner through increased hydropower revenues. This example addresses current conditions while providing the ability to effectively operate under a wide range of possible future reservoir pool elevations.
*Rough Zone: Specific operating conditions for a given turbine defined by a combination of flow rate and head that cause cavitation and stress on the unit.
5. Infrastructure Management Examples » Southern Nevada Water Authority (SNWA) Intake and Pumping Station
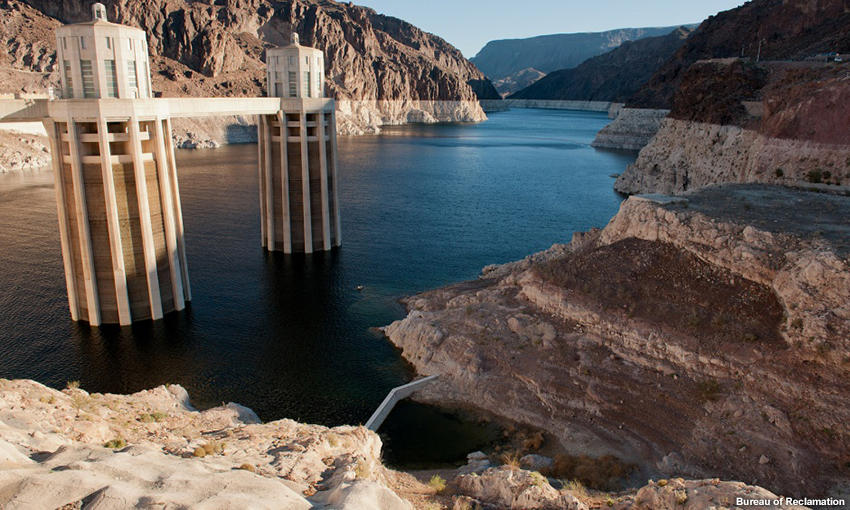
Southern Nevada Water Authority (SNWA) is the primary water provider for the greater Las Vegas area. SNWA has responded to declining lake levels with an investment in a new intake and pumping station to address current needs while also preparing for projected future conditions associated with climate change.
The Water Authority draws water directly from Lake Mead, i.e. it is not released from the dam through the power plant. Water is pulled from the lake via multiple intakes and pumping plants.
As lake levels declined, beginning in 2000, it was recognized that persistent drought could send the reservoir below elevation 1050 feet, the depth at which one of SNWA’s intakes becomes inoperable. This, coupled with water quality considerations associated with declining lake levels led SNWA to pursue a third intake at 860 feet above sea level in the deepest part of the lake.
Additional pumping capacity is required to lift water from the this intake during extremely low lake levels. SNWA is currently developing this capacity and anticipates it will be completed in 2018. SNWA considers this an example of a “low regret” investment—albeit of considerable cost— (~$1.5B) as it secures water supply quantity and quality in the near term and offers long-term benefits of building resiliency in the face of projected changes in hydrologic conditions.
6. Summary
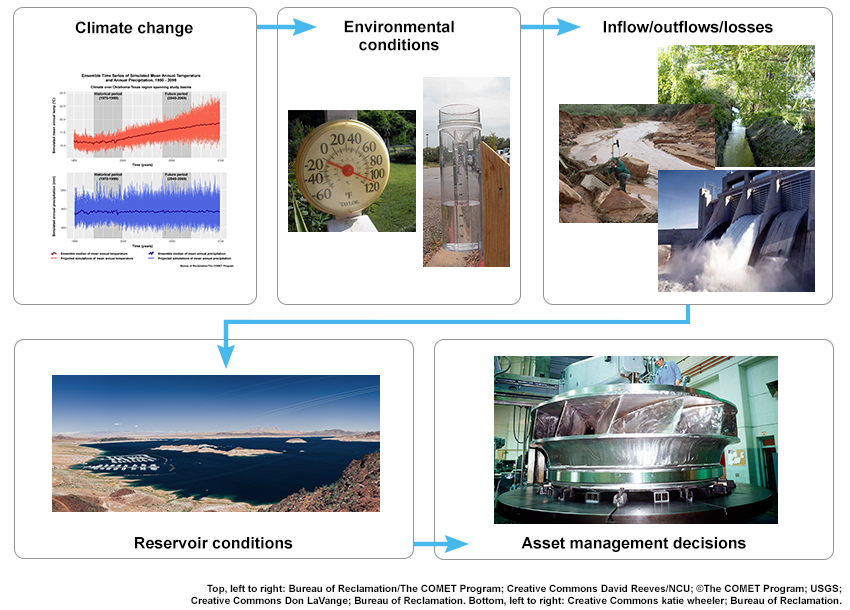
We discussed how reservoir conditions, including pool elevation, drive decisions related to management of assets over time. Reservoir conditions are driven by changes to inflows, outflows and water losses due to evapotranspiration and other effects. Inflows, outflows and losses are driven by environmental conditions such as temperature and precipitation, which in turn are affected by changes in the climate over time.
Many of the physical, hydrologic processes that determine water supply (or scarcity) in a given year also drive expected longer-term trends in reservoir conditions. For example, years with below average precipitation tend to result in lower reservoir conditions and drought. Similarly, warmer temperatures can reduce runoff and increase demands as well as losses. Such conditions have historically varied year to year and even within a given year.
This variability is often a significant portion of the motivation for the construction of dams and reservoirs authorized for managing water supply. Under a changing climate, these physical processes and weather/climate variations will continue, with an additional challenge of temperatures becoming increasingly warmer decade over decade. Projected precipitation changes have less consensus at this time, which poses the additional task of addressing uncertainty.
Glen Canyon
Long-term operation and management of reservoir infrastructure benefits from approaches that do not solely rely on historical conditions, but rather consider a range of possible future conditions—while leveraging the knowledge that warming temperatures are all but certain. By taking into consideration a well-informed set of climate projection scenarios for a given location it is possible to make robust asset management decisions. By estimating possible changes to the drivers of reservoir operating conditions based on these projections, asset management decisions can be based on the best information available at this time.
Contributors
COMET Sponsors
MetEd and the COMET® Program are a part of the University Corporation for Atmospheric Research's (UCAR's) Community Programs (UCP) and are sponsored by NOAA's National Weather Service (NWS), with additional funding by:
- Bureau of Meteorology of Australia (BoM)
- Bureau of Reclamation, United States Department of the Interior
- European Organisation for the Exploitation of Meteorological Satellites (EUMETSAT)
- Meteorological Service of Canada (MSC)
- NOAA's National Environmental Satellite, Data and Information Service (NESDIS)
- NOAA's National Geodetic Survey (NGS)
- National Science Foundation (NSF)
- Naval Meteorology and Oceanography Command (NMOC)
- U.S. Army Corps of Engineers (USACE)
To learn more about us, please visit the COMET website.
Project Contributors
Program Manager
- Tsvetomir Ross Lazarov – UCAR/COMET
Project Lead
- Lon Goldstein – UCAR/COMET
Instructional Design
- Lon Goldstein – UCAR/COMET
- Alan Bol – UCAR/COMET
Science Advisors
- Ken Nowack – U.S. Bureau of Reclamation
- Keely Brooks – U.S. Bureau of Reclamation
- Laurna Kaatz – U.S. Bureau of Reclamation
Graphics/Animations
- Steve Deyo – UCAR/COMET
- Sylvia Quesada – UCAR/COMET
Multimedia Authoring/Interface Design
- Gary Pacheco – UCAR/COMET
COMET Staff, July 2017
Director's Office
- Dr. Rich Jeffries, Director
- Dr. Greg Byrd, Deputy Director
Business Administration
- Dr. Elizabeth Mulvihill Page, Assistant Director of Operations and Administration
- Lorrie Alberta, Administrator
- Tara Torres, Program Coordinator
IT Services and Production Services
- Tim Alberta, Assistant Director of IT and Production
- Bob Bubon, Systems Administrator
- Steve Deyo, Graphic and 3D Designer
- Dolores Kiessling, Software Engineer
- Gary Pacheco, Web Designer and Developer
- Sylvia Quesada, Production Assistant
- Joey Rener, Software Engineer
- Malte Winkler, Software Engineer
International Program
- Paul Kucera, Project Manager
- Rosario Alfaro Ocampo, Translator/Meteorologist
- Bruce Muller, Project Manager
- David Russi, Spanish Translations
- Martin Steinson, Project Manager
Instructional Services
- Dr. Alan Bol, Scientist/Instructional Designer
- Lon Goldstein, Instructional Designer
- Bryan Guarente, Instructional Designer/Meteorologist
- Tsvetomir Ross-Lazarov, Instructional Designer
- Marianne Weingroff, Instructional Designer
Science Group
- Dr. William Bua, Meteorologist
- Patrick Dills, Meteorologist
- Lindsay Johnson, Student Assistant
- Matthew Kelsch, Hydrometeorologist
- Andrea Smith, Meteorologist
- Amy Stevermer, Meteorologist
- Vanessa Vincente, Meteorologist