The Urban Heat Island Effect
Heat and the City

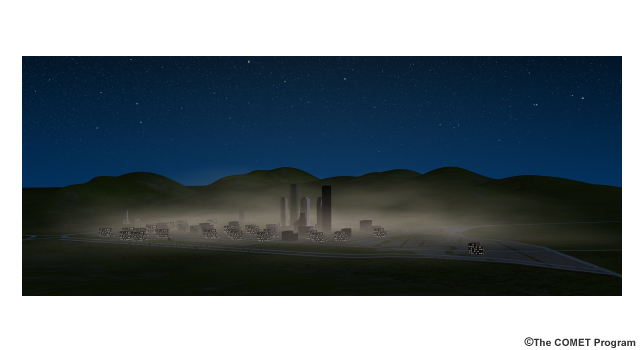
When Atlanta hosted the Olympics in 1996, the National Weather Service collected detailed data on the region’s weather in order to predict conditions for the competing athletes. Scientists studying this data saw that urban Atlanta was consistently warmer than surrounding rural areas, especially at night. They also noticed something else: sprawling metro Atlanta and areas downwind of Atlanta actually got different amounts of rain and more
What they were seeing was the impact of the urban heat island effect.
Question
Which of the following characteristics of the built environment play a role in creating the urban heat island effect? (Choose all that apply.)
All of these are factors that increase the amount of heat trapped and produced in an urban setting.
Please continue watching the video above.
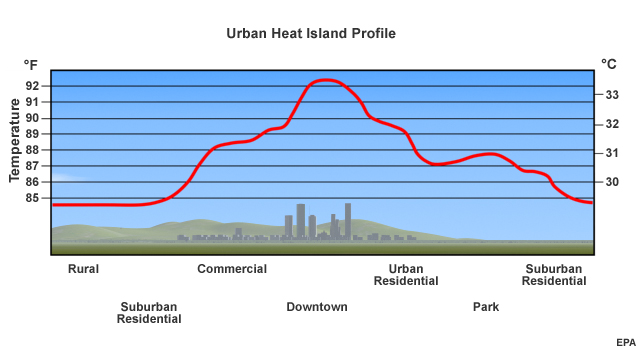
Heat islands form as vegetation is replaced by asphalt and concrete for roads, buildings, and other structures built to accommodate growing populations. Those surfaces absorb - rather than reflect - the sun's heat, causing surface temperatures and overall ambient temperatures to rise. The result: more heat and more air pollution over cities and suburban areas than the surrounding countryside.
The impact of this urban heat island varies by city. Local topography, native vegetation, weather, and geographic location can enhance or inhibit the heat island effect. The effect was so large and noticeable in Atlanta because the fast-growing region had been converting an average of 55 acres of trees per day to roads, parking lots and rooftops.
Let's take a closer look at specific causes of the urban heat island, how the urban heat island impacts our quality of life, and what your viewers can do to dampen the effects.
Albedo, Emittance, and Stored Energy
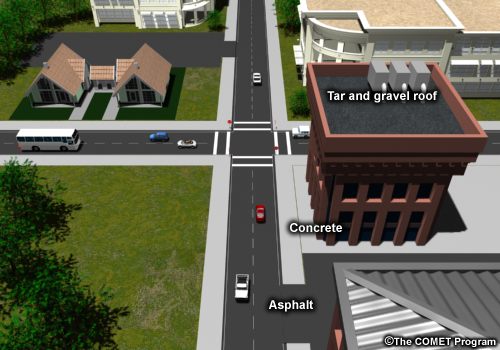
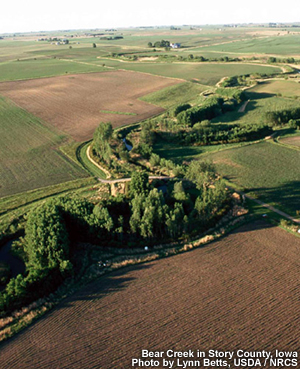
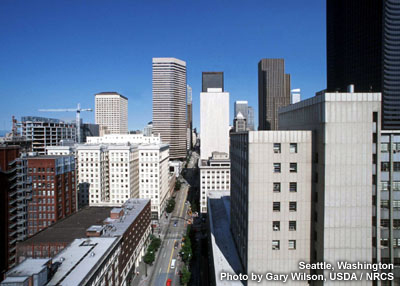
Walk down a city street on a summer afternoon and you’ll often see sweltering waves of heat coming off the pavement and buildings. It’s no coincidence you wouldn’t see this walking down an unpaved country lane: the urban heat island gains much of its heat from the constructed surfaces inside cities. As our cities grow and our dependence on the automobile increases urban sprawl, we are continually replacing natural ground cover with manmade materials. These materials—such as concrete, asphalt and roofing shingles—have a very different effect on the way heat is exchanged between the earth's surface and the atmosphere.
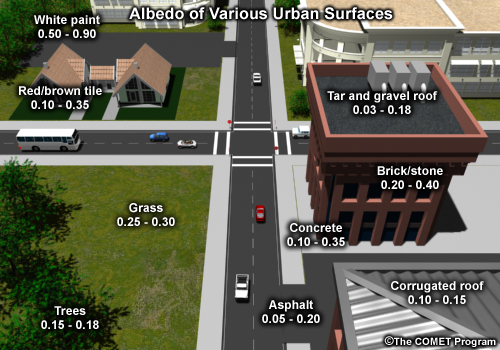
The difference starts with the reflective properties of built materials. The percentage of solar energy reflected from a material's surface is known as its albedo: the lower the albedo, the less radiation is reflected by the material.
Question
An albedo of 1.0 indicates that all radiation is reflected off the materials surface and an albedo of 0.0 indicates that all incoming radiation is absorbed. Match the following materials with their albedo.
Please continue watching the video above.
The albedo of commonly found surface materials varies widely but is very low for many of the surfaces found in cities and towns. Asphalt and tar roofing materials are poor reflectors of radiation; they have a very low albedo.
Urban materials also differ from undeveloped land in their “thermal” properties, such as density, specific heat, heat capacity and thermal conductivity. These thermal properties allow them to absorb and store heat better than living ground cover. Once absorbed, this stored energy is slowly released as heat to the surrounding environment.
The combination of lower reflectance and better heat storage of construction materials in cities means more heat is captured and released into urban environments. The effect is noticeable at night, when paved surfaces radiate heat long after sunset. Since two-thirds of many metropolitan areas are paved or covered by buildings, cities thus contain a much larger reservoir of stored energy and warm surfaces than surrounding farmlands and forests.
The urban heat island isn’t caused exclusively by building materials. City layout is also a factor. The tall buildings that form city centers create artificial canyons which provide many surfaces for reflection and absorption, promoting warming and heat retention. At night, tall, warm buildings block the view from the ground to the colder sky, inhibiting cooling during a time when an open field would lose much of its energy to the atmosphere. Tall buildings also block wind which might otherwise sweep heat away. Local weather, climate and topology can also promote or inhibit the effect.
Plants and Evapotranspiration
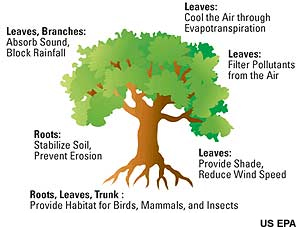
Ah, the shade of a tree on a hot afternoon. The shade trees provide is a significant source of cooling, and the scarcity of trees in city centers promotes the urban heat island effect. But trees don’t just provide a respite from the sun's rays. They also "breathe" out water vapor through a process called transpiration which helps cool the surrounding air through evaporative cooling.
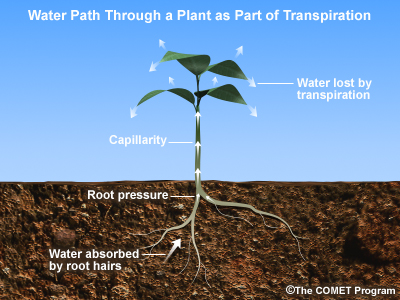
Transpiration’s contribution to the water vapor in the atmosphere – and its corresponding cooling power – is not trivial. Studies have shown that it accounts for a good ten percent of atmospheric water vapor, the rest coming from evaporation of water directly from soil and water bodies.
Question
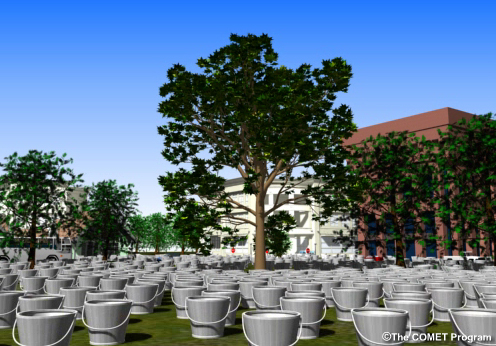
How much water is transpired by an average sized oak tree over a year?
The correct answer is c.
Please continue watching the video above.

It has been estimated that over the growing season, one acre of corn plants may transpire 400,000 gallons of water. In liquid form, the water would cover the field with a lake 15 inches deep. A large oak tree alone can transpire 40,000 gallons of water per year.
Plants aren’t the only natural feature that provides built-in cooling. Water also evaporates from the soil or bodies of water, serving as natural air conditioning. The built environment usually has less surface water and free soil than outlying rural environments and so less evaporative cooling.
Waste Heat
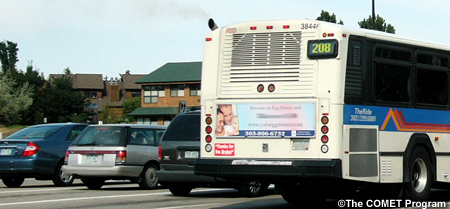
Look around any urban area, and it's not hard to spot sources of heat and exhaust. They are byproducts of the combustion engines that drive transportation and industry. Add to that, heat given off by the air conditioning systems we use to cool our homes and office buildings, and there is an abundance of waste energy routinely pumped into the urban atmosphere.
Each individual source of heat, whether a car, an air conditioning unit, or a small factory, may not be a significant contributor, but thousands of sources make an impact. A study of Tokyo, Japan, in 1995 concluded that the waste heat from the city’s downtown district alone raised nighttime temperatures by five degrees Fahrenheit.
Climatology
Question
When are the effects of the urban heat island most noticeable? (Choose all that apply.)
The correct answers are b, d, e, and f.
Please watch the video below.
The effects of the urban heat island are most noticeable at night and during times of high pressure, light winds, and clear skies. In the sun’s absence, the stored energy in the concrete and asphalt is released as long wave radiation. Man-made sources of heat also contribute to warming the urban boundary layer. This is more noticeable during the longer, colder winter nights.

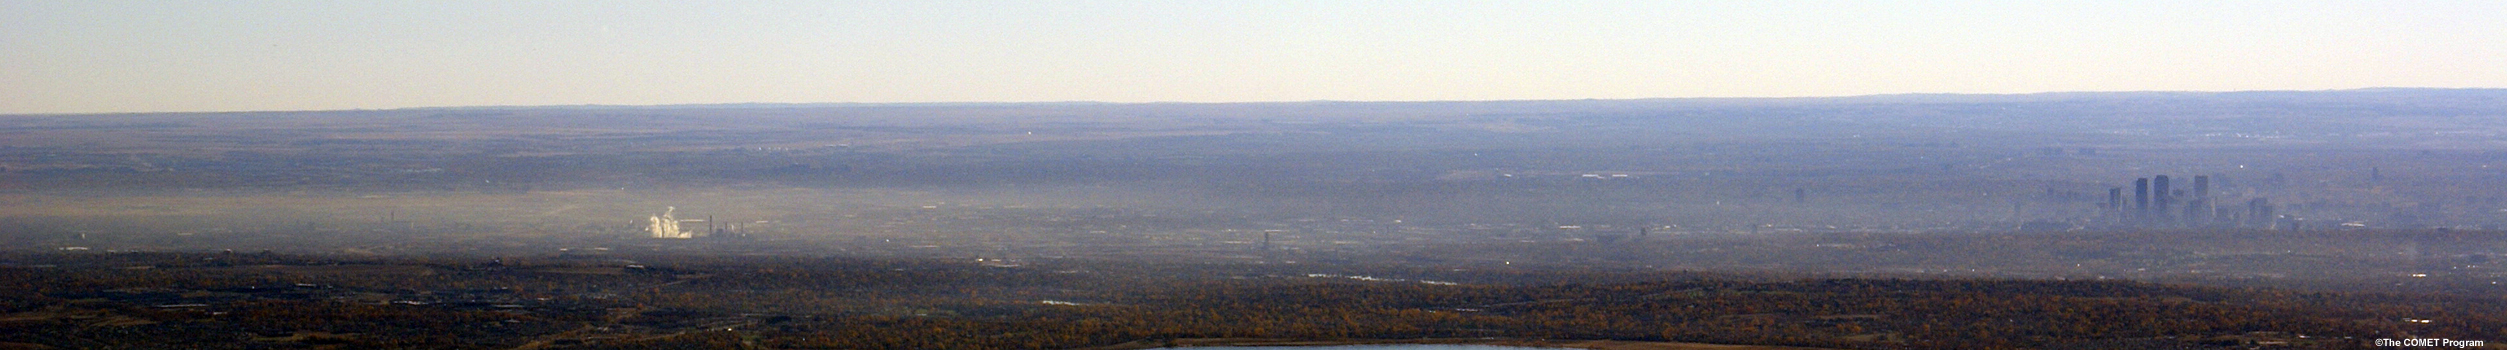
The presence of the urban heat island affects the climate of an urban area. It certainly raises average temperatures. In some cities, it also causes more haze and fog. The urban boundary layer tends to trap small particles, or particulates. When relative humidity levels reach seventy plus percent, water vapor condenses on these particles, forming haze or fog.
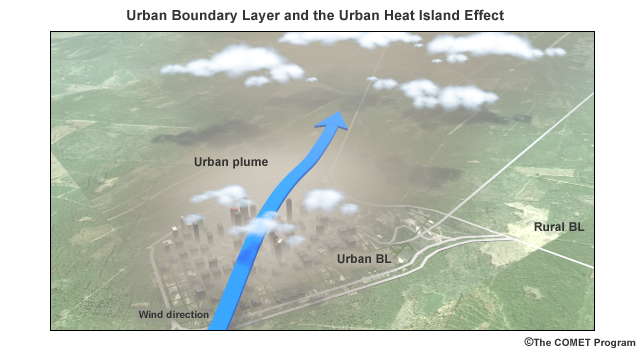
The urban heat island has also been shown to increase precipitation in areas just downwind from a city center. The built environment provides surface roughness to slow oncoming winds. The warm surfaces in the urban heat island create an area of low pressure. The combined effect is an area of convergence above the urban area. Add to this an increase in the concentration of cloud–forming particles and it leads to an associated increase in clouds and precipitation in the downwind areas of the urban boundary layer.
There is no single solution to reducing the urban heat island and its impacts. Just as each exhaust pipe and air conditioner contribute to the urban heat island, each step taken by individuals and communities can help reduce their impact.
Air Quality and Airborne Pollution
Air Pollution: A Major Health Risk
In 2006, the American Lung Association reported that over 150 million people live in U.S. counties that regularly have unhealthy levels of smog or particle pollution.
Question
The number of Americans currently suffering from asthma is at least:
The correct answer is d.
Please continue watching the video above.
With more than 20 million Americans suffering from asthma and another 12 million suffering from chronic obstructive lung disease, there is little question that air pollution is a serious concern in many urban areas.
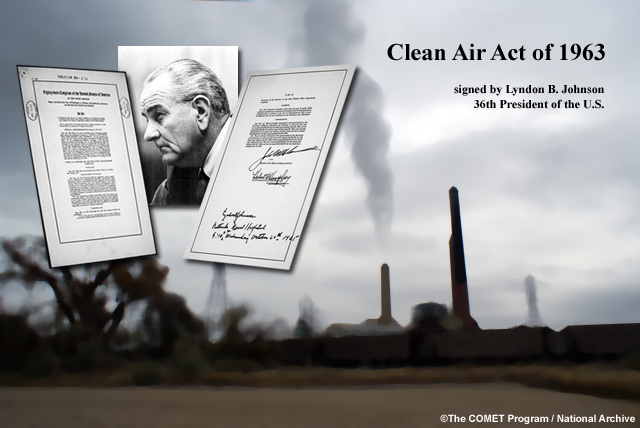
As with water, the EPA has led efforts to regulate air pollution. The original Clean Air Act of 1963 has been amended several times to more effectively tackle the issue. Yet despite EPA’s best efforts, our dependence on combustion engines in transportation, our reliance on coal to power our electric plants, and our use of heating oil to fire home furnaces all contribute to the problem. And in certain weather conditions — low wind speed, high stability, and shallow mixing depth —conditions can quickly become unhealthy.
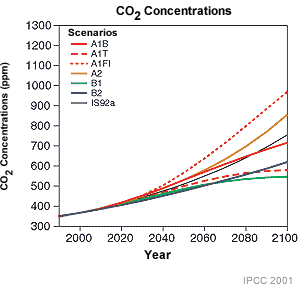
In addition to the health risks posed by many air pollutants, green house gas emissions are increasingly affecting our climate. Though climate change is not a focus here, regulations and activities that reduce air pollution also reduce green house gas emissions.
Sources of Air Pollution
Air pollution is generated by many human activities. Those include the obvious -- like driving cars, trucks, and busses, and operating power plants and factories -- but also from less obvious sources like the use of lawnmowers, fertilizers, pesticides, paints, varnishes, and cleaning agents.
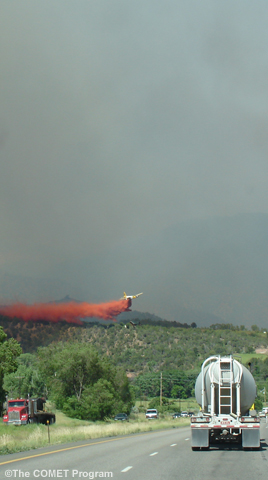
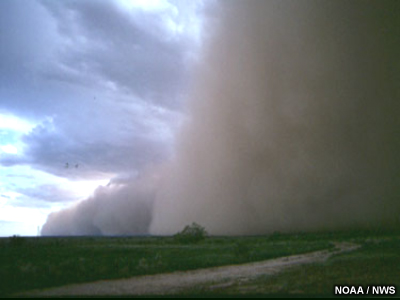
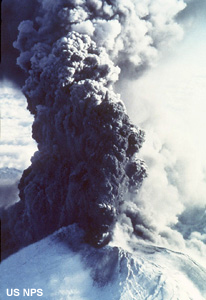
Air pollutants are also generated naturally from smoke and ash from wildfires, sand and organic matter picked up by winds, pollen and other organic compounds from plants, and gasses and ash from volcanic eruptions.
Though these sources produce many pollutants, the Clean Air Act requires that the EPA set ambient air quality standards only for the six most common: ozone, carbon monoxide, sulfur dioxide, nitrogen dioxide, particulate matter, and lead.
Lead regulation – and especially the phase-out of leaded gasoline -- has been highly successful. Since 1980, the levels of lead in the air have been reduced by ninety six percent.
A lesson for all of us to keep in mind: though human activity is the cause of much air pollution, human action also mitigates the cause.
Heat, Summer Sun and Ozone
Though air pollution is emitted in both rural and urban areas, its sources are more highly concentrated in the built environment. Higher source density and the urban heat island effect work together to produce more air pollution in cities.
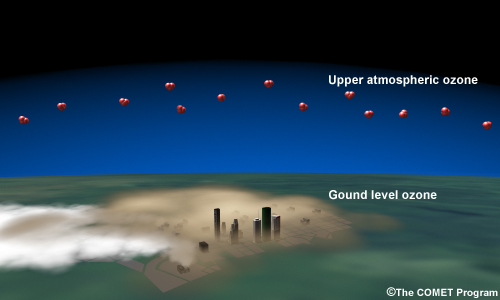
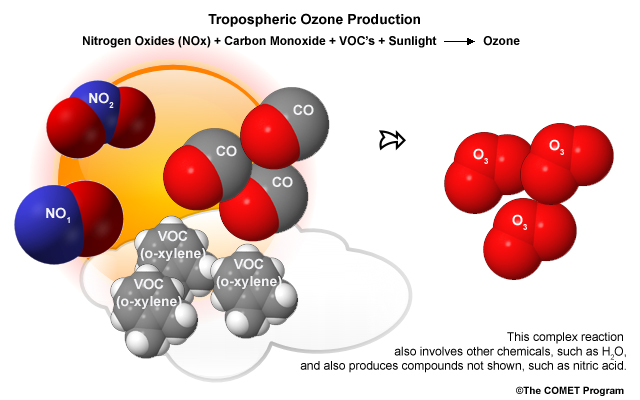
During warm months, ground-level ozone is the chief cause for concern. Unlike ultra-violet shielding upper-atmospheric ozone, ground-level ozone is a harmful pollutant. Ozone is a powerful oxidizer that can inflame lung tissue and damage plants. It's readily produced in warm temperatures when sunlight interacts with nitrogen oxides and volatile organic compounds released by the combustion of carbon-based fuels.
Eight-hour average ozone concentrations in the U.S. typically range from 40 to 150 parts per billion. Values below 50 parts per billion are considered healthy, while concentrations above 100 parts per billion are considered unhealthy. AIRNow's Air Quality Index puts these measurements into a useful rating system you can share with your viewers.
Because transportation is the largest man-made source of ozone components, the sprawling regions that require residents to drive longer distances struggle more with air quality compliance than more compact cities. Ozone pollution levels are as much as 41 parts per billion higher in the most sprawling areas, which can mean the difference between safe, “code green” air quality and “code red” air quality, studies have shown.
Ozone is only one of many chemicals produced by the interaction of sunlight, nitrogen oxide, and volatile organic compounds. Formaldehyde, ketones, and various nitrates are also produced. This collection of chemicals is called photochemical smog. Along with suspended particulates, photochemical smog helps create the view-obscuring, eye-tearing haze that plagues cities during hot, calm summer days.
Question
Is ground-level ozone an issue in rural areas as well as in the built environment?
The correct answer is Yes, it is a concern in any rural area down wind from a major urban area.
Please continue watching the video above.
Although urban areas are the major source of ozone-forming pollutants, surrounding areas are also vulnerable. For instance, in the southeastern U.S. during the peak ozone-producing months of June to September, much of the countryside can earn an Air Quality Index rating of "unhealthy". In this scenario, a western extension of the "Bermuda" high can linger for weeks, fostering a stagnant, capped air mass with little cloud cover— perfect conditions for ozone formation—over a large area. Though the cities in this region are the main source of ozone and ozone-producing pollutants, these pollutants are spread through the lower atmosphere under this dome of high pressure.
Though ozone and photochemical smog can be produced during the cooler months of the year, they are primarily a warm season concern. The formation of photochemical smog depends on sunlight, and these reactions happen more efficiently when the sun shines longer and more directly overhead.
However, regardless of season, it's important to keep up to date on the AIRNow's Ozone Now forecast for your area.
Cold Air, Inversions and Particle Pollution
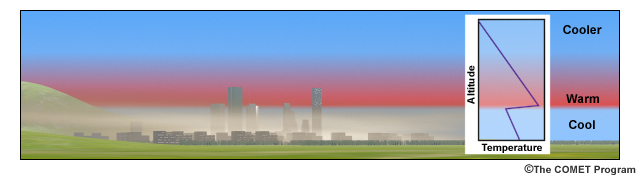
Winter brings weather conditions that promote temperature inversions. Whether a thermal inversion is caused by subsidence, radiant heat loss, or advection, it reduces or eliminates convection and leads to a relatively stable, unmixed lower atmosphere. This dome of cold air traps most airborne emissions in the atmospheric layer below the inversion. When this happens in a city with its many sources of air pollution, airborne pollutants – known as "particle pollution" - can quickly reach unhealthy levels and cause an unsightly haze that can spread to surrounding areas.
Particle pollution is a complex mix of small particles and liquid droplets produced primarily by fossil-fuel combustion. Solids and gases released by combustion react with moisture in the air to form chemically-harmful droplets and solids. Acid rain is a classic example. It forms when sulfur dioxide and nitrogen oxides fall to the ground as solids and react with surface waters or as they react in the atmosphere with water vapor to form chemically reactive droplets of sulfuric and nitric acid.
Particle pollutants can be manmade or natural. Forests fires, gases released from plants or volcanoes, agricultural burns, industrial processes, and dust from sandy or gravelly roads can all be sources.
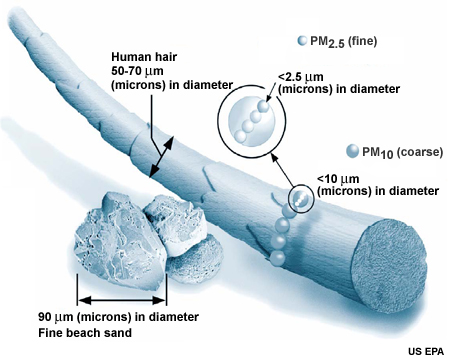
The size and chemical properties of particle pollution make it a health hazard. The EPA classifies particle pollutants as either coarse —those measuring from 2.5 to 10 micrometers across -- or fine —those measuring less than 2.5 micrometers across. Fine particles can cause health problems if breathed into the lungs, where they react with lung tissue or are absorbed into the bloodstream.
AIRNow provides an up-to-date Particles Now forecast for fine particle pollutants on their website. Be sure to consult it regularly and keep your viewers up to date on current conditions.

Greenhouse Gases
The same sources that generate harmful air pollutants also produce greenhouse gasses. Due to their molecular size and geometry, greenhouse gasses trap heat in the atmosphere by absorbing and re-emitting long wave, or infrared, radiation while allowing shortwave radiation to pass by.
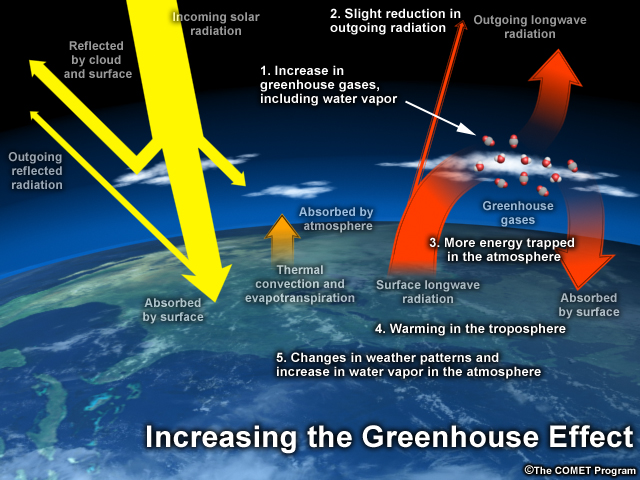
Most solar radiation is shortwave. This incoming radiation passes freely through greenhouse gases to reach the earth's surface. The earth then converts and radiates some of this shortwave energy back towards space as long wave radiation. Some of this long wave radiation is trapped by greenhouse gasses inside the atmosphere. Much of this energy is directed back towards Earth, raising surface and ocean temperatures. As more greenhouse gases are added to the atmosphere, more energy is trapped. As this energy warms the land and oceans, the lower atmosphere, and thus weather and climate, are altered.
Human activity produces four major categories of greenhouse gasses: carbon dioxide, methane, nitrous oxide, and fluorinated gasses.
Because carbon dioxide and nitrous oxide are both fossil fuel combustion products, they are both linked to our use of cars and electricity to power our cities.
Forecasting Air Quality
"High pressure will dominate the weather in our area for the next 5 to 7 days." That's the forecast to beware of when considering air quality. High pressure is the primary cause of conditions that favor poor air quality.
In the summer, warming, sinking air; a lack of cloud cover; and low winds and stagnant air create conditions favorable for photochemical reactions that make ozone and smog. In the winter, high pressure leads to a greater possibility of inversions, trapping pollutants in the urban boundary layer.
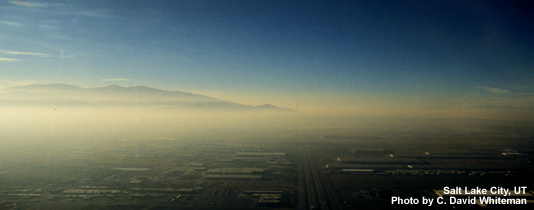
Location is of course also a consideration. Hills and mountains promote the formation and persistence of inversions, and in cities with high ground on one or more sides like Salt Lake City, Denver or Los Angeles, inversions are more common and can last for weeks.
Question 1
Identify the areas of good and poor dispersion on this conceptual graphic of a frontal system.
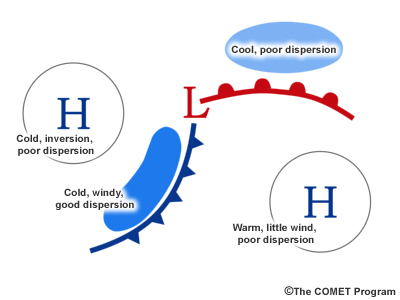
Please continue watching the video above.
Generally, the regions highlighted in this synoptic-scale conceptual graphic show areas of potential good or poor air quality in relationship to fronts.
Of course, mesoscale effects, such as mountain valley winds, local topography, and diurnal effects play a major role in how to tailor your forecast.
Question 2
What is the best source of daily air pollution forecast information?
The correct answer is c.
The AIRNOw Website:
https://www.airnow.gov
Please continue watching the video above.
And be sure to visit the AIRNow website to learn more about including the daily air quality index in your forecast. The AIRNow website includes a section dedicated to weathercasters. It includes many publications and resources that help you learn and share more information about air quality with your viewers.
Reducing Impacts

Regulation of industry at the state and federal level has traditionally been very effective in reducing air pollution. Sulfur, lead and other heavy metals are much less of a problem today due to mandatory emissions reductions from power plants, factories, cars, and trucks. Federal fuel economy regulations -- Corporate Average Fuel Economy or CAFE --reduce the amount of transportation fuel being burned. And fuel additives like ethanol help gasoline burn cleaner, further reducing emissions.
Yet with all of these regulations, we are burning more coal to satisfy our ever-growing electrical needs; we are buying more consumer products; and we are driving more miles with more cars offsetting most regulatory gains because of increased fuel consumption.

So what can you do to help reduce air pollution and greenhouse gas emissions?
Many things. In a nutshell: reduce energy consumption; buy sustainably-manufactured, energy efficient products; and recycle. These actions reduce the amount of air pollutants generated on your behalf. Some of these actions are easy and obvious. Others are not, but many are achievable now and will become even easier to achieve as consumer demand increases availability of energy efficient products.
Explore the suggestions listed at the end of this presentation. They include many practical, easy-to-do actions to reduce air pollution.
Take Aways and References
Story Ideas
The following are suggestions to develop viewer segments related to this unit's content.
Reducing air pollution
There are some very easy actions folks can take to reduce their air pollution emissions. Things like not mowing the lawn on ozone alert days; replacing gas lawn mowers with electric or four-stroke mowers; tanking up your car in the summer in the evening versus the late afternoon; combining errands in a single trip rather than separate trips on separate days. Create a feature piece that highlights simple measures each of us can take to reduce air pollution.
What options are there in your region for taking alternative transportation to work? Investigate the options available such as regional bus systems, light rail, car share programs, commuter share-a-ride programs, bike-to-work programs, etc.
How often does your loacality have high ozone pollution days? What are the major culprits? Present on overview of how low-level ozone forms and what behaviors and resource needs contribute to the problem.
Viewer Tips
Earth Gauge™ Tips
Ten Ways to Save Energy
- Plant trees! Shade trees that are properly placed around your home can reduce air conditioning needs by up to 30 percent. Ask your local garden center or University Cooperative Extension service for tree species recommendations.
- About one-quarter of the average home’s utility bill goes to powering small appliances around the home – TVs, DVDs, cell phone chargers, computers, etc. Unplug small appliances when not in use.
- Insulate your water heater to reduce heat loss by 25 to 45 percent, and save up to nine percent on your energy bill.
- Switch to compact fluorescent light bulbs (CFLs) – they use 75 percent less energy than traditional (incandescent) bulbs, and last significantly longer. (CFLs do contain a small amount of mercury – please recycle them instead of throwing them in the trash).
- Seal leaks around doors and windows to keep the cool air out during winter and in during summer.
- Turn off the faucet. Letting the water run for just five minutes uses the same amount of energy it would take to power a 60-watt light bulb for 14 hours!
- Consider solar-powered garden lighting, which recharges by sunlight during the day and does not require wiring or electricity.
- During the cooler months, turn your thermostat temperature down 10-15 percent for eight hours (try this when you’re sleeping or not home), and save up to 10 percent on your energy bill.
- Buying new appliances? Look for the Energy Star label. Energy Star is a U.S. EPA and Department of Energy program that identifies the most efficient models (www.energystar.gov)
- Before summer, have your cooling system inspected by a professional; do the same with your heating system before winter. A properly functioning system will run more efficiently and effectively.
Ten Ways to Protect Air Quality
- Combine errands that require driving – one longer trip in the car emits fewer pollutants than several short trips and saves time.
- When purchasing new lawn and garden equipment, consider choosing electric or battery-powered versions, which produce fewer emissions than gasoline-powered equipment. If you have a small yard, consider a reel mower and hand-powered tools.
- Excessive engine idling releases carbon monoxide and other air pollutants. Instead of sitting in a drive-through, park your car and walk in. Even better, walk to your destination!
- Encouraging kids to walk or bike to school on nice days can cut down on morning traffic and subsequent air pollution. Help your kids find a safe route to school, or organize a community walking group. If you must drive, consider setting up a carpool with other families.
- Keeping your vehicle properly maintained can significantly reduce emissions. Have your emissions system checked regularly, and never tamper with emissions equipment.
- Keep it in the tank – fill up in the early morning or late evening, when the air is cooler, especially during the summer. At these times of day, gas is most dense and less likely to evaporate as you pump.
- Instead of driving the golf cart, try walking the course during your next game. Not only will you reduce your emissions, but you’ll also get some extra exercise!
- Share a ride with a coworker or friend – you’ll cut your emissions almost in half. Using mass transit to get around is equally beneficial for air quality.
- Make sure your chimney or wood-burning stove is clean and properly vented. Use wood that has been split and dried for at least six months, which will build a cleaner-burning fire. Never burn garbage or treated woods (such as plywood).
- Break out your two-wheeler. Biking to close-by destinations can save you up to 400 gallons of gas in a year, and it’s an emissions-free activity.