Print Version
The Amazon Rainforest and Climate Change
Table of Contents
Earth and Its Climate
Introduction
"Climate change is certainly one of the biggest challenges humanity has ever faced. We�re going to need everyone working worldwide to fix it. There are things every one of us can do in our own personal lives to reduce the amount of greenhouse gas emissions that we cause. But we also need a level of international collaboration that has been rare� It�s clear now that in order to avoid really dangerous climate change, we�re going to have to keep the forests of the world standing. And most of the forests are falling today in the tropics. That�s where international collaboration is particularly important� We invite you to take this course and learn more about one of the most exciting environmental policy opportunities that we've seen in a few decades."

Dr. Daniel Nepstad - Amazon Forest Ecologist Woods Hole Research Center
and Instituto
de Pesquisa Ambiental da Amaz�nia (IPAM)
Our Atmosphere
Voices from Brazil:
"Climate change
is the symptom of a catastrophe that is threatening life on earth. It is a fact that, the use of science and
technology in the service of more production and increased consumption in an indiscriminate way, is making
the planet�s temperature rise, mainly because of the carbon dioxide that comes from cars and forest burning.
this creates the greenhouse effect that provokes subtle, but catastrophic, increases in the temperature of
the planet."
, Professor, University of Brasilia")
Senator Cristovam Buarque (PDF-Federal District, Brasilia) Professor, University of Brasilia
Though Earth’s atmosphere is some 30 kilometers thick, it is actually a very thin coating. If the Earth was the size of a beach ball, the atmosphere would be thinner than a sheet of paper.

Composed of gases like nitrogen, oxygen, and water vapor, the atmosphere sustains life and creates Earth’s climate. We have flourished in this climate, and now we are changing it.

Adapting to these changes will be difficult and expensive. We also may lose forever many species and ecosystems that have helped support human life. That’s why it’s crucial we learn more and act quickly, both personally and as nations.

Climate and Weather

Weather and climate aren�t the same. Weather is the condition of the atmosphere in any particular time and place. It consists of temperature, air pressure, humidity, clouds, precipitation, visibility, and wind.

But measuring those elements at a particular location (Bel�m, for example) over many years and calculating their long-term averages provides a picture of the climate for that location.

So weather information helps you decide if you might need an umbrella this afternoon, while climate data tells you whether you could expect enough rain to grow certain crops.


Climate is more than just averages, though. Hurricanes, heat waves, droughts, floods, and other extreme events are also part of climate—in particular, how often they occur and how intense they are. Even volcanic eruptions can affect climate for a few months or years. All of these aspects of climate can change over time—sometimes slowly, over millennia—and sometimes in months or years.
Scientists have figured out most of what caused major changes in past climates, including drifting continents, changes in Earth�s orbit and tilt, the accumulation of snow and ice, asteroid impacts, and volcanic eruptions. They also know how natural climate variations like El Ni�o and La Ni�a affect climate in the short-term. And they know that the relatively recent changes in climate that we are observing are caused by none of these.

So what is causing them? To understand that, we first need to understand one of the most important aspects of climate—something called the Greenhouse Effect. We�ll discuss that next.
The Greenhouse Effect
The sun emits a form of energy called radiation that travels through empty space and heats our planet and its atmosphere.

Light is the visible evidence of the most abundant form of this radiation, but there are also other types of radiation we cannot see. Much of this radiation strikes the earth, heating the land and ocean.

Some goes back out to space or into the atmosphere where it is absorbed by certain gas molecules. These gases then absorb and re-emit radiation in all directions, warming the planet even more.
Earth�s average surface temperature WITH greenhouse gases: 14�C

�Greenhouse gas� is the term for gases that are particularly good at absorbing this radiation. Such gases are essential for the maintenance of climate and terrestrial ecosystems. Water vapor is a greenhouse gas, but so are many other gases like carbon dioxide (CO2), methane (CH4), nitrous oxide (N2O), and ozone (O3).
The additional warming by greenhouse gases is commonly called �the Greenhouse Effect� but �the blanket effect� may be more appropriate. Though only 1% of atmospheric gases are greenhouse gases, they are extremely powerful heat trappers. The Greenhouse Effect is a natural phenomenon that makes the planet livable. Without it, the planet�s surface would be much colder and would not support most of our current ecosystems.
Earth�s average surface temperature WITHOUT greenhouse gases: -18�C

But by burning fossil fuels and forests faster and faster, humans are effectively piling on more blankets, heating the planet so much and so quickly that it�s hard for nature and human societies to adapt.
Adding greenhouse gases increases Earth�s temperature

Greenhouse Gases
What is most responsible for changing our climate is a substance you can�t normally see, taste, or smell. It�s a gas called carbon dioxide, and we have been putting more and more of it in the air every year.

In pre-industrial times, carbon dioxide made up about 280 parts per million atmospheric molecules. In 2008, its concentration had risen to 385 parts per million—30% more. So what�s so important about a few hundred parts per million?

Not only is the present atmospheric carbon dioxide concentration higher than it has been for at least 2.1 million years, the rate of change is accelerating. Previously it never exceeded 30 parts per million per thousand years, but now, carbon dioxide has risen by 30 parts per million in the last 17 years.

Climate Change 2007: The Physical Science Basis. Working Group I Contribution to the Fourth Assessment Report of the Intergovernmental Panel on Climate Change. Figure 10.8, Cambridge University Press
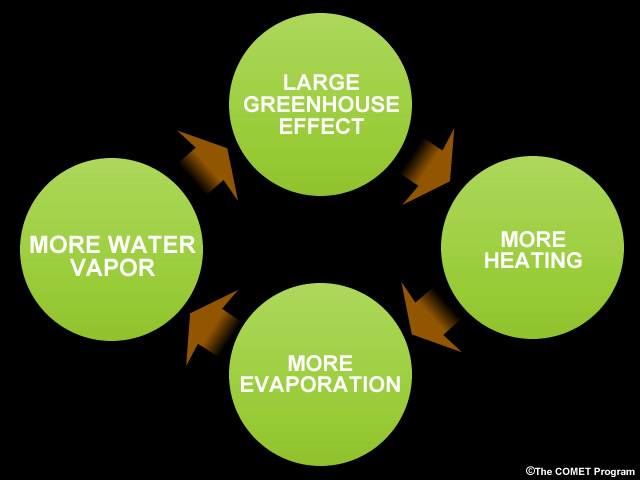
That increasing concentration of carbon dioxide in the atmosphere has a big effect—on our current path, we could see Earth�s temperature rise 4.0�C by the end of the century. Why? Warmer temperatures increase evaporation. And that additional water vapor is also a greenhouse gas. This is called a positive feedback—in this case, one in which increases in temperature cause changes in the climate system that themselves lead to more warming.
Worldwide, burning fossil fuels is the major source of CO2, but CO2 can also come from cutting trees, burning forests or grasslands, agriculture, and making cement.

Climate Change 2007: Mitigation of Climate Change. Working Group III Contribution to the Fourth Assessment Report of the Intergovernmental Panel on Climate Change. Figure 1.2, Cambridge University Press.
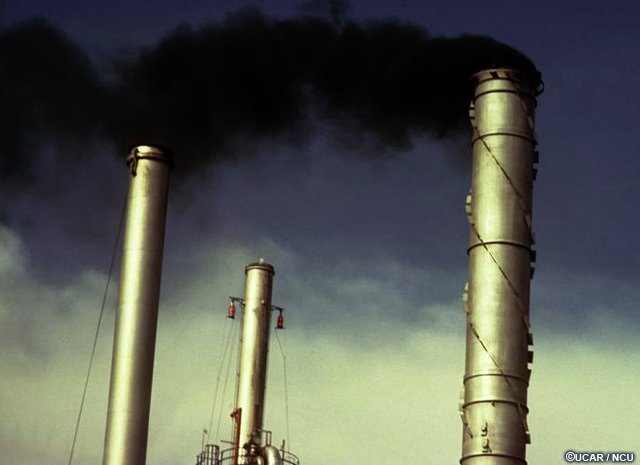
Fossil fuels—like natural gas, coal, and oil—are burned chiefly in power plants; automobiles, airplanes, and other forms of transportation; and by industry. Agriculture produces its own set of emissions, as plowing soil releases carbon stored there and farm animals belch methane. Notice that emissions from deforestation rival those from the residential and service sectors and increased sharply in the mid-1990s.
What do you think?
Which country had the highest total CO2 emissions from fossil fuels and land use changes (including tropical deforestation) in 2000? (Choose the best answer.)
The correct answer is a).
According to data from the World Resources Institute, the U.S. had the highest total CO2 emissions, while Brazil ranked 5th. Brazil ranks high on the list because of land use activities like cutting forest and converting it to crop or pastureland. The other countries of South America don�t rank in the top 20.

Data from the World Resources Institute.
If we only look at CO2 emissions from land-use changes and forestry, in 2000, Brazil ranked second in the world after Indonesia. Peru, Columbia, Mexico, Bolivia, and Ecuador were in the top 20 in this category.
Carbon dioxide isn�t the only greenhouse gas we are releasing to the air. For example, the atmosphere now contains about 1,780 parts per billion of methane (CH4), which is a more powerful greenhouse gas than CO2.

Climate Change 2007: Synthesis Report. Contribution of Working Groups I, II, and III to the Fourth Assessment Report of the Intergovernmental Panel on Climate Change. Figure 2.3, Geneva, Switzerland.
During the last 650,000 years, it never exceeded 790 parts per billion. Methane is produced during oil and gas extraction and transport, rice cultivation, and in the digestive systems of cattle and other farm animals.
And some industrial chemicals called halocarbons—used as cleaners, refrigerants, and in making modern conveniences like computer monitors and flat panel TVs—trap heat extremely well and stay in the atmosphere a long time once released.
The Carbon Cycle
Carbon dioxide (or CO2) doesn�t just stay in the air. It also moves into and out of the atmosphere, living organisms, soil, rock, and water. For example, over very long periods of time, the weathering of rocks, which is a chemical reaction between carbon dioxide in the air and stone, can add carbon to rivers that run into the ocean. Eventually, this carbon settles to the bottom of the ocean and forms limestone. It can later be released back into the atmosphere from volcanoes when the rock is melted.

In ancient times when Earth had a much warmer climate, huge swamps buried plant material faster than it could decay, and when the buried remains were subjected to heat and pressure, they became coal. In similar ways, microorganisms buried on lake and sea bottoms throughout Earth�s history produced oil. These processes locked up lots of carbon as oil, gas, and coal. By burning these fuels in the last 150 years, we have suddenly released into the atmosphere carbon that took hundreds of millions of years to store.
Plants are an important part of the carbon cycle. They absorb carbon dioxide in the air to make wood, stems, and leaves. Animals, including humans, take up carbon when they eat the plants, and then release CO2 back into the atmosphere in breathing. Plants also release CO2 back into the air when the leaves fall or the plants die. Forest fires release large amounts of CO2 as the wood burns.
What do you think?
How much of the world�s carbon dioxide emissions come from cutting or burning tropical forests? (Choose the best answer.)
The correct answer is d) 15-20%.
Tropical forests represent an important carbon reservoir because they store billions of tons of CO2 annually in their wood, leaves, and soil, and deforestation releases that carbon dioxide back to the atmosphere.
Threats to tropical forests, including drought, disease, fires, or logging and clear cutting, release that carbon dioxide to the atmosphere and decrease our planet�s carbon absorption and storage capacity. Tropical deforestation currently accounts for 15-20% of all human-caused CO2 emissions, and with millions of hectares of tropical forest destroyed each year, we are quickly losing this resource for combating climate change.
Evidence of Climate Change
Man-made Change
Voices from Brazil:
"The forest has
to be acknowledged by the politics, because it has an important role in keeping balance. Not only climate
balance, but also to create and support a new management model for the planet."

Almir Surui, Indigenous Leader from the Suru� People
But couldn�t the warming still be a natural variation—perhaps something like a change in the sun�s output?

Scientists have looked for alternative explanations based on the natural causes of climate changes in Earth�s past. None of them explain what we are seeing.
Reconstruction of Northern Hemisphere temperatures.

They�ve also looked at what has been normal temperature variation for the past few thousand years. The temperatures we�re seeing now are outside what�s been �normal� during that time.
CO2 model temperature estimates with (blue) and without (pink) anthropogenic climate influences compared to observations (black line).
")
Climate Change 2007: Synthesis Report. Contribution of Working Groups I, II, and III to the Fourth Assessment Report of the Intergovernmental Panel on Climate Change. Figure 2.5, Geneva, Switzerland.
Computer models help make the case for a human cause. Scientists use the models to simulate climate conditions over the past 100 years. By putting in and leaving out major factors that change climate, they can see how these factors affect global temperature. They can then compare the model estimates to the temperatures actually observed over the years.
When only natural climate factors are put into the models, the results indicate that things like solar and volcanic conditions would likely have produced cooling in the last 50 years.
But when scientists add the greenhouse gases and particles from human activities, the model results correspond very well to the warming that we�ve seen over the past century.
Temperatures
Earth is getting warmer by virtually every measure we know. The temperature has been well above normal for more than 25 years.
 over land and ocean, just ocean, and just land")
Although increases of 0.6-0.9�C over the last century or so may not sound very threatening, remember that�s a global average, so some places warmed more. Think of a time when you had a fever. Even 1�C made a big difference to how well you felt. In the same way, our planet is becoming feverish.
In South and Central America, studies all show patterns of changes in extremes consistent with general warming, especially more warm nights and fewer cold ones. In the past few decades, temperatures rose most in the Northern Latitudes, but they have also risen in the Southern Hemisphere. Average temperatures increased 0.5�C in Brazil and approximately 1�C in Central and South America.
Annual global mean observed temperatures (1979-2005).
All of Brazil has
experienced warming at both the surface and in the upper atmosphere (troposphere).
. All of Brazil has experienced warming at both the surface and in the upper atmosphere (troposphere).")
Climate Change 2007: The Physical Science Basis. Working Group I Contribution to the Fourth Assessment Report of the Intergovernmental Panel on Climate Change. FAQ 3.1, Figure 1, Cambridge University Press
The Amazon itself has warmed about 0.25�C per decade, a relatively fast rate compared to previous climate changes. When the planet came out of its last ice age about 9,700 BC, the Amazon warmed much more slowly—only about 0.1�C per century.

What do you think?
Looking at the graph, what can you conclude about the global temperatures in 1997? (Choose all that apply.)
")
The correct answers are b) and e).
Part of the reason 1997 was such a warm year is that a strong El Ni�o pattern occurred, so the temperatures reflect both natural warming from that phenomenon as well as warming from greenhouse gases. El Ni�os are periodic changes in the winds and ocean currents in the tropical Pacific Ocean that have important consequences for weather around the globe.
Was the devastating Amazonian drought in 2005 also the result of an El Ni�o? Although global temperatures that year were also high, scientists have concluded that the dry pattern in the Amazon was due to unusually warm temperatures in the tropical North Atlantic, rather than an El Ni�o.

Oceans
Ships and buoys that dot the globe tell us the oceans are heating up too. The top 300 meters or so of the ocean have warmed by 0.3�C over the past 50 years. The deep sea, too, has warmed. A U.S. National Oceanic and Atmospheric Administration study that looked at the period from 1948 to 1998 found that every ocean warmed to at least 1,000 m.
And as air and oceans have warmed, the seas have risen. Global average sea level since 1993 has risen about 3.3 millimeters per year. All together, the IPCC estimates the oceans rose 10-25 centimeters in the 20th century as ice and snow melted and warmer water physically expanded.
")
In the last 10-20 years, sea level rise in southeastern South America has increased from 1 mm/yr to 2-3 mm/yr, and several ports in Brazil have recorded rises of 4 mm/yr. This swelling of the seas is expected to continue and will threaten coastal communities.

Sea levels aren�t the only way oceans change. The chemistry of seawater is changing too, as the seas absorb extra CO2 from the air. This impairs the shell-building ability of ocean creatures like coral, plankton, and shellfish. If populations of these organisms plummet, the fish that eat them and the millions of people that eat the fish will suffer as well.

Snow and Ice
Snow and ice reflect the sun�s energy back to space. Without this white cover, more water can evaporate into the atmosphere where it acts as a greenhouse gas, and the ground absorbs more heat. Snow and ice are melting at rates unseen for thousands of years, and this has profound climate consequences. As with air temperature, most of the melting in our 100 years or so of official record keeping occurred after 1980.

In South America, glaciers are melting at an accelerating pace, gravely endangering the water and power supplies of South Americans in Bolivia, Peru, Colombia, Chile and Ecuador. The melt has reached �critical conditions� in these countries, according to the IPCC. Peru has measured a 22% reduction in total glacier area, while Colombia has seen an 82% reduction.
Between 1940 and 2005, the Chacaltaya glacier in Bolivia (below) shrunk from 0.22 square kilometers to less than 0.01 square kilometers, destroying Bolivia�s ski industry. Especially worrying, this glacier provides part of the water for nearby La Paz, particularly during the dry winter season. In these images, the lines indicate the positions of the former ski lift.

Climate Change 2007: Impacts, Adaption, and Vulnerability. Working Group II Contribution to the Fourth Assessment Report of the Intergovernmental. Panel on Climate Change. Figure 1.1, Cambridge University Press.
Sea ice is dwindling too, especially in the Northern Hemisphere. Satellites have seen average Arctic sea ice shrink by 2.7% per decade from 1978 to 2006, with faster melting in summer.
")
In summer 2007, the Northwest Passage north of Canada became navigable for the first time as the polar cap melted to its lowest level on record—30 years faster than IPCC scientists had predicted. 2008�s melt was second only to 2007.

In the Southern Hemisphere, sea ice near the Antarctic Peninsula has also decreased significantly as the area warmed by 3�C in the past 50 years.

However, sea ice in Antarctica as a whole has increased slightly, by 0.97%, or about 100,000 km2 per decade since the late 1970s. Recent studies indicate this increase may be caused by additional snowfall over the Antarctic sea ice. Scientists think this may be related to global warming, which promotes more evaporation, providing more atmospheric moisture for precipitation over the southern oceans. It may also be linked to more wind and storms induced by the Antarctic ozone hole, and scientists project that as the hole shrinks and greenhouse gases increase, Antarctic sea ice will eventually melt faster than it is made.
Rain, Drought, Extreme Weather
A warming atmosphere also shifts storm tracks, altering rainfall, drought, and other weather patterns. For example, a 2004 study by the National Center for Atmospheric Research found that the percentage of Earth�s land experiencing serious drought had more than doubled since the 1970s.

From Climate Change 2007: The Physical Science Basis. Working Group I Contribution to the Fourth Assessment Report of the Intergovernmental Panel on Climate Change. FAQ 3.2, Figure 1, Cambridge University Press.
While observations are limited over much of Central and South America, the data indicate precipitation has increased in the southern part of the continent (with the exception of the west coast).

Climate Change 2007: The Physical Science Basis. Working Group I Contribution to the Fourth Assessment Report of the Intergovernmental. Panel on Climate Change. Figure 3.13, Cambridge University Press.
However, drier conditions have occurred in eastern Brazil and parts of Colombia, Ecuador, and Venezuela. During the past century the Amazon experienced slightly less rain, particularly in the north. This may be bad news for the health of the forests.
What do you think?
Did global warming contribute to the Amazonian drought of 2005? (Choose the best answer.)
The best answer is �Maybe.�
It generally isn�t possible to attribute any single weather event to one cause. Climate change is more easily detected over long periods using lots of data. However, we can say that all weather today is happening in the background of a warming world and increasing droughts are consistent with what might be expected.
Researchers found that the 2005 drought stressed the Amazon forests, killed trees and released a lot of carbon into the atmosphere as a result. In normal times, the Amazon absorbs about 2 billion tons of carbon dioxide, but in 2005, the forests lost more than 3 billion tons, leaving a net of 5 billion extra tons of CO2 in the atmosphere—more than the European Union emits from all sources.

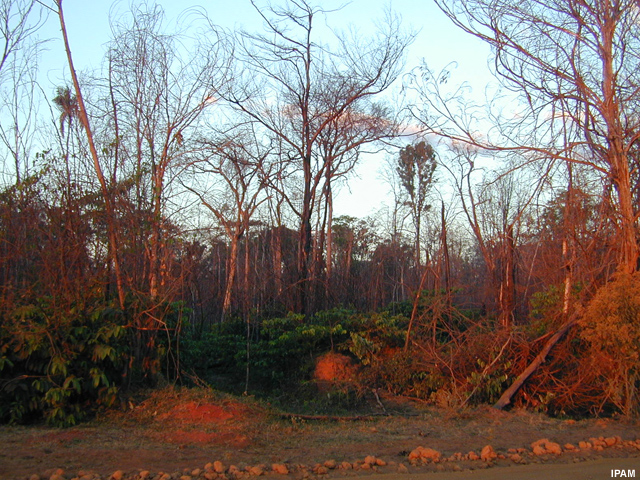
An experiment in Tapaj� National Forest, in Par� State, Brazil, confirmed these results. Scientists there covered a section of the forest with plastic panels for three years and found the soil dried down to 11 meters. It also killed many big trees, exposing the center of the forest to further heat and drying, and reduced wood production by one ton per hectare per year. Holes in the forest encourage the growth of plants that prefer more light.
Together with drought, this increases the risk of fires, which releases carbon to the atmosphere, opens the forest canopy even more, and can reduce rainfall nearby.

In some places, the forest becomes savannah with plants that are not as good at absorbing carbon dioxide. If such conditions become more frequent due to climate change throughout the Amazon basin, rainforest trees will make much less wood from atmospheric carbon dioxide, seriously worsening global warming.
Paradoxically, more water vapor held by a warmer atmosphere also leads to heavier rains and more snowfall. In particular, heavy rains are increasing in temperate zones.

Heavier rains increased significantly in eastern South America between 1900 and 2005, particularly in southern Brazil, Paraguay, Uruguay, the Argentine Pampas, and some parts of Bolivia. These increases have reduced crop yields and promoted floods. For example, there has been a 10% increase in flood frequency in the Amazon River at Obidos and increases of up to 50% in stream flow in the rivers Uruguay, Paran�, and Paraguay. Scientists have also measured more deaths and illness due to flooding, landslides, and storms in Bolivia.

From Climate Change 2007: The Physical Science Basis. Working Group I Contribution to the Fourth Assessment Report of the Intergovernmental Panel on Climate Change. Figure 3.39, Cambridge University Press.
In addition, South America has seen highly unusual extreme weather in recent years—droughts in the Amazon, hail storms in Bolivia and Argentina, and the unprecedented Hurricane Catarina in the South Atlantic in 2004. There were also more forest fires and more and longer-lasting El Niños. Scientists have calculated that climate-related disasters have doubled in the last several decades.

Ecology
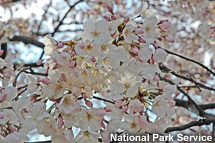
Increased warmth has also affected living things. The geographic range and timing of reproduction, migration, flowering, and fruiting are changing in many animals and plants around the globe. In the Northern Hemisphere, plants and animals are experiencing longer growing seasons. For example, the Japanese keep very detailed records on the blossoming of their Tokyo cherry trees, so they know they are blooming 5 days earlier on average than they were 50 years ago.
In areas in South America where more rain is falling, soybean yields have increased 38%, with smaller increases of 18% for maize, 13% for wheat, and 12% for sunflowers.

Pasture productivity increased 7% in Argentina. On the other hand, plant diseases also increased and cattle production declined.

For example, researchers have found that a fungus that affects wheat grown in Brazil increases during El Ni�os when more rain falls and the air is steamier.
 next to one showing severe symptoms of Fusarium head blight disease (right)")
Although El Nin�s cause rain in the south of Brazil, they cause extreme drought in the Amazon.
Future Projections
A Quick Look
Voices from Brazil:
"Without the
forest peoples, the traditional populations, without the Quilombolas, without the river dwellers, the
fishermen, without the women coconut breakers, without the indigenous people, there won�t be forest. Forests
only exist because these populations have protected them. Where there was no population, forests are gone;
wherever these groups remain, forests will too. Our people need the forest for transportation, housing,
health, and even for music. Forest is very important for us. We could not live without the forest."

Rubens Gomes, Amazon Working Group (Grupo de Trabalho Amaz�nico, GTA)
So what do scientists believe the future holds? Global average temperatures are expected to increase by about 1-7�C by the end of the century. In South America, Amazonia is likely to see the greatest warming.
Climate Change 2007: The Physical Science Basis. Working Group I Contribution to the Fourth Assessment Report of the Intergovernmental Panel on Climate Change. Figure 10.8, Cambridge University Press
As a result of this warming and lower humidity, inter-tropical glaciers are very likely to disappear in the next 15 years. This will seriously affect water supplies for the region.
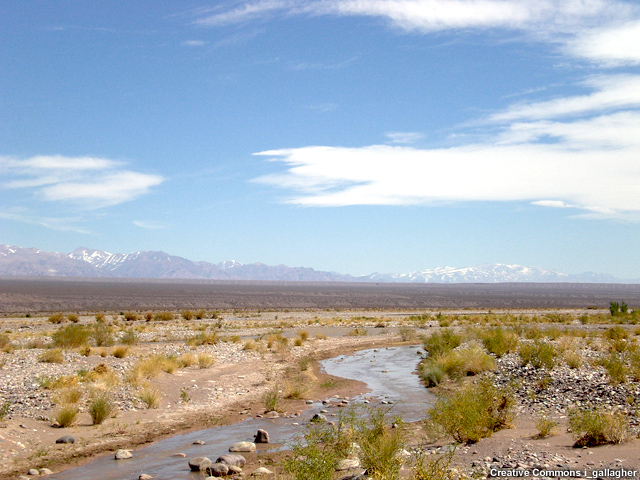
Because a warmer planet will boost evaporation and change atmospheric moisture circulation, many dry areas will become drier and wet areas wetter. Northeast Brazil, for example, will likely dry and see a shift from semi-arid to arid or desert-like vegetation. As a result, groundwater recharge there is projected to decrease by more than 70%.
Projections of relative changes in runoff by end of 21st century.

Climate Change 2007: Synthesis Report. Contribution of Working Groups I, II, and III to the Fourth Assessment Report of the Intergovernmental Panel on Climate Change. Figure 3.5, Geneva, Switzerland.
Warming of 2�C and decreases in soil water would lead to replacement of tropical forest by savannas in eastern Amazonia and central and southern Mexico, according to the IPCC, a scientific, intergovernmental body established by the United Nations to study climate change.

The oceans will continue rising in the coming century. The IPCC�s best estimates range from a few centimeters to about half a meter by 2100. In low-lying areas, this could inundate land relatively far from current shores.

The IPCC�s projections of sea level rise are at best a rough estimate, however. The complete loss of either the West Antarctic Ice Sheet or the Greenland Ice Sheet could eventually raise sea levels on the order of 6 meters.
To see what scientists project is in store as a result of climate change for some specific parts of South America, examine this map. We will explore many of these topics in detail in the next section.

Climate Change 2007: Impacts, Adaption, and Vulnerability. Working Group II Contribution to the Fourth Assessment Report of the Intergovernmental. Panel on Climate Change. Figure 13.5, Cambridge University Press.
Warming
So how will life in South America likely change if these predictions are accurate? There has always been natural variability, with some places and some years warmer or cooler than average. In general, however, summers will get hotter, not only because of higher temperatures, but also because humidities will increase. A warming trend on top of natural variability means that temperatures will cross today�s heat danger thresholds more often.

Climate Change 2007: The Physical Science Basis. Working Group I Contribution to the Fourth Assessment Report of the Intergovernmental Panel on Climate Change. Figure 10.19 (b), Cambridge University Press.
For example, the 2003 European heat wave that killed 35,000 people was a combination of global warming and extreme natural variability and could not have happened without both. Models predict that in many places, an extreme heat event that we only see once every 20 years today will happen once every 3 years by the middle of this century, and even more frequently by century�s end.
Temperature anomalies during the 2003 European heat wave

Oceans
As the oceans rise, sandy shoreline erosion happens at about 100 times the rate of sea level rise, so a few inches� increase in the ocean level can greatly affect coasts.

And since nearly half of the world�s population lives in low-lying coastal areas, continued population growth along coasts increases vulnerability from sea-level rise, storm surge, and flooding. People who live on small islands close to sea level will be particularly vulnerable as their water supplies, homes, coral reefs, fisheries, and crops are threatened.
If both the Antarctic and Greenland ice sheets melt completely, sea levels could rise 80 meters, which would flood the area of South America seen here.
South America�s coastline if seas rise 80 meters.

If, on the other hand, sea levels rise only 6 meters, this is the inundation that would eventually result.

As sea levels rise, nearly everywhere coastlines seem likely to flood more often, particularly in cities not rich enough to build sea walls or adapt in other ways. Saltwater intrusion may spoil many freshwater aquifers that provide drinking water. In Latin America, El Salvador, Guyana, and the province of Buenos Aires would be particularly at risk from flooding and its accompanying erosion, while the drinking water of Ecuador, Costa Rica, and the Rio de la Plata estuary would be in danger of becoming contaminated by saltwater. Coastal changes could also disrupt access to fishing grounds and endanger mangroves—the nurseries of many fish—and many other coastal species.
Because of a combination of increasing population, decreasing glacial runoff, precipitation, and saltwater intrusion, the IPCC projects that 7 to 77 million people in Latin America will likely suffer from inadequate water supplies by the 2020s, increasing to 60 to 150 million by the second half of the century.
Ocean Ecosystems
As the oceans absorb more carbon dioxide, the chemistry of seawater changes. This means that many of those at the bottom of the ocean�s food chain will struggle to make their shells. Nearly every sea creature from plankton to whales would be directly or indirectly affected. If the ocean food chains collapse, many people in the world who depend on fish for food will go hungry, and seafood may become a delicacy that only the wealthy can afford.

Warmer ocean waters could also cause coral reef �bleaching�, in which corals lose the algae that nourish them and die. According to the IPCC�s Fourth Assessment Report, this is very likely if sea surface temperatures increase 1 to 3 C in the next century as expected. Corals will also have a harder time making their skeletons in the carbon-dioxide enriched ocean chemistry and will suffer more physical breakage if tropical storms intensify as scientists project.
Terrestrial Ecosystems
Plants and animals are also in danger. According to IPCC�s Fourth Assessment Report in 2007, many terrestrial ecosystems around the globe will likely shrink and be pushed beyond their ability to adapt naturally to climate change. This will likely put 20-30% of plant and animal species at increasingly high risk of extinction in this century. The IPCC was also highly confident significant species extinctions could happen in Latin America.

For example, many tree species in the central Brazilian savannas (cerrados) could go extinct by 2050 if 2�C warming takes place. A 2004 study by scientists at the University of Leeds concluded that, by the end of the century, 43% of 69 tree species they studied could go extinct in Amazonia.
Tropical cloud forests in the mountains would be threatened by a 1-2�C rise in the next 50 years because the cloud-base would rise about 2 m/year. Some plants would become extinct locally because their mountains are not high enough anymore to support the habitat they need.
In the cloud forest of Monteverde in Costa Rica, plants and animals are already suffering. Fewer misty days have resulted in decreasing populations of amphibians and probably also birds and reptiles.

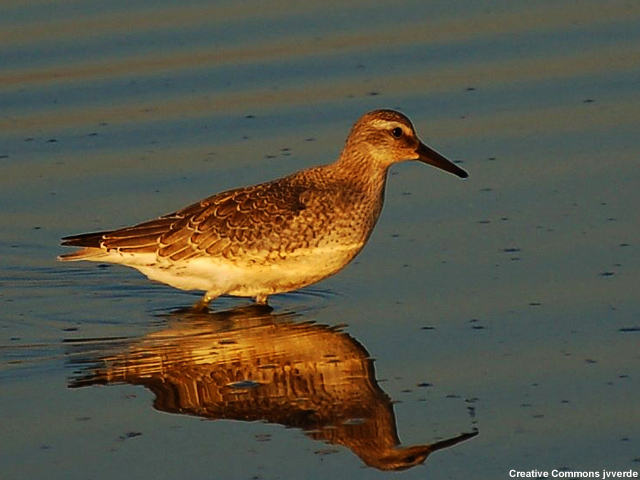
Migratory birds will also experience loss of habitat and shrinking populations. A 2005 review of 300 migrant bird species found that 84% face some threat from climate change, almost half because of lower water tables or drought, which can shrink breeding grounds or rest stops along migratory paths.
More frequent wildfires are also likely in much of South America; models project a 60% increase as temperatures warm as much as 3�C. This, too, will endanger living organisms.

Health
Here, too, the news is not good: people are already suffering from climate-related causes and more will be killed or sickened as the planet warms.
Death rates spike an average of 6% during heat waves, so heat-induced deaths will probably rise sharply as temperatures increase and heat waves become more prolonged and intense. This is especially true for the most vulnerable—the elderly, children, and those who are already sick.
As temperatures get milder, mosquitoes, rodents, and other carriers of disease will expand their range and sicken more people, particularly in developing countries. In South America, malaria, dengue, and water-related diseases are particularly worrisome. Changing climate and destroyed forests could result in new diseases escaping into human populations.

In Bolivia, one study projected malaria and leishmaniasis would spread more easily, and that native peoples may be most at risk. Computer models also predict substantial increases in dengue fever in Brazil, Mexico, Peru, and Ecuador. On the other hand, some areas in Central America and around the Amazon are projected to experience fewer cases of malaria thanks to less rain.

Air pollution will likely worsen too, since higher temperatures and humidity will allow more ozone and particle pollution to form and linger longer. This will produce more asthma and deaths from heart and lung disease.
In addition, since climate change is likely to increase forest fire risk, the smoke from resulting fires could send more people to the doctor for respiratory problems.
Economics
Most people will see climate change delivered to them in the form of higher water, energy, and insurance bills. Why?

More droughts, higher temperatures, and more extreme weather will require lifestyle alterations ranging from what crops we grow to how we relax. Climate change expands the range of conditions we need to prepare for, and that preparation costs.

For example, 50% of Latin American agricultural lands are likely to be affected by desertification or salinization by the 2050s. Livestock and dairy productivity are likely to decline in response to increasing temperatures as well. With increased drought, flood, shrinking water supplies, and heat, farmers will have their hands full, and production in some regions could falter or fail.

Because climate change will affect all aspects of life, it is estimated that doing nothing will cost the equivalent of between 5% and 20% of global gross domestic product (GDP) every year for all of the forseeable future. In contrast, the costs for reducing greenhouse gas emissions are expected to be about 1% of global GDP per year. But those investments in making a more sustainable future need to occur in the next 10-20 years to avoid major economic, social, and ecological disruptions.
Brazil, the Amazon, and Climate Change
Brazil�s CO2 Emissions
Voices from Brazil:
"REDD cannot be
a mechanism for saving forest carbon stocks forever. Like a key that starts a car, it needs to be starting
mechanism that creates incentives, showing society the possibility for generating income, at the same time
that it changes the current thinking about development and economic growth. Therefore, we need more
investment in agriculture and cattle production, as well as in the sustainable use of forest resources.
That�s the payoff for deciding not to cut the forest."
")
Paulo Moutinho, Instituto de Pesquisa Ambiental da Amaz�nia
(Amazon Environmental
Research Institute)
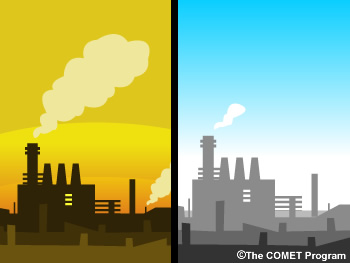
There�s something very unusual about Brazil�s carbon dioxide emissions. They look much different from those of the United States, Europe, China, India or most of the rest of the world. On the one hand, this is because Brazil is years ahead of these countries. And on the other, it is because Brazil has more work to do.

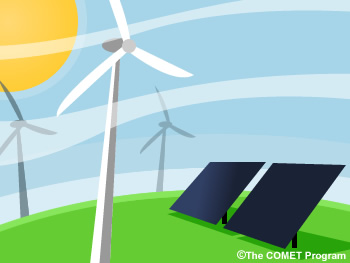
Brazil is ahead thanks to foresight. Falling sugar prices in 1975 combined with an international oil crisis prompted the government to create the largest program in the world for making fuel—ethanol—out of sugar. But Brazil did much more. It also started programs to reduce electrical waste and encourage power made from plants, water, and wind.

All together, renewable energy generates well over 45% of Brazil�s power—an amazingly large figure by world standards.
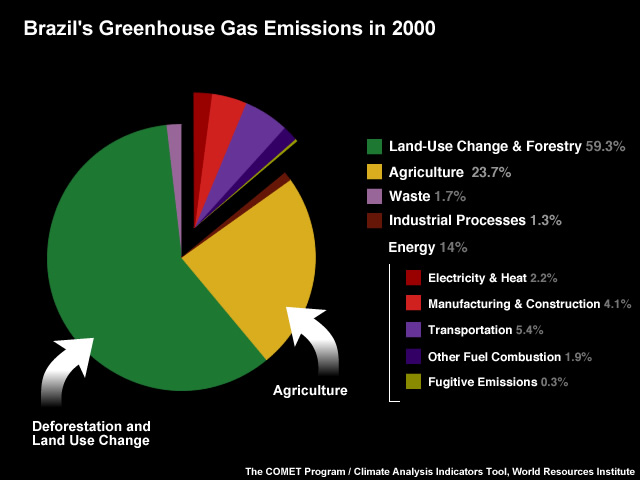
In the U.S. 93% of greenhouse gas emissions in 2000 came from energy, while in the European Union, it was 82%. In Brazil only 14% of greenhouse gas emissions came from energy. Only 5.4% came from cars, trucks, buses and planes, compared to 26% in the United States. That is the power of Brazil�s renewable energy programs.
But take a look at another sector—land use change and deforestation. Canada, which provides wood and paper to much of North America, was responsible for less than 1% of the world total of emissions from deforestation and land use change in 2000. The U.S., the world�s second largest greenhouse gas emitter, actually stored more carbon in forests, urban trees, and other land use practices than any other country, erasing 6.3 % of the emissions from the rest of the world. Brazil, on the other hand, lags far behind other countries in controlling emissions from deforestation.

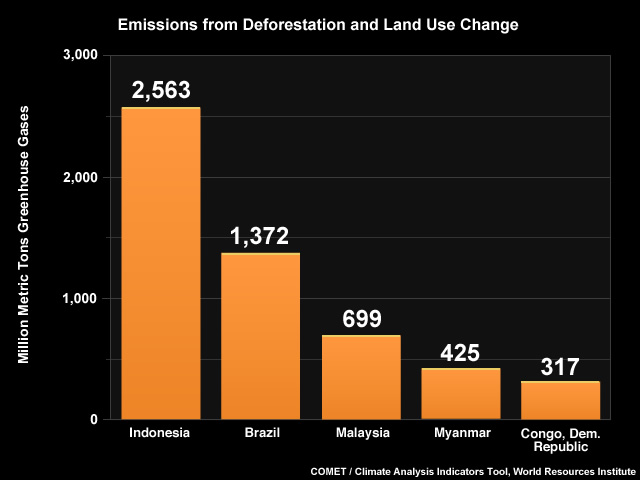
When one looks at the countries that produce the most greenhouse gas emissions from cutting, burning, and converting forest to pasture or field, only Indonesia exceeds Brazil.
All together, deforestation and land use change and agriculture contribute more than three-quarters of Brazil�s greenhouse gas emissions.
What do you think?
Agriculture is another large source of greenhouse gas emissions, particularly in countries like Brazil. Worldwide, which agricultural activity do you think produces the most greenhouse gases? (Choose the best answer.)
The correct answer is d).
Livestock like cattle, sheep, and goats produce a lot of methane, which is a more powerful greenhouse gas than carbon dioxide. It's warming potential is 21 times greater than that of carbon dioxide. Annually, livestock produce about a third of all of the emissions from agricultural activities.
Tropical Forests and CO2
Together, the world�s tropical rainforests absorb about 1.8 billion metric tons of carbon annually, storing about one-quarter of the world�s greenhouse gas emissions in their wood and soil.
Map of the world�s tropical forests
")
Scientists estimate Amazonian trees contain the equivalent of 9-14 years of current global, annual human-induced carbon emissions. Trees absorb carbon from the air as carbon dioxide and use the sun's energy to make leaves, branches, trunks and roots through the process of photosynthesis. Part of this carbon also ends up in the soil. When a tree dies and decomposes naturally, fungi and bacteria slowly break down the rotten wood, releasing carbon dioxide. Most of the wood, twigs, and leaves in a deforested area will decompose in 10 years. If the area is reforested, these trees will take more than 100 years to absorb a similar amount of carbon.

The amount of carbon stored in the Amazon is enormous. Per unit area, forests hold 20 to 50 times more carbon in their wood, leaves, and soil than cleared land. And trees in the tropics store about 50% more carbon per hectare compared to northern forests. This means cutting tropical trees releases much more carbon than cutting trees in forests elsewhere.

But under some natural conditions—especially drought or high temperatures, tropical forests can become net emitters of carbon. A study of trees in over a hundred different plots across the Amazon during the 2005 drought found that many trees grew much more slowly or died. As a result, the Amazon then became a source of CO2, rather than a sink that takes up excess CO2.

Climate models hint that weather conditions (El Ni�o, for example) that promote drought in the Amazon may occur more frequently in the future. This makes preserving the forest now even more critical to the planet�s health since it is going to take years for humans to significantly reduce their dependence on fossil fuels.

Climate Change 2007: The Physical Science Basis. Working Group I Contribution to the Fourth Assessment Report of the Intergovernmental. Panel on Climate Change. Figure 10.18 (d), Cambridge University Press.
Wildfires also emit lots of greenhouse gases, especially in drought-prone El Ni�o years. In the El Ni�o of 1997-1998, fires released 2.1 billion tons of carbon—about one-quarter of a year�s worth of human-induced global emissions. When climate change combines with El Niño events, there is less rain and consequently, higher probability of forest fires. Once the forest catches on fire, its vulnerability to new fires increases. Fires can also get out of control and burn fences, pastures, or crops. One study has conservatively estimated that fires in the Amazon cost an average of about 0.2% of the region�s GDP annually, but the true number could be as high as 10%.

Deforestation
What do you think?
What country lost forest at the fastest rate between 2000 and 2005? (Choose the best answer.)
The correct answer is d) Brazil.

Data from Food and Agriculture Organization of the United Nations,
State of the
World�s Forests 2009 (Annex 4)
Between 2000 and 2005 Brazil led the world in the rate of forest loss. Interestingly, Spain (and several other countries not shown) actually increased the size of its forests. Globally, an area equal to more than twice the size of Venezuela is cleared of tropical forests every year. Cutting in the Amazon basin is responsible for over half of that. By 2001, a total of 837,000 square kilometers of forest had been lost.
In Brazil, almost 20% of tropical forest —an area equivalent to the size of France— has been cleared and converted to other uses in the last 30 years. The southern and eastern margins of the forest suffered the most, as cattle pasture and soybean fields expanded there.

Some forest is not cleared outright but instead degraded by poor timber-cutting practices. About one-third of the Amazon has been degraded in this way, and it accounts for about 25% of emissions from deforestation in the Brazilian Amazon. The combined effect of deforestation, degradation, and slash-and-burn agriculture increases the fire risk greatly for millions of hectares of still-untouched forest.

Degraded forests release their carbon slowly as the forest materials decay, while fires vaporize it at once. In either case, the surrounding forest can be weakened by the extra light, heat, and dryness.
Many other things happen after forest is cleared that put carbon in the atmosphere. About 25-30% of the carbon in newly-deforested, ploughed soil returns to the air when dead plant material and some soil microbes are exposed to air. Air exposure allows them to decay more quickly. And grazing and cultivation of newly cleared land lead to other greenhouse gas emissions. Nitrogen-rich fertilizers sprayed on crops cause soil to release nitrous oxide, another greenhouse gas. Livestock, manure, and rice paddies release methane.

Fires and Weather
Cutting forests can affect climate in ways that have nothing to do with greenhouse gases. Because forests draw water from the soil and emit it from their leaves by evaporation, a forest acts like a giant humidifier. This exhalation of water vapor also moves heat from the surface to high in the atmosphere where the water condenses. The net effect decreases surface temperatures. Cutting forest pulls the plug on this air conditioner and decreases the water vapor that might otherwise become raindrops.
Satellite view of the Amazon River in Brazil.
Clouds form over the thick tree
canopy, but are sparse over the dryer marshland along the river.

As a result, clearing more than 30% of the rainforest could trigger a permanently drier Amazon with a self-reinforcing—or positive—feedback loop that converts more and more tropical rainforest to savanna. As more trees die, the faster everything else dries out, which kills more trees, and so on.

A recent study by the Federal University in Vi�osa, Brazil suggests that if just another 3% of the forest in the Mato Grosso region is cleared, the forest may become a dry savannah permanently.

These changes can also affect weather patterns far downwind. Some studies have indicated that large-scale deforestation in the Amazon may increase global temperatures and significantly reduce rainfall in faraway places like Mexico and Texas.
What do you think?
The two images below are satellite views of smoke activity for 2005 (left) and 2006 (right). What do you think is the reason for the higher smoke activity in 2005 compared to 2006? (Choose all that apply.)

The best answers are probably a) and d).
It�s difficult to say for sure what affects the number of fires in a particular year. We do know that 2005 was a very strong drought, which was probably a big factor in the fires that year. The drop in 2006 was probably due to stronger laws enacted as a result of the fires in 2005.
A similar pattern also occurred between 2007 (left) and 2008 (right), but scientists aren�t sure what caused the drop in these years since weather doesn�t appear to have been a factor. Perhaps crop and timber market conditions or regulatory actions played a part.

Other Consequences
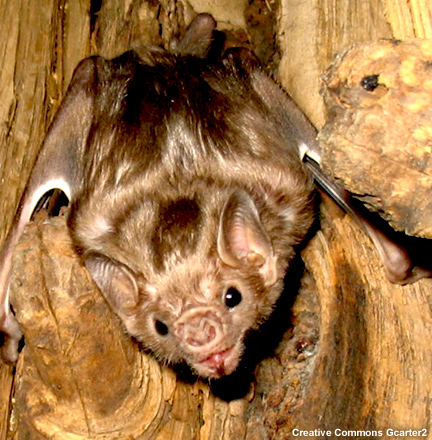
In 2004, at least 13 people in the state of Par� died from rabid vampire bat bites inflicted as they slept. In 2005, another 23 died and over 1,300 were bitten in Maranh�o. Though these deaths may seem unconnected to climate change, they may be. Deforestation was one possible cause.
At the time, some scientists attributed their deaths to bats displaced from their homes by cutting forest and to colonies of bats swollen by feasting on the cattle kept by people.
Another study in the Peruvian Amazon found the mosquitoes that cause malaria bite hundreds of times more often in deforested areas than in intact forest. But rabies and malaria aren�t the only possible health effects of deforestation.

Smoke from burning forests causes respiratory illnesses among people nearby. In 1997, visits to doctors for respiratory ailments increased 20 times during the Alta Floresta fires. Some of the respiratory irritants are also greenhouse gases. These illnesses cost money, too. In 1998, the Brazilian government spent US$11 million for the treatment of respiratory problems in the Amazon.

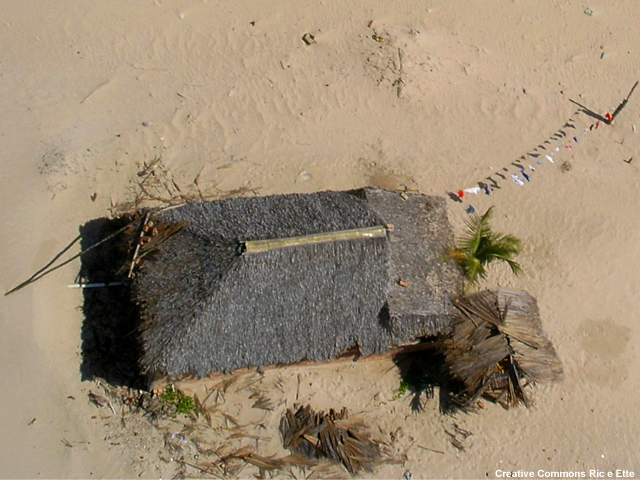
If, as current computer models suggest, drought becomes more common in the Amazon, traditional communities of rural and indigenous peoples may have to deal with scarce and unsafe water, food shortages, and other difficulties.
Carbon Sequestration and REDD
It must be apparent by now that preserving forest is a quick way to fight climate change and protect human health. Using trees to store carbon is a form of �carbon sequestration,� any process that takes excess carbon dioxide out of the air and locks it in long-term storage.
Ultimately, saving forest is not a permanent solution because even protected forest will eventually reach a saturation point beyond which it can absorb no more carbon.

But keeping the carbon already in tropical forests from being dumped into the air and preserving trees� carbon absorption ability would be a fast first step to reducing carbon emissions while the world tries to get longer-term policies in place and decrease its reliance on fossil fuels.
If nothing is done, the forest will continue falling at a brisk pace. Scientists estimate that by 2030, 55% of the Brazilian Amazon will be cleared, logged, or damaged by drought or fire. That would not only put 15-25 billion tons of carbon into the air, but it would also remove the forest�s cooling, moistening, and carbon-absorbing services.
Here you see two possible futures for the Amazon, one optimistic, and one pessimistic.

Under the pessimistic scenario, which assumes we change nothing and business continues as usual, 40% of the forest would be cut by 2050, releasing 32 billion tons of carbon. Under the optimistic scenario, which assumes we create more protected areas, maintain indigenous lands, strengthen governance, and create policies that help preserve forest, 25% of the forest would be cut, which would release 17 billion tons of CO2. This is still not great, but the more we can do to avoid deforestation, the better.
Deforestation in Mato Grosso, Brazil, as seen by a satellite

In the past few years, Brazil has taken strong steps to curb deforestation. For example, the government has been trying to monitor and control illegal deforestation.

The Brazilian National Institute for Space Research (INPE) has developed a system called DETER (Detection of Deforestation in Real Time) that uses satellite images to let the government see exactly where and when forests are burned or cut, greatly aiding enforcement.
 in Mato Grosso between 2002 and 2006")
Between 2005 and 2006, the government arrested more than 500 people who were illegally cutting forest, and as a result of this and other actions, they managed to cut deforestation rates in half in three years.
And the government established 24 million hectares of new protected land on the frontier of agricultural expansion, about 10% of the forest�s total area. According to a 2008 paper by the Brazilian Forest Service, these actions and others have helped Brazil avoid the emission of 200 million tons of carbon since 2004.

This success has not gone unnoticed, which is why the United Nations Framework Convention on Climate Change has targeted Brazil, as well as other countries in Africa, Asia, and Latin America, for its proposed Reduction in Emissions from Deforestation and Forest Degradation program, known as REDD.
In this mechanism, developed countries that are signatories of the Climate Convention (known as the Annex I countries) would help compensate those with rainforests, such as Brazil and Indonesia, to reduce deforestation and promote sustainable forest management practices. Though not cheap to start, officials estimate costs would decrease over time.

The REDD mechanism in Brazil should include compensation or positive incentives for agricultural small landholders, rural producers, indigenous peoples, traditional communities, and all spheres of government for the service they provide to humanity by keeping the forest standing and not destroying it further. This mechanism includes not only the reduction of emissions from deforestation and degradation, but also the role of conservation, sustainable management of forests, and increasing carbon stocks of forests in tropical countries.

Beyond simply cutting carbon emissions, studies show that the mechanism would also help alleviate poverty, protect citizens, and conserve biodiversity. In Brazil, the generated resources could double the income of 200,000 agricultural producers that live in forest areas; reduce respiratory illness, deaths, and damage to farms and forest from fire; and protect the rainfall that is important to farms and hydropower systems. Finally, REDD can help prevent the loss of services as well as many remarkable and irreplaceable species that make the Amazon such a unique treasure.
International Agreements
UNFCCC: Convention on Climate Change
Voices from Brazil:
"I don�t know
what climate change is, but I can say that we already suffer from the changes in the ways of nature. I
understand that the REDD mechanism proposal is very interesting for us. The big issue is how we can adjust
it and adapt it in a way that is good for the forest�s traditional people and does not harm them in any way,
as other programs have in the past�not climate change programs, but other funding programs that were
supposed to be a solution but didn�t even get to the communities.
The
REDD proposal is interesting for us because it is a concrete policy for deforestation reduction."
")
Manoel Silva da Cunha, President of the National Council of Rubber Tappers
(Conselho Nacional dos Seringueiros, CNS)
Today scientists agree that only drastic global changes will slow climate change. This isn�t a new conclusion. At the United Nations Conference on Environment and Development 1992 in Rio de Janeiro, over 192 countries ratified a treaty called the United Nations Framework Convention on Climate Change, also known as UNFCCC. This convention had been recommended by the IPCC (Intergovernmental Panel on Climate Change), the global authority on climate issues, established in 1988 by the World Meteorological Organization (WMO) and the United Nations Environmental Program (UNEP).

The goal of the UNFCCC is to bring countries together to devise political and technical strategies to fight global warming. In this treaty, the international community:
- Recognizes climate change as an important global environmental issue
- Acknowledges the role of human activities in climate change and the necessity of international cooperation
- Establishes that stabilizing greenhouse gas concentrations is a critical goal
Under the Convention treaty, which took effect on 21 March 1994, governments agreed to:
- Gather and share information on greenhouse gas emissions, national policies, and best practices
- Launch national strategies for reducing greenhouse gas emissions
- Provide financial and technological support to developing countries
- Cooperate in preparing to adapt to the impacts from climate change
The ultimate objective of the Convention is to stabilize greenhouse gases in the atmosphere at levels that would prevent dangerous climate change, allow plants and animals to adapt naturally to higher CO2 levels, ensure adequate food production, and preserve sustainable economic development.
The UNFCCC accomplishes its goals by holding annual meetings called Conferences of the Parties (COP) at which participating nations discuss global climate change issues. The first COP took place in 1995 in Berlin, Germany, where member nations began negotiating targets and deadlines for developed countries to reduce greenhouse gas emissions.

COP3, the third meeting, took place in 1997 in Kyoto, Japan where the well-known Kyoto Protocol was adopted. In 2004, the rules for implementing the Kyoto Protocol were approved during COP10. During COP 13 in 2007, forests were mentioned as part of the climate change solution for the first time.
Kyoto Protocol
The UNFCCC treaty imposed no mandatory limits on greenhouse gases. Instead, it called for updates (termed �protocols�) to set the restrictions. The first update was the Kyoto Protocol.

Recognizing that developed countries are principally responsible for the current high levels of greenhouse gas emissions in the atmosphere, the Kyoto protocol imposed targets for 37 industrialized countries and the European Union, called �Annex I� countries.
Under the Kyoto Protocol, Annex I countries commit to reducing their national emissions by an average of 5% of 1990 levels between 2008-2012 (called the �first commitment period�). Developing countries are not expected to reduce their emissions unless developed countries provide funding and technology. Brazil is in this group, as well as China, India, and Indonesia.
What do you think?
The Kyoto protocol became effective on 16 February 2005 and by 2009 had been ratified by 184 countries. Which major country or countries had NOT ratified the Protocol as of 2009? (Choose all that apply.)
The correct answer is c).
In 2009, the United States was the only industrialized country that had not ratified the Kyoto Protocol. The U.S. Senate refused to sign because the Protocol did not include binding emission reductions for developing countries such as China, which now emits more greenhouse gases than any other country.

Emission Reductions
With commitments under the Kyoto Protocol to limit or reduce greenhouse gas emissions, countries must reach their targets primarily through policies and regulations that either directly limit emissions or that create incentives for renewable energy or more energy efficiency in power generation, industry, and transportation.
The Kyoto Protocol also introduced three market-based mechanisms to help countries reduce their emissions:
- Emissions trading
- Joint implementation
- Clean development
Carbon is now tracked and traded like any other commodity. This is known as the "carbon market." Since carbon dioxide is the principal greenhouse gas, people speak simply of trading in carbon, and other greenhouse gases (methane, for example) are expressed in carbon equivalent (CO2eq).
Emissions trading allows developed countries that have lowered their emissions below their assigned limit to sell their unused credits to other Annex 1 countries. In other words, they can sell their excess reduced emissions to other countries that have not met their emission reduction targets.
The Joint implementation mechanism allows an Annex I country to invest in a project that would reduce emissions in a different country. For example, if the cost is too high to reduce emissions in Japan, Japan could invest in a project in France. In this example, France would benefit from the foreign investment and technology, and Japan would be better able to meet its greenhouse gas target.
The Clean Development Mechanism (also known as CDM) is the only one that allows developing countries to participate. Under this mechanism developed countries with emission-reduction commitments may invest in projects in developing countries—those without commitments—to generate carbon credits inexpensively. These projects can earn saleable, certified emission reduction credits that can be counted towards meeting Kyoto targets.
Examples of CDM projects might include:
- Bringing electricity to rural areas using solar panels or wind-powered generators
- Switching from fossil fuels to biofuels
- Managing urban and rural waste to avoiding methane emissions
- Sequestering carbon by planting trees where forests have been cleared (reforestation) or on land where forests didn�t previously exist (afforestation). The CDM mechanism has already registered more than 1,838 projects and the number is ever-growing.
The CDM mechanism has already registered more than 1,838 projects and the number is ever-growing.
For developing countries, CDM projects provide sustainable development and emission reductions, while giving industrialized countries some flexibility in how they meet their emissions reduction targets.
How have countries participated in the CDM?
As of September 2009, 5,340 projects were in some stage of the CDM project cycle. China had the most with 1,987 projects (37% of the total), India was next with 1422 (27%), followed by Brazil with 405 projects, 8% of the total. Together, they represent 72% of existing projects.

In terms of emissions reduced by these projects, Brazil contributed 6% of the global total.

Although CDM projects can involve afforestation and reforestation, projects that try to avoid emissions by preventing forests from being cut or burned in the first place are excluded from this mechanism. Because Brazil is one of the top five greenhouse gas emitters and more than half of its carbon emission comes from deforestation, there has been a lot of talk about creating a program to reduce emissions from deforestation using a mechanism like CDM in developing countries.
This idea has a history that stretches back to 2003 when a group of researchers led by the Amazon Environmental Research Institute (IPAM) introduced a proposal called �Compensated Deforestation Reduction� at the COP 9 meeting in Milan. The proposal suggested that developing countries that voluntarily reduced emissions from deforestation would receive international financial compensation equivalent to the avoided emissions based on carbon market prices.

After that, many other proposals were made, inspired by the one presented in Milan. At the COP11 meeting in 2005, a block of developing nations led by Papua New Guinea and Costa Rica proposed compensating countries with tropical forests for reducing deforestation.

In 2007, at COP 13 in Bali, Indonesia, preventing emissions from tropical deforestation and preserving forests were central issues. At the meeting's end, the importance of forests to climate was officially recognized. The member nations decided that in the next two years, they would create a mechanism to reduce emissions from forests under a program called REDD (the acronym for the United Nations Programme on Reducing Emissions from Deforestation and Forest Degradation in Developing Countries). REDD was officially defined as policies and financial incentives that reduce emissions from deforestation and forest degradation, conserve and sustainably manage forests, and enhance forest carbon stocks in developing countries.

Member nations will have to decide how to make REDD a reality and how much they are willing to spend to do it, as more money will help it happen faster.
In the next few years, there will be many changes in how the world�s nations address the problem of climate change. REDD is one part of the solution, but ultimately it will be the attitudes of governments and individuals alike that will determine how we cope with climate change. For updates and more information, please visit and bookmark our website: http://www.ipam.org.br/
References
References and Links of Interest
General
Broecker, W.S., and R. Kunzig, 2008: Fixing Climate: What Past Climate Changes Reveal About the Current Threat--and How to Counter It. Hill and Wang, 253 pp.
Calvin, W.H., 2008. Global Fever: How to Treat Climate Change. University of Chicago Press, 337 pp.
Cowie, J., 2007: Climate Change: Biological and Human Aspects. Cambridge University Press, 504 pp. Cotton, W.R., and R.A. Pielke, Sr., 2007: Human Impacts on Weather and Climate. Cambridge University Press, 330 pp. See especially epilogue.
Henson, R., 2008: The Rough Guide to Climate Change. Rough Guides Ltd, 384 pp.
IPCC Reports:
• AR4 Synthesis Report
• Working Group I Report "The Physical
Science Basis"
•
Working Group II Report "Impacts, Adaptation and Vulnerability"
•
Working Group III Report
"Mitigation of Climate Change"
IPAM (Instituto de Pesquisa Ambiental da Amazônia, Amazon Institute of Environmental Research)
NCAR/UCAR Free podcasts on climate and climate change
The Encyclopedia of Earth (peer reviewed articles about earth)
U.S. Climate Change Science Program Synthesis and Assessment reports
Impacts
Carbon emissions calculators:
•
Household
emissions
(EPA, does not include air travel)
•
Household emissions
(The Nature Conservancy, includes air travel)
•
Business and organization emissions
(The Climate Trust)
Human Dimensions of Global Change (The National Academies)
Measurements / Observations
CO2 concentrations from ice cores and Mauna Loa (Oak Ridge National Laboratory/Carbon Dioxide Information Analysis Center)
Global CO2 emissions data (Netherlands Environmental Assessment Agency)
NASA GISS surface temperature analysis
NOAA climate monitoring
NOAA graphical anomaly products
Scripps CO2 monitoring program
U.S. National Snow and Ice Data Center (NSIDC)
Mitigation / Adaptation
Confronting climate change: Avoiding the unmanageable and managing the unavoidable (United Nations Foundation and Sigma XI)
References by Section
Earth and Its Climate
Evidence of Climate Change
Future Projections
Brazil, the Amazon, and Climate Change
International Agreements
Earth and Its Climate
Bellassen, V., R. Crassous, L. Dietzsch, and S. Schwarzman, September 2008: Reducing Emissions from Deforestation and Degradation: What Contribution from Carbon Markets? Climate report produced by Mission Climat of Caisse des Dépôts.
Bradley, R. S., M. K. Hughes, and H. F. Diaz, 2003: Climate in medieval time. Science, 302, 404-405.
Caillon, N., J. P. Severinghaus, J. Jouzel, J. Barnola, J. Kang, and V. Y. Lipenkov, 2003: Timing of atmospheric CO2 and Antarctic temperature changes across Termination III . Science, 299, 1728-1731.
CBC News, February 18, 2009: Tropical forests absorb 18% of CO2 emissions: study.
Hansen, M., S. Stehman, P. Potapov, T. Loveland, J. Townshend, R. DeFries, K. Pittman, B. Arunarwati, F. Stolle, M. Steininger, M. Carroll, C. DiMiceli, 2008: Humid tropical forest clearing from 2000 to 2005 quantified by using multitemporal and multiresolution remotely sensed data. Proceedings of the National Acadamy of Science of the United States of America, 0804042105v1-0, July 8, 2008.
Henson, R., 2008: The Rough Guide to Climate Change. Rough Guides Ltd, 384 pp.
Hönisch, B., N. Hemming, D. Archer, M. Siddall, and J. McManus, 2009: Atmospheric Carbon Dioxide Concentration Across the Mid-Pleistocene Transition. Science, 324, 1551-1554.
IPCC, 2007: Climate Change 2007: The Physical Science Basis . Contribution of Working Group I to the Fourth Assessment Report of the Intergovernmental Panel on Climate Change [S. Solomon, D. Qin, M. Manning, Z. Chen, M. Marquis, K. B. Averyt, M. Tignor and H. O. Miller (eds.)]. Cambridge University Press, Cambridge, United Kingdom and New York, NY, USA, 996 pp.
IPCC, 2007: Climate Change 2007: Mitigation . Contribution of Working Group III to the Fourth Assessment Report of the Intergovernmental Panel on Climate Change [B. Metz, O.R. Davidson, P.R. Bosch, R. Dave, L.A. Meyer (eds.)]. Cambridge University Press, Cambridge, United Kingdom and New York, NY, USA, 996 pp.
Lüthi, D., M. Le Floch, B. Bereiter, T. Blunier, J. Barnola, U. Siegenthaler, D. Raynaud, J. Jouzel, H. Fischer, K. Kawamura, and T.Stocker, 2008: High-resolution carbon dioxide concentration record 650,000-800,000 years before present. Nature, 453, 379-382.
NOAA Satellite and Information Service and National Climatic Data Center: A Paleo Perspective on Global Warming: The "Medieval Warm Period."
ScienceDaily, June 19, 2009: Tropical Forest Sustainability: A Climate Change Boon.
UNFCC: Global Warming Potentials.
Windows to the Universe®: What Controls the Climate? and The Carbon Cycle.
World Resources Institute: Climate Analysis Indicators Tool.
Evidence of Climate Change
Brahic, Catherine, 2007: Melting of mountain glaciers is accelerating . NewScientist, January 30, 2007.
British Antarctic Survey, 2009: Press Release - Increasing Antarctic sea ice extent linked to the ozone hole . Number: 05/2009, 21 April 2009.
Calvin, W. H., 2008: Global Fever: How to Treat Climate Change. University of Chicago Press, 337 pp.
Dessler, A. E. and E. A. Parson, 2006: The Science and Politics of Global Climate Change: A Guide to the Debate. Cambridge University Press, 200 pp.
Domingues, C. M., J. A. Church, N. J. White, P. J. Gleckler, S. E. Wijffels, P. M. Barker, and J. R. Dunn, 2008: Improved estimates of upper-ocean warming and multi-decadal sea-level rise. Nature, 453, 1090-1093.
European Project on Ocean Acidification, 2008: Loss of Pteropods Might Be Catastrophic.
Henson, R., 2008: The Rough Guide to Climate Change. Rough Guides Ltd, 384 pp.
IPCC, 2007: Climate Change 2007: The Physical Science Basis . FAQ. Contribution of Working Group I to the Fourth Assessment Report of the Intergovernmental Panel on Climate Change [S. Solomon, D. Qin, M. Manning, Z. Chen, M. Marquis, K. B. Averyt, M. Tignor and H. O. Miller (eds.)]. Cambridge University Press, Cambridge, United Kingdom and New York, NY, USA. 996 pp.
IPCC, 2007: Climate Change 2007: Impacts, Adaptation, and Vulnerability . Contribution of Working Group II to the Fourth Assessment Report of the Intergovernmental Panel on Climate Change [Parry, Martin L., Canziani, Osvaldo F., Palutikof, Jean P., van der Linden, Paul J., and Hanson, Clair E. (eds.)]. Cambridge University Press, Cambridge, United Kingdom, 1000 pp.
IPCC, 2007: Climate Change 2007: Synthesis Report. Contribution of Working Groups I, II and III to the Fourth Assessment Report of the Intergovernmental Panel on Climate Change [Core Writing Team, Pachauri, R.K and Reisinger, A. (eds.)]. IPCC, Geneva, Switzerland, 104 pp.
Malhi, Y., J. Roberts, R. Betts, T. Killeen, W. Li, and C. Nobre, 2008: Climate Change, Deforestation, and the Fate of the Amazon. Science, 319, 169-172.
Marengo, J., C. Nobre, J. Tomasella, M. Cardoso, and M. Oyama, 2008: Hydro-climatic and ecological behaviour of the drought of Amazonia in 2005. Phil. Trans. R. Soc. B, 363, 1773-1778
NASA Goddard Institute for Space Studies Global Temperature Trends, 2008: 2008 Annual Summation.
National Center for Atmospheric Research (NCAR): How Do We Know the Earth Is Warming now?
Nepstad, D., 2007: The Amazon's Vicious Cycles: Drought and Fire in the Greenhouse. WWF International, Gland/Switzerland, 23 pp.
NOAA, 2008: Arctic Report Card 2008 .
NOAA, 2009: State of the Climate.
Parmesan, C. and G. Yohe, 2002: A globally coherent fingerprint of climate change impacts across natural systems. Nature, 421, 37-42.
Pew Center on Global Climate Change, 2007: Current Understanding of Antarctic Climate Change .
ScienceDaily, 2005: Warmer Air May Cause Increased Antarctic Sea Ice Cover. June 30, 2005.
ScienceDaily, 2009: Amazon Rainforest Carbon Sink Threatened By Drought. March 9, 2009.
ScienceDaily, 2009: Increasing Antarctic Sea Ice Extent Linked To Ozone Hole. April 22, 2009.
Turner, J., J. Comiso, G. Marshall, T. Lachlan-Cope, T. Bracegirdle, T. Maksym, M. Meredith, Z. Wang, and A. Orr, 2009: Non-annular atmospheric circulation change induced by stratospheric ozone depletion and its role in the recent increase of Antarctic sea ice extent. Geophysical Research Letters, 36.
University Corporation for Atmospheric Research (UCAR), 2007: Arctic Sea Ice Summer Minimums: Past and Future .
Future Projections
Bell, R., 2008: Unquiet ice speaks volumes on global warming. Scientific American, February 2008, p. 60-67.
Broecker, W. S., and R. Kunzig, 2008: Fixing Climate: What Past Climate Changes Reveal About the Current Threat--and How to Counter It. Hill and Wang, 253 pp.
Calvin, W. H., 2008: Global Fever: How to Treat Climate Change. University of Chicago Press, 337 pp.
Center for Health and the Global Environment (Harvard Medical School), 2005: Climate Change Futures: Health, Ecological and Economic Dimensions . 142 pp.
Colwell, R. R., Global climate and health: Predicting infectious disease outbreaks. Innovations, 1, 19-23.
Epstein, P. R., 2005: Climate change and human health . New England Journal of Medicine, 353, 1433-1436.
IPCC, 2007: Climate Change 2007: Synthesis Report: Summary for Policymakers. Contribution of Working Groups I, II and III to the Fourth Assessment Report of the Intergovernmental Panel on Climate Change [Core Writing Team, Pachauri, R.K and Reisinger, A. (eds.)]. IPCC, Geneva, Switzerland, 104 pp.
IPCC, 2007: Climate Change 2007: Impacts, Adaptation, and Vulnerability . Contribution of Working Group II to the Fourth Assessment Report of the Intergovernmental Panel on Climate Change [Parry, Martin L., Canziani, Osvaldo F., Palutikof, Jean P., van der Linden, Paul J., and Hanson, Clair E. (eds.)]. Cambridge University Press, Cambridge, United Kingdom, 1000 pp.
Holland, G. J. and P. J. Webster, 2007: Heightened tropical cyclone activity in the North Atlantic: Natural variability or climate trend? Philosophical Transactions of the Royal Society of London, 365, 2695-2716.
Jacobson, M. Z., 2008: On the causal link between carbon dioxide and air pollution mortality. Geophys. Res. Lett., 35, L03809.
McAuliffe, K., 2008: Ocean acidification: A global case of osteoporosis . Discover, July 16, 2008.
Miles, L., A. Grainger, and O. Phillips, 2004: The impact of global climate change on tropical forest biodiversity in Amazonia. Global Ecol. Biogeogr., 13, 553-565.
Soares Filho, B., D. Nepstad, L. Curran, G. Cerqueira, R. Garcia, C. Ramos, E. Voll, A. McDonald, P. Lefebvre, and P. Schlesinger, 2006: Modelling conservation in the Amazon basin. Nature, 440, 520-523.
Stern, N., 2006: The Economics of Climate Change: The Stern Review. HM Treasury, published by Cambridge University Press, Cambridge, United Kingdom, 712 pp.
Struck, D., 2006: Climate Change Drives Disease to New Territory. The Washington Post, May 5, 2006.
Trapp, R.., N. Diffenbaugh, H. Brooks, M. Baldwin, E. Robinson, and J. Pal, 2007: Changes in severe thunderstorm environment frequency during the 21st century caused by anthropogenically enhanced global radiative forcing. Proceedings of the National Acadamy of Science of the United States of Americas, 104, 19719-19723.
University of Arizona, 2009: Sea level rise animations and graphics .
University Center for Atmospheric Research (UCAR), 2005: Hurricanes Are Getting Stronger, Study Says .
University Corporation for Atmospheric Research (UCAR), 2006: Arctic Sea Ice Summer Minimums 1990 to 2049 .
University Corporation for Atmospheric Research (UCAR), 2007: Frequency of Atlantic Hurricanes Doubled Over Last Century; Climate Change Suspected .
University Corporation for Atmospheric Research (UCAR), 2008: Dengue Fever Heads North .
U.S. Centers for Disease Control and Prevention, 2009: Dengue.
Brazil, the Amazon, and Climate Change
Azevedo-Ramos, Claudia, 2008: Sustainable development and challenging deforestation in the Brazilian Amazon: the good, the bad and the ugly. Unasylva, 59, 12-16.
Bellassen, V., R. Crassous, L. Dietzsch, and S. Schwarzman, September 2008: Reducing Emissions from Deforestation and Degradation: What Contribution from Carbon Markets? Climate report produced by Mission Climat of Caisse des Dépôts.
Brahic, C., 2009: Parts of Amazon close to tipping point. NewScientist, 05 March 2009.
BBC News, 2004: Vampire bats on attack in Brazil. 3 April 2004.
FAO, 2006: Global Forest Resources Assessment 2005: Progress towards sustainable forest management . ( Annex 3: Global tables ), FAO, Rome, Italy.
Hance, J., 2008: Large-scale Amazon deforestation or drying would have dire global consequences . Mongabay.com, February 21, 2008.
INPE, 2008: Projeto PRODES - monitoramento da floresta Amazônica Brasileira por satélite.
Malhi, Y., J. Roberts, R. Betts, T. Killeen, W. Li, and C. Nobre, 2008: Climate Change, Deforestation, and the Fate of the Amazon. Science, 319, 169-172.
Mendonça, M., M. Diaz, D. Nepstad , R. Seroa da Motta, A. Alencar, J, Gomes, and R. Ortiz, 2004: The economic cost of the use of fire in the Amazon . Ecological Economics, 49, 89-105.
NASA, 2007: Tropical Deforestation.
NASA, 2005: Tropical Deforestation Affects Rainfall in The U.S. and Around the Globe .
National Geographic News, 2009: Vampire Bats Biting People . July 16, 2009
Nepstad, D.,B., Soares-Filho, F. Merry, P. Moutinho, H. Rodrigues, M. Bowman, S. Schwartzman, O. Almeida, S. Rivero, 2007: The Costs and Benefists of Reducing Carbon Emissions from Deforestation and Forest Degradation in the Brazilian Amazon . REDD: Reducing Emissions from Deforestation and Forest Degradation, The Woods Hole Research Center, 26 pp.
Nepstad, D., C. Stickler, B., Soares-Filho, and F. Merry, 2007: Interactions among Amazon land use, forests and climate: prospects for a near-term forest tipping point . Phil. Trans. R. Soc. B, 363, 1727-1746.
Phillips, O., L. Aragão, S. Lewis, S., J. Fisher, J. Lloyd, G. López-González, Y. Malhi, A. Monteagudo, J. Peacock, C. Quesada,G. van der Heijden, S. Almeida, L. Amaral, G. Aymard, T. Baker, O. Bánki , L. Blanc, D. Bonal, P. Brando, J. Chave, A. Alves de Oliveira, N. Cardozo, C. Czimczik, T. Feldpausch, P. Meir, C. Mendoza, A. Morel, D. Neill, D. Nepstad, S. Patiño, M. Peñuela, F. Prieto, Ramírez, M. Schwarz, J. Silva, M. Silveira, A. Thomas, H. ter Steege, J. Stropp, K. Chao, T. Erwin, A. Di Fiore, E. Honorio C., H. Keeling, T. Killeen, W. Laurance, A. Peña Cruz, N. Pitman, P. Núñez Vargas, H. Ramírez-Angulo, A. Rudas, R. Salamão, N. Silva, J. Terborgh, A. Torres-Lezama, A., 2009: Drought Sensitivity of the Amazon Rainforest, Science, 323, 1344-1347.
Scherr, S. and S. Sthapit, 2009: Farming and Land Use to Cool the Planet . 2009 State of the World: Into a Warming World. The Worldwatch Institute, 30-49.
ScienceDaily, 2009: Amazon Rainforest Carbon Sink Threatened By Drought. March 9, 2009.
Seed, 2006: Rainforests: Carbon Sink or Carbon Source? SEEDMAGAZINE.COM, April 27, 2006.
Vince, G., 2005: Rabid vampire bats attack Brazilian children. NewScientist, 03 November 2005.
Vittor, A., R. Gilman, J. Tielsch, G. Glass, T. Shields, W. Sanchez Lozano, Pinedo-Cancino, and J. Patz, 2006; The effect of deforestation on the human-biting rate of Anopheles darlingi, the primary vector of falciparum malaria in the Peruvian Amazon. Am. J. Trop. Med. Hyg., 74, 3-11.
Walsh, B., 2009: Study: Economic Boost of Deforestation Is Short-Lived . Time, June 12, 2009.
World Resources Institute: Climate Analysis Indicators Tool
International Agreements
M. Skutsch, N. Bird, E. Trines, M. Dutschke, P. Frumhoff, B. de Jong, P. van Laake, O. Masera, and D. Murdiyarso, 2006: Clearing the way for reducing emissions from tropical deforestation . Environmental Science & Policy, 10, 322-334.
UNFCCC, downloaded 2009: Clean Development Mechanism (CDM).
UNFCCC, downloaded 2009: Full Text of the Convention, Article 2: Objective.
UNFCCC, downloaded 2009: Kyoto Protocol.
UNFCCC, downloaded 2009: Status of Ratification.
Contributors
COMET Sponsors
The COMET® Program is sponsored by NOAA National Weather Service (NWS), with additional funding by:
- Air Force Weather (AFW)
- European Organisation for the Exploitation of Meteorological Satellites (EUMETSAT)
- Meteorological Service of Canada (MSC)
- National Environmental Education Foundation (NEEF)
- National Polar-orbiting Operational Environmental Satellite System (NPOESS)
- NOAA National Environmental Satellite, Data and Information Service (NESDIS)
- Naval Meteorology and Oceanography Command (NMOC)
Funding
- Blue Moon Fund
- David and Lucille Packard Foundation
Project Contributors
Senior Project Manager
- Dr. Patrick Parrish — UCAR/COMET
Project Lead
- Dr. Vickie Johnson — UCAR/COMET
- Raquel Dieguez — IPAM
Instructional Design
- Dr. Vickie Johnson — UCAR/COMET
Principal Science Advisors
- Paulo Moutinho — IPAM
- Osvaldo Stella — IPAM
Additional Science Advisors
- Flavia Gabriela Oyo França — IPAM
- Erika Pinto — IPAM
Science Writer
- Jennifer Frazer — UCAR/COMET
Graphics/Interface Design
- Steve Deyo — UCAR/COMET
- Brannan McGill — UCAR/COMET
Multimedia Authoring
- Dan Riter — UCAR/COMET
Print Version Authoring
- David Russi — UCAR/COMET
Audio Editing/Production
- Seth Lamos — UCAR/COMET
Portuguese Audio Narration
- Claudio Savaget — Savaget Produções
COMET HTML Integration Team 2021
- Tim Alberta — Project Manager
- Dolores Kiessling — Project Lead
- Steve Deyo — Graphic Artist
- Ariana Kiessling — Web Developer
- Gary Pacheco — Lead Web Developer
- David Russi — Translations
- Tyler Winstead — Web Developer
COMET Staff, October 2009
Director
- Dr. Timothy Spangler
Deputy Director
- Dr. Joe Lamos
Administration
- Elizabeth Lessard, Administration and Business Manager
- Lorrie Alberta
- Michelle Harrison
- Hildy Kane
Hardware/Software Support and Programming
- Tim Alberta, Group Manager
- Bob Bubon
- James Hamm
- Ken Kim
- Mark Mulholland
- Wade Pentz, Student
- Malte Winkler
Instructional Designers
- Dr. Patrick Parrish, Senior Project Manager
- Dr. Alan Bol
- Lon Goldstein
- Bryan Guarente
- Dr. Vickie Johnson
- Tsvetomir Ross-Lazarov
- Marianne Weingroff
Media Production Group
- Bruce Muller, Group Manager
- Steve Deyo
- Seth Lamos
- Brannan McGill
- Dan Riter
- Carl Whitehurst
Meteorologists/Scientists
- Dr. Greg Byrd, Senior Project Manager
- Wendy Schreiber-Abshire, Senior Project Manager
- Dr. William Bua
- Patrick Dills
- Dr. Stephen Jascourt
- Matthew Kelsch
- Dolores Kiessling
- Dr. Arlene Laing
- Dr. Elizabeth Mulvihill Page
- Amy Stevermer
- Warren Rodie
Science Writer
- Jennifer Frazer
Spanish Translations
- David Russi
NOAA/National Weather Service - Forecast Decision Training Branch
- Anthony Mostek, Branch Chief
- Dr. Richard Koehler, Hydrology Training Lead
- Brian Motta, IFPS Training
- Dr. Robert Rozumalski, SOO Science and Training Resource (SOO/STRC) Coordinator
- Ross Van Til, Meteorologist
- Shannon White, AWIPS Training
Meteorological Service of Canada Visiting Meteorologists
- Phil Chadwick
IPAM Staff, November 2009
Climate Change Program
Coordinators
- Paulo Moutinho
- André Lima
- Ane Alencar
- Osvaldo Stella
Researchers
- Claudia Stickler
- Erika Pinto
- Flávia Gabriela
- Paula Moreira
Research Assistants
- André Nahur
- Isabel de Castro
- Ricardo Rettmann
Communications
- Raquel Dieguez
- Letícia Campos
Administrative Assistant
- Nadir Silva