Introduction
The NOAA Tidal Analysis Datum Calculator (aka TAD) reads a time series of water level data and calculates several tidal datums.The first three sections of this lesson address how TAD works, including data requirements, calculation methods, and output files. This followed by an opportunity to practice using TAD to compute tidal datums and analyze the output.
Objectives
After completing the lesson, you will be able to do the following:
- Describe what the NOAA tidal analysis datums calculator (TAD) does and how it does
it
- Describe the data format read by TAD
- Describe the data requirements (minimum length of record, data gaps)
- Describe the processes TAD uses to compute datums
- Describe how TAD determines which process to utilize
- Describe the output files computed by TAD
- List the output files
- Describe the contents of the SDC.out file
- Given a properly formatted dataset, determine tidal datums using TAD.
What Does TAD Do?
What Does TAD Do? » Read Data
The data file that TAD reads needs to adhere to a simple format.
- Each line has a date/time and water level, separated by a comma (i.e., a csv file).
- The format must follow mm/dd/yyyy HH:MM, xxx.xxx or mm‐dd‐yyyy HH:MM, xxx.xxx.
- The filename cannot contain spaces and should end with “.txt”.
- Note that some .csv files will not work. If that occurs open the file and save it as a .txt file.
To format data from the NOAA Tides and Currents website, see the Appendix.
Date/Time
TAD accommodates any consistent water level time sampling interval (e.g., 5, 6, 10, 15 min, etc.) up to 1 hour.
Data Gaps
TAD will not accept a data file with a gap that exceeds 3 hours, but will fill in all gaps less than 3 hours using a least-squares fit.
Water Level
Water level (WL) measurements can be expressed in meters, centimeters, millimeters, feet, or inches, with up to three decimal places. NOAA CO-OPS data has 2 decimal places for measurements in feet, 3 decimal places for measurements in meters.
Data Length
TAD can read files up to a maximum file size of 50 MB. This amounts to about 300 months (25 years) of observations at 6-minute intervals. While TAD will compute datums for as little as 15 days of data, NOS strongly recommends that your data covers at least 30 days because that captures the period of one full lunar month.
Metadata
To run TAD, you will also be prompted for (1) the latitude and longitude of the tide station and (2) the time zone in which the date/time was recorded.
- The position is used to locate nearby control stations. The format is decimal degrees.
- The time is used for simultaneous comparison of observed data with that from control stations (discussed later).
What Does TAD Do? » Apply Low Pass Filter
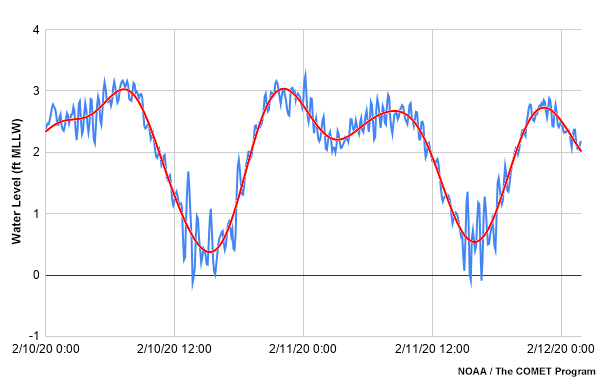
Water levels observed at Freshwater Locks, LA. “Noisy” blue line is observed water levels; smooth red line is data after passing through a low pass filter.
After reading the data, TAD applies a low pass filter that smooths the data. Astronomical tides pass through the filter, while short-duration meteorological and oceanographic influences are filtered out. In the graph above we see a time series of observed and filtered data for a particularly noisy tide gauge.
What Does TAD Do? » Pick Tides
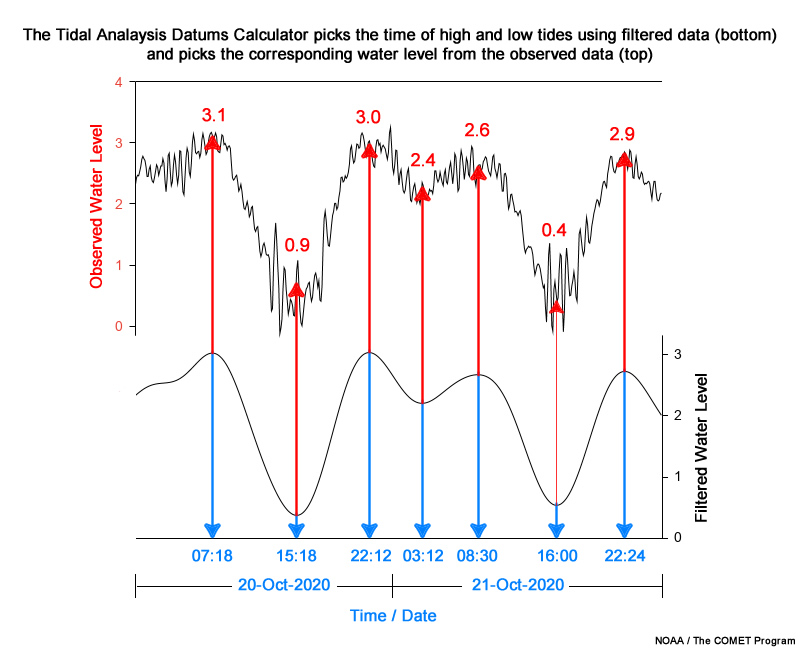
TAD picks the time of high and low tides using filtered data (top) and picks the corresponding water level from observed (unfiltered) data (bottom).
Using the filtered data, TAD first picks the time of high and low tides.
Using that time, TAD picks the water level from the observed (unfiltered) data.
What Does TAD Do? » Calculate Datums
Using the high and low tides, TAD calculates the following datums:
- Mean higher high water (MHHW)
- Mean high water (MHW)
- Mean low water (MLW)
- Mean lower low water (MLLW)
- Mean tide level (MTL: (MHW+MLW)/2 )
- Diurnal tide level (DTL: (MHHW+MLLW)/2 )
- Diurnal high water inequality (DHQ: MHHW-MHW)
- Diurnal low water inequality (DLQ: MLW-MLLW)
- Mean range of tide (MN: MHW-MLW)
- Great diurnal range (GT: MHHW-MLLW)
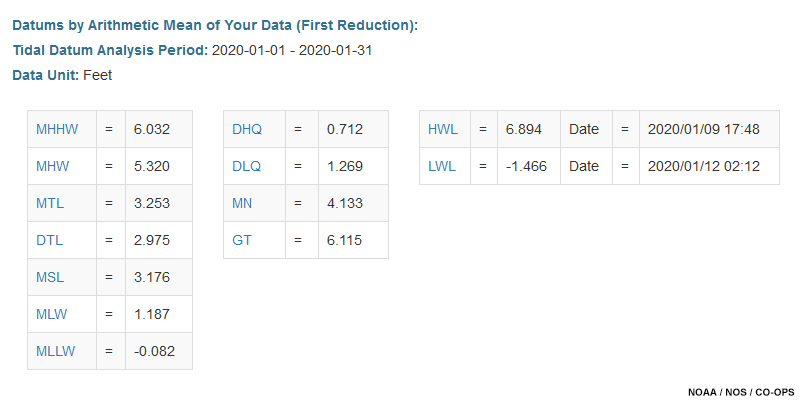
Mean sea level (MSL) is calculated as the average of hourly water levels.
Highest water level (HWL, +date) and lowest water level (LWL, +date) are also reported.
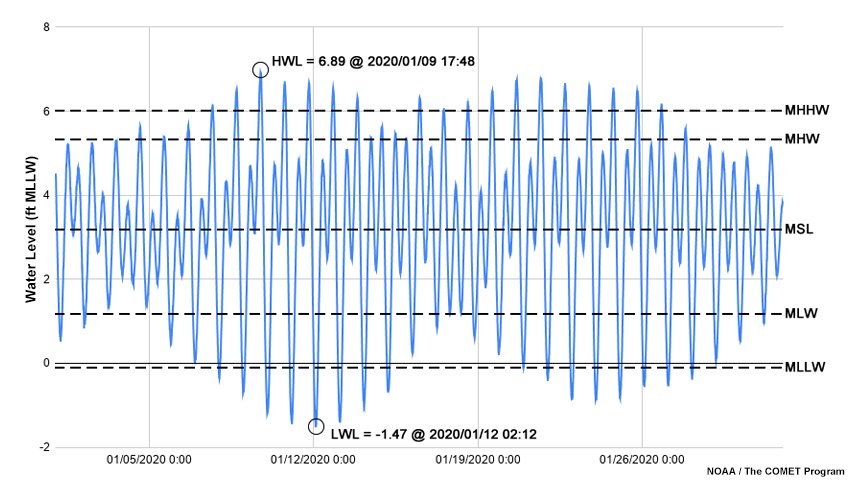
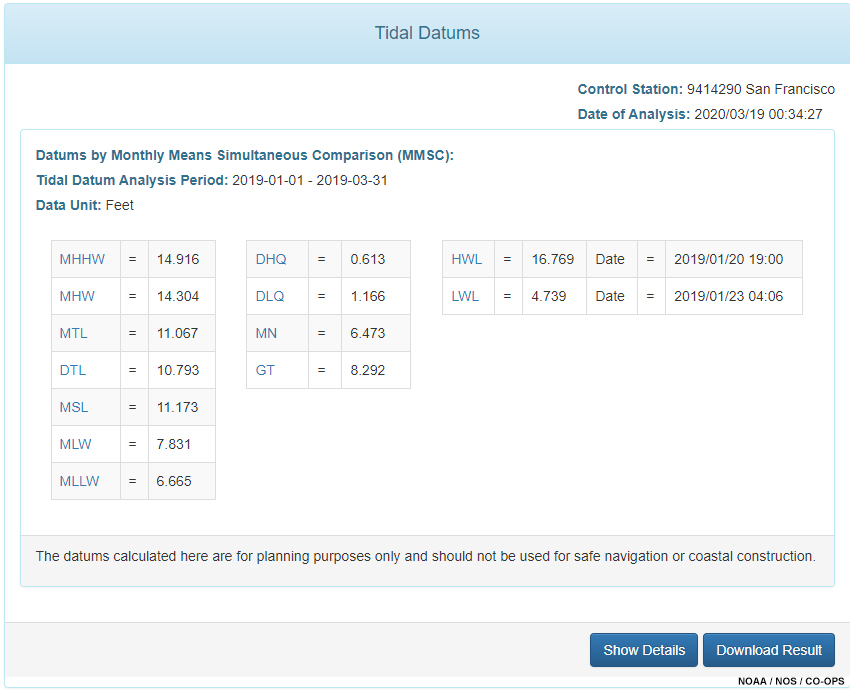
Water levels and tidal datums at San Francisco, January, 2020.
Note that TAD does not provide all tidal datums. For example, highest and lowest astronomical tide datums (HAT and LAT) are not provided. These datums require a more sophisticated analysis and/or data spanning a complete tidal datum epoch.
Reference: Tidal Datums (NOAA)
What Does TAD Do? » Questions
Question
What is the minimum length of record required by TAD to compute tidal datums?
The correct answer is b.
TAD will compute datums for as little as 15 days of data, but NOS strongly recommends that your data covers at least 30 days long because that captures the period of one full lunar month.
Question
Select the terms that best complete the statements below.
TAD first picks the time of high and low tides using data that has been passed through a low-pass filter. Then using that time, TAD picks the water level from the observed unfiltered data.
Datum Calculation Methods
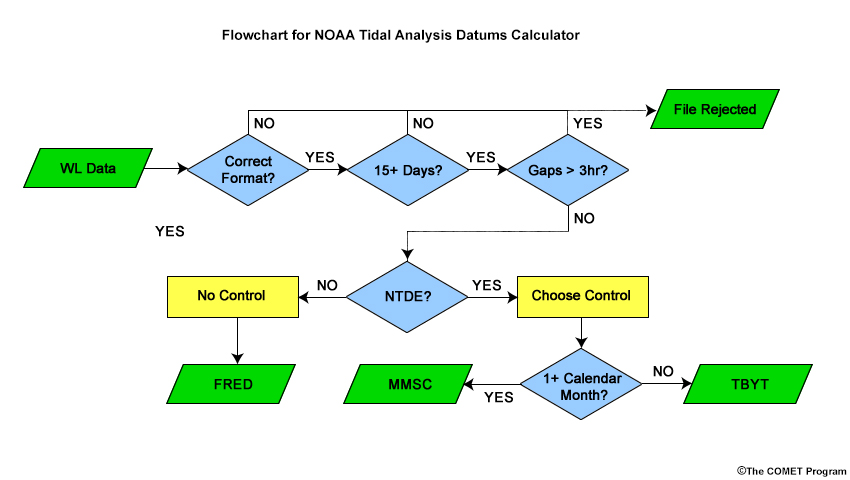
TAD employs different methods to calculate tidal datums, depending on the length of the data record and the operational needs of your project. First, you decide whether to tie the calculated datums to the current 18.6-year National Tidal Datum Epoch (NTDE). Based on that and the length of record, TAD chooses one of three methods of calculation:
- First reduction (FRED),
- Month mean simultaneous comparison (MMSC), or
- Tide by tide simultaneous comparison (TBYT).
Datum Calculation Methods » Tie to NTDE?
The first decision point in using TAD is whether to tie the calculated datums to the current National Tidal Datum Epoch (NTDE). It is beyond the scope of this lesson to elaborate on the reasons, but in general, they can be summarized as follows:
When tied to the NTDE, TAD generates an NTDE-equivalent datum. These datums do the following:
- Account for the full range of astronomical tides;
- Average out short and long-term non-astronomical fluctuations; and
- Enable the comparison of datums derived from different locations over different periods of time.
Datums not tied to the NTDE:
- Better reflect the current sea level condition, and
- May be computed seasonally for those interested in temporal variability, such as seasonal inundation or exposure.
Datum Calculation Methods » Yes: Tie to the NTDE
To compute tidal datums at a new station that are tied to the NTDE, first choose a control station. TAD will list nearby control stations in order of increasing distance from the latitude and longitude entered earlier. Only control stations that were active during data collection are shown.
With a control station chosen, TAD examines the time length of your data and chooses a method for computing datums.
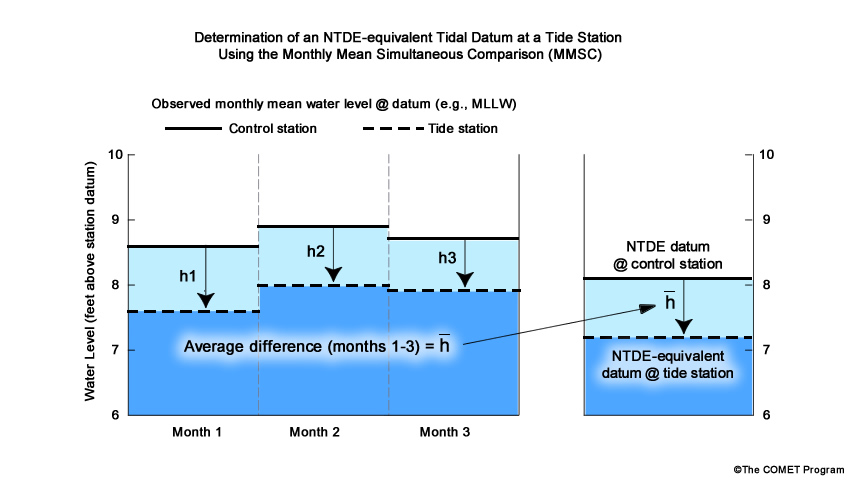
If the record includes at least one full calendar month, then TAD employs the Monthly Mean Simultaneous Comparison (MMSC) method. Using MMSC, TAD calculates monthly mean datums for each calendar month for both the observed tide station and the control station for the same time period. Then it determines the average monthly difference and applies this difference to the control station NTDE datums to determine NTDE-equivalent datums at the observed tide station.
Note that “extra” data resulting from incomplete months at the beginning and/or end of the record are not used in datum calculation.
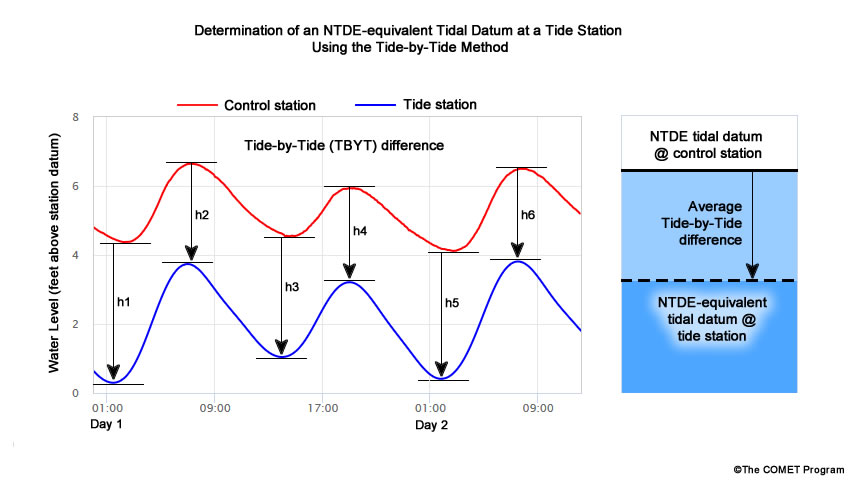
If the record does not include one full calendar month, then TAD employs the Tide by Tide (TBYT) comparison method. TBYT is similar to MMSC, but differences are determined tide-by-tide, not month-by-month. Again, the result is NTDE equivalent tidal datums.
Note that a full calendar month of data is required for MMSC, not just 30 or 31 days. For example 60 days of data from July 2 through August 30 would still result in the TBYT method to compute an NTDE equivalent datum.
Datum Calculation Methods » No: Do Not Tie to the NTDE
To not tie TAD-calculated tidal datums to the NTDE, one selects “No Control Station” from the drop-down list of control stations provided in TAD. TAD then determines tidal datums using the First Reduction (FRED) method. FRED is merely the average of all high and low water levels (as appropriate) to determine datums. For example, the average of all high waters yields the Mean High Water datum.
Note that TAD requires the station coordinates before you can select "No control station". Even if a control station is not needed, station coordinates help determine datum computation method.
Datum Calculation Methods » Questions
Question
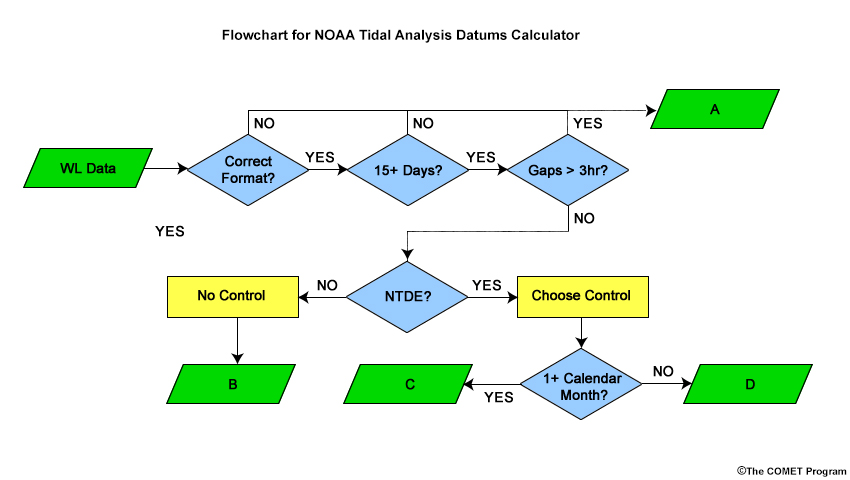
For each box labeled A, B, C, or D, select the method of datum computation. Recall that FRED=First reduction; MMSC=Monthly mean simultaneous comparison; TBYT=Tide by tide comparison.
- If a file does not have the correct format, is too short, or has gaps longer than 3 hours, the entire file is rejected.
- If no control station is selected, then the datum is computed using FRED (First reduction).
- If a control station is selected and the length of record spans at least one full calendar month, then datums are computed using MMSC (Monthly mean simultaneous comparison).
- If a control station is selected and the length of record does not span a full calendar month, then datums are computed using TBYT (Tide by tide comparison).
Question
For each scenario below, select the method employed by TAD to compute datums.
The correct answers are shown above. They can be determined by using the flowchart below.
Datum Calculation Methods » Choosing a Control Station
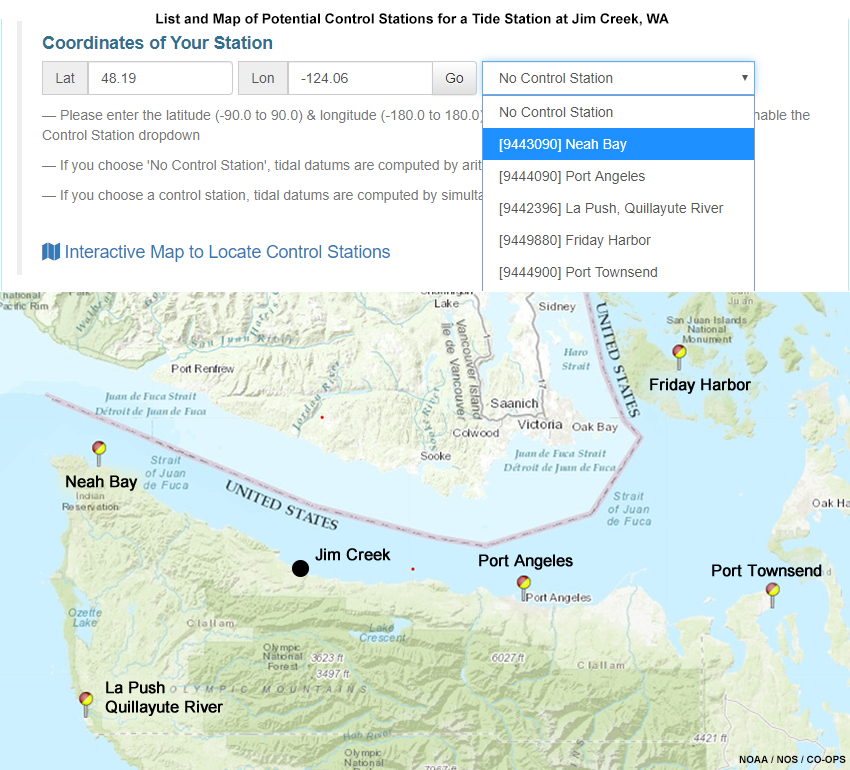
When choosing a control station, TAD lists potential stations in order of increasing distance from your “new” station. This graphic shows the listing of potential control stations for a new tide station at Jim Creek, WA, along with a map showing their locations. Note that the nearest control station may not be your best option. Consider nearby control stations in similar geomorphological and hydrological settings. To do this, plot water levels and compare your station data to several potential control stations for the same 4-5 day period. Things to look for include:
- Shape of the tide curve and time offset (similar is better),
- Meteorological effects, and
- Similar hydrographic setting.
This topic will be explored more thoroughly in a forthcoming lesson.
Water level data for the U.S. is available at the NOAA Tides and Currents website.
TAD Output
After entering the appropriate data and running TAD, the resulting datums are presented on the webpage and are available for download. If you are unsure of what the datums are (for example, many may not be familiar with DHQ), the names are linked to the NOAA Tidal Datums page (though not in the screen capture graphic).
TAD Output » Output Files
TAD generates several output files. These include the following:
- A spreadsheet of raw (observed) and filtered water levels;
- A spreadsheet of TAD picks for higher high water (HH), high water (H), low water (L), and lower low water (LL);
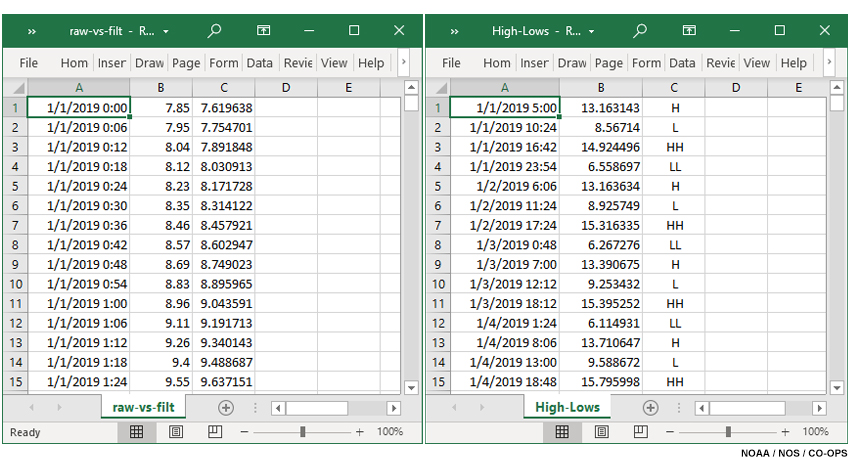
Spreadsheets showing raw (left, column B) and filtered water levels (left, column C) and times, heights, and classification of high/low tide picks (right, column C). Redwood City, CA.
- Monthly graphics of observed water levels with TAD picks;
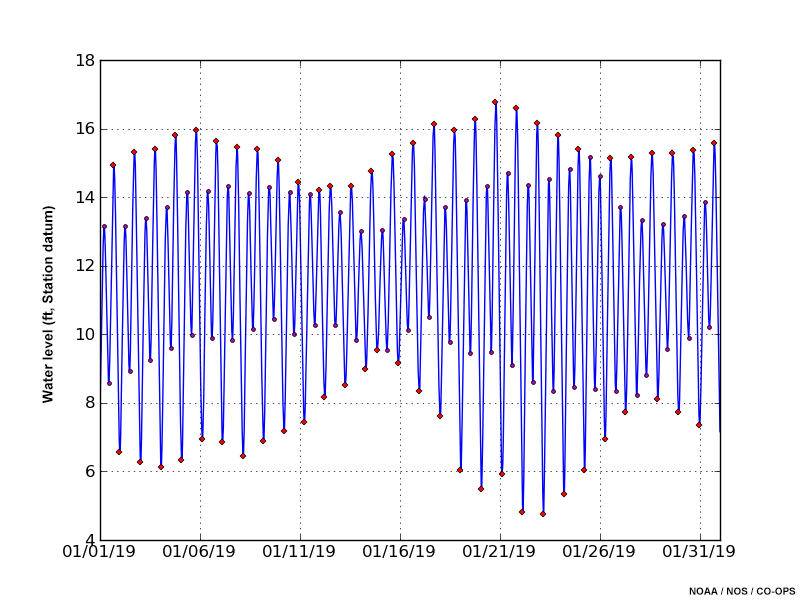
Time series plot of water levels and high/low tide picks for Redwood City, CA, January 2019
- A text file named SDC.out that summarizes the datum determinations. It can be opened with any standard text editor (e.g., Notepad). We examine this output file in more detail next.
Output files are downloaded to a compressed file named DatumsCalcResult.zip. If you are processing multiple stations, they all have the same name. Renaming files as they are downloaded will save potential confusion later.
TAD Output » SDC.out
In the tabs below we show example SDC.out files for results using the MMSC, TBYT, and FRED methods. The left column shows the file contents. The right column shows a description for each block of the file.
In general, each file contains metadata about the station and observations (period of record, number of observations, sampling interval, number of high/low tides, etc). Analyses that employ the MMSC and TBYT methods also include metadata for the control station. MMSC files contain computed monthly datums, based on the FRED method, which may be valuable for computing seasonal datums.
MMSC
|
Example |
Description |
|
Run Time: 2020-03-19 00:34:28 Using RedwoodCity_wl_JanMar2019.txt 21600 data points loaded. Interval: 0:06:00 |
Metadata |
|
All calculations and results are in Feet |
Metadata |
|
West coast/Pacific station: Using Standard Range Ratio Method |
|
|
Sampling Rate: 240 per day. - - - - - - - - - - - - - Using cutoff frequency of 4.0 per day - - - Data Start: 2019-01-01 00:00:00 Data End : 2019-03-31 23:54:00 Mean Water Level: 11.559 - - - - - - - - - - - - - - - - Highest Water Level: 16.780 Lowest Water Level: 4.710 Duration: 89 days, 23:54:00 High Tides Found: 174 Low Tides Found : 173 Tides per day: 3.9 Semi-Diurnal - Using EXHL 87 Highs 87 Higher Highs 87 Lows 86 Lower Lows |
Description of data Description of data filter Mean of 21600 data points Lower of 2 daily highs HIgher of 2 daily highs Higher of 2 daily lows Lower of 2 daily lows |
|
3 Monthly plots generated |
Metadata |
|
Control Datums for: 9414290 |
Control station ID (San Francisco, CA) |
|
MHHW, MHW, DTL, MTL, MSL, MLW, MLLW 11.818 11.207 8.898 9.160 9.098 7.113 5.978 GT, MN, DHQ, DLQ, NAVD, LWI, HWI 5.840 4.094 0.610 1.135 5.919 0.848 7.535 |
Datums for control station. All values relative to the station datum. |
|
SUBORDINATE MONTHLY MEANS: |
Section heading |
|
1 / 2019 : HWL = 16.769 MHHW = 15.413 MHW = 14.664 MSL = 11.511 MLW = 8.256 MLLW = 7.008 LWL = 4.739 |
Calculated datums: Jan 2019 |
|
2 / 2019 : HWL = 16.494 MHHW = 15.326 MHW = 14.687 MSL = 11.606 MLW = 8.417 MLLW = 7.381 LWL = 5.279 |
Calculated datums: Feb 2019 |
|
3 / 2019 : HWL = 16.258 MHHW = 14.916 MHW = 14.532 MSL = 11.563 MLW = 8.536 MLLW = 7.635 LWL = 6.130 |
Calculated datums: Mar 2019 |
|
TIDAL DATUMS BY Monthly Means Simultaneous Comparison: |
Method of datum determination |
|
3 Months of control station means retrieved. 3 months in the analysis |
Metadata |
|
Mean_Diff_MSL = 2.013 Mean Diff MTL = 1.907 Mean_Diff_DTL = 1.896 Mean_Ratio_MN = 1.581 Mean Ratio GT = 1.420 Mean_Diff_MHHW = 3.054 Mean_Diff_MHW = 3.049 Mean_Diff_MLW = 0.766 Mean_Diff_MLLW = 0.737 Mean Ratio DHQ = 1.004 Mean Ratio DLQ = 1.027 |
Mean values (n=3) for difference between subordinate station (Redwood City) and control station (San Francisco). Water level datums (MSL, MTL, DTL, MHHW, MHW, MLW, MLLW) are computed as the difference between water levels (Subordinate minus Control). Tidal range datums (MN, GT, DHQ, DLQ) are computed as a ratio (Subordinate divided by Control). |
|
Corrected values for MN, GT, MTL, DTL 6.473 8.292 11.067 10.793 Corrected values for DHQ, DLQ 0.613 1.166 Corrected values for MHHW, MHW, MLW, MLLW 14.872 14.256 7.879 6.715 |
Computed for all datums, but not used in all datum computation algorithms. |
|
Datums by Monthly Means Simultaneous Comparison (MMSC): |
Method of datum determination |
|
HWL = 16.769 (2019/01/20 19:00) MHHW = 14.916 MHW = 14.304 DTL = 10.793 MTL = 11.067 MSL = 11.173 MLW = 7.831 MLLW = 6.665 DHQ = 0.613 DLQ = 1.166 GT = 8.292 MN = 6.473 LWL = 4.739 (2019/01/23 04:06) |
Calculated tidal datums for station |
|
Feet |
Units for datums |
|
That is all. |
End-of-file note |
TBYT
|
Example |
Description |
|
Run Time: 2020-03-20 18:02:11 Using RC_wl_Jan15Feb15.txt 7441 data points loaded. Interval: 0:06:00 |
Metadata |
|
All calculations and results are in Feet |
Metadata |
|
West coast/Pacific station: Using Standard Range Ratio Method |
|
|
Sampling Rate: 240 per day. Using cutoff frequency of 4.0 per day Data Start: 2019-01-15 00:00:00 Data End : 2019-02-15 00:00:00 Mean Water Level: 11.642 - - - - - - - - - - - - - Highest Water Level: 16.780 Lowest Water Level: 4.710 Duration: 31 days, 0:00:00 High Tides Found: 60 Low Tides Found : 59 Tides per day: 3.8 Semi-Diurnal - Using EXHL - - - - - - - - - - - - - - - 30 Highs 30 Higher Highs 30 Lows 29 Lower Lows |
Description of data Description of data filter Mean of 7441 data points Lower of 2 daily highs HIgher of 2 daily highs Higher of 2 daily lows Lower of 2 daily lows |
|
2 Monthly plots generated |
Metadata |
|
Control Datums for: 9414750 |
Control station ID (Alameda, CA) |
|
MHHW, MHW, DTL, MTL, MSL, MLW, MLLW 9.931 9.311 6.634 6.886 6.781 4.465 3.333 GT, MN, DHQ, DLQ, NAVD, LWI, HWI 6.594 4.843 0.620 1.132 3.563 1.498 8.009 |
Datums for control station |
|
Calculating Datums by TBYT: |
Method of datum determination |
|
Estimated Time Difference: -29 Minutes |
|
|
Datums by Tide By Tide Comparison (TBYT): |
Method of datum determination |
|
HWL = 16.769 (2019/01/20 19:00) MHHW = 14.961 MHW = 14.321 DTL = 10.882 MTL = 11.129 MSL = 11.642 MLW = 7.938 MLLW = 6.798 DHQ = 0.640 DLQ = 1.140 GT = 8.183 MN = 6.383 LWL = 4.739 (2019/01/23 04:06) |
Tidal datums at station |
|
Feet |
Units for datums |
|
That is all. |
End-of-file note |
FRED
|
Example |
Description |
|
Run Time: 2020-03-20 18:44:43 Using RC_wl_JanMar.txt 21600 data points loaded. Interval: 0:06:00 |
Metadata |
|
All calculations and results are in Feet |
Metadata |
|
West coast/Pacific station: Using Standard Range Ratio Method |
|
|
Sampling Rate: 240 per day. Using cutoff frequency of 4.0 per day Data Start: 2019-01-01 00:00:00 Data End : 2019-03-31 23:54:00 Mean Water Level: 11.559 Highest Water Level: 16.780 Lowest Water Level: 4.710 Duration: 89 days, 23:54:00 High Tides Found: 174 Low Tides Found : 173 Tides per day: 3.9 Semi-Diurnal - Using EXHL 87 Highs 87 Higher Highs 87 Lows 86 Lower Lows |
Description of data Description of data filter Mean of 21600 data points Lower of 2 daily highs HIgher of 2 daily highs Higher of 2 daily lows Lower of 2 daily lows |
|
3 Monthly plots generated |
Metadata |
|
TIDAL Datums by Arithmetic Mean of Your Data (First Reduction): |
Method of datum determination |
|
HWL = 16.769 (2019/01/20 19:00) MHHW = 15.215 MHW = 14.626 DTL = 11.278 MTL = 11.514 MSL = 11.559 MLW = 8.402 MLLW = 7.341 DHQ = 0.589 DLQ = 1.061 MN = 6.223 GT = 7.874 LWL = 4.739 (2019/01/23 04:06) |
Tidal datums at station |
|
Feet |
Units for datums |
|
That is all. |
End-of-file note |
Exercise
In the following three exercises, you will use the Tidal Analysis Datum Calculator.
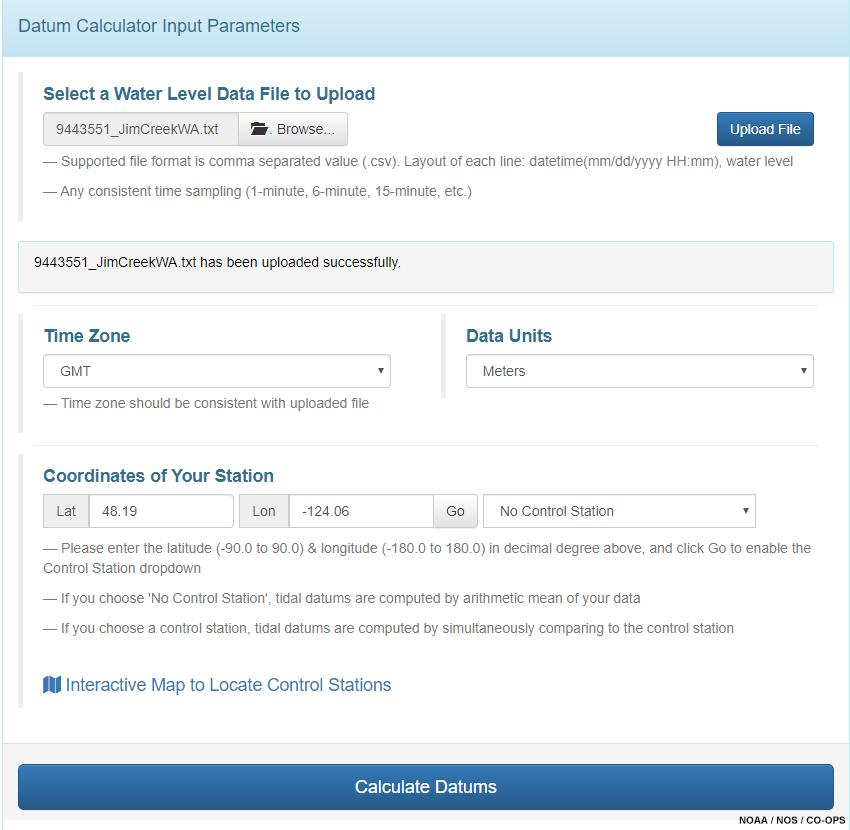
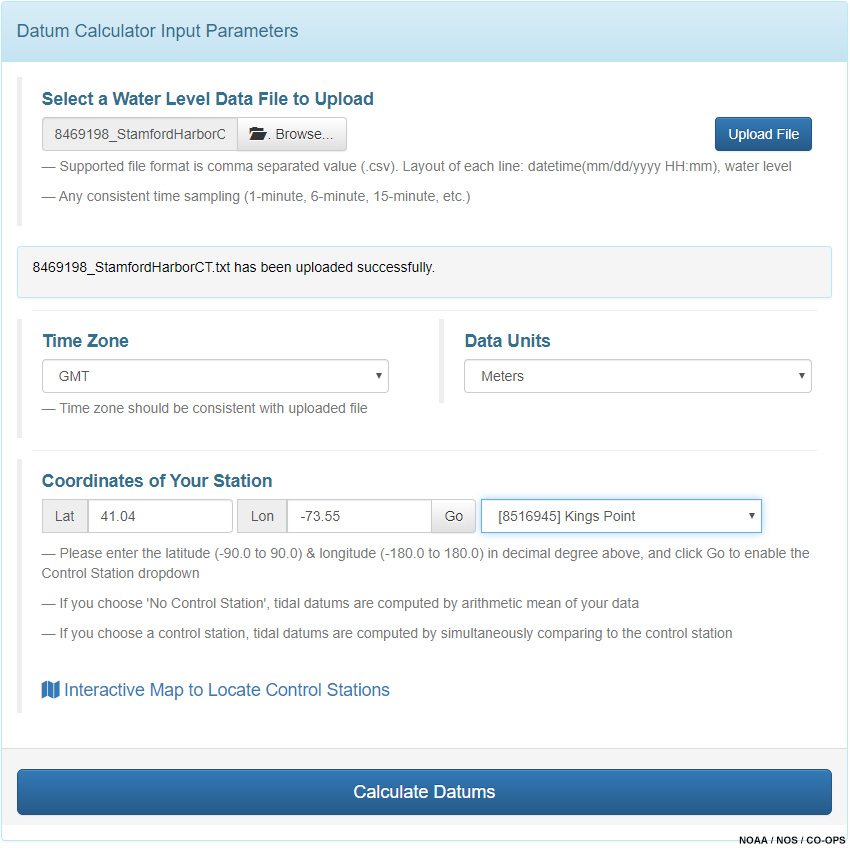
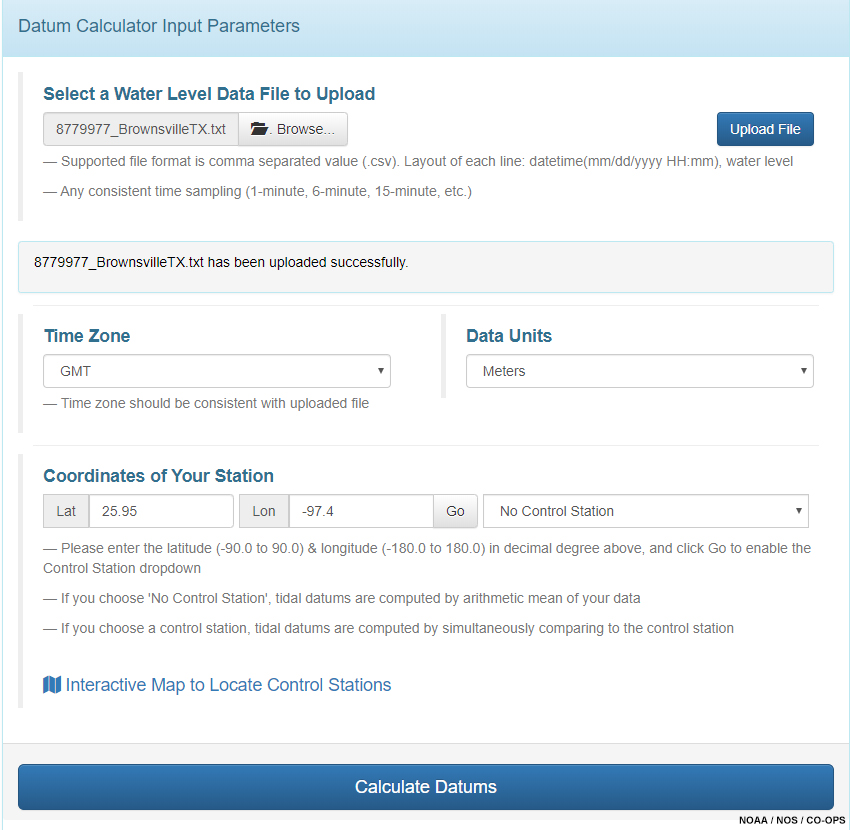
The web interface, shown above, is straightforward. First, enter the filename for the water level data and click “Upload File”. Once the file loads successfully, select a time zone and data units. Next enter the latitude and longitude of the new station and click “Go”. TAD will find the nearest control stations and list them under “Select Control Station.”
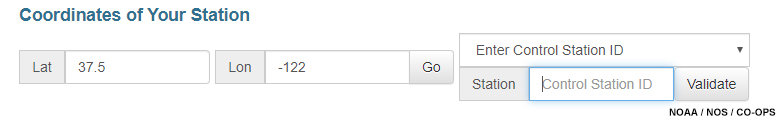
If the control station you wish to use is not listed, the last entry on the list is “Enter Control Station ID”. Select this option and enter the ID, as shown below.
The next three pages provide exercises to practice running TAD and reading the results.
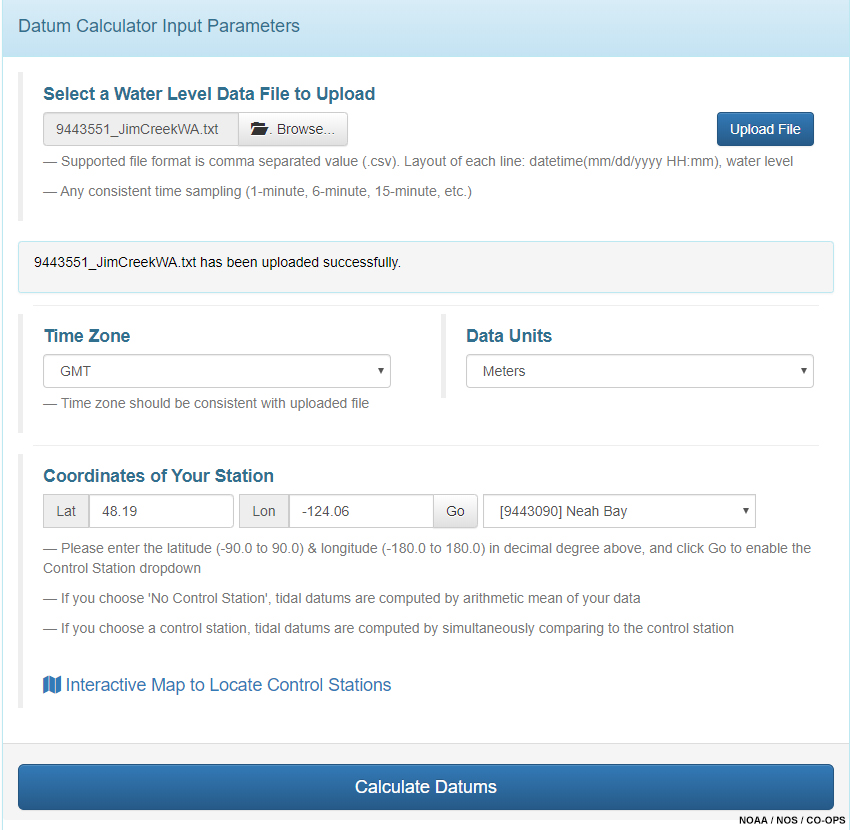
Exercise » Exercise 1: Jim Creek, WA
Using the information below, open TAD and compute 2 sets of tidal datums for Jim Creek, WA: one using the nearest control station, and another using no control station.
Note that the tidal datums calculator takes Lat/Lon coordinates in decimal degrees (e.g., 48.19). The positions given in the table above are in degrees and decimal minutes (e.g., 48° 11.2'). You will need to convert decimal minutes (e.g., 11.2’) to decimal degrees by dividing by 60 (11.2' / 60 = 0.19°). Then append that to the integer degree value (48). Thus 48° 11.2' = 48.19°. So the value you enter in TAD is 48.19 (no degree symbol).
Also recall that N latitude and E longitude are positive. S latitude and W longitude are negative. Thus, 124° W is -124°.
NOAA Tidal Analysis Datums Calculator (TAD)
|
Location |
Jim Creek, WA (9443551) |
|
Data File |
|
|
Time zone |
GMT |
|
Data Units |
meters |
|
Tide Type |
Mixed |
|
Latitude |
48° 11.2' N |
|
Longitude |
124° 3.8' W |
|
Start |
7/1/2016 0:00 |
|
End |
7/31/2016 23:54 |
Exercise » Exercise 1: Jim Creek, WA » Calculate Datums
Calculate tidal datums with the nearest control station (Neah Bay), then answer the questions below.
Question 1 of 2
Which method was used to calculate the datums?
The correct answer is b.
Question 2 of 2
Looking at your results, when datums were computed with a control station at Neah Bay, what is the reported value for MSL?
The correct answer is b.
MSL = 1.357 m
Both the computation method and MSL datum are displayed in the screenshot of the TAD results page shown below.
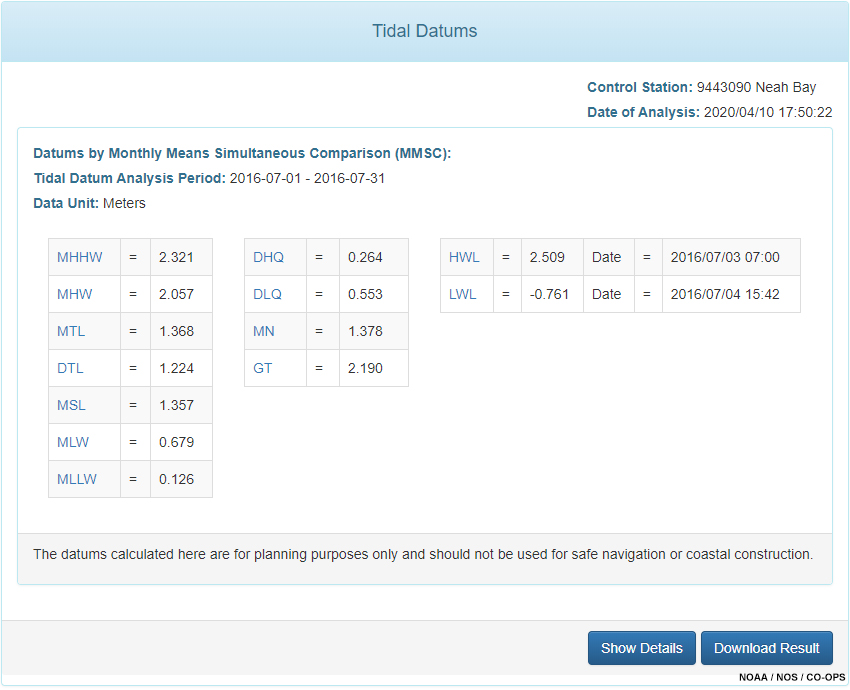
If you did not get this result, compare your input screen to this screenshot of the correct one.
Exercise » Exercise 1: Jim Creek, WA » Calculate Datums: No Control Station
Calculate tidal datums without a control station, then answer the questions below.
Question 1 of 2
Which method was used to calculate the datums?
The correct answer is a.
Question 2 of 2
When datums were computed with NO control station, what is the reported value for MSL?
The correct answer is a.
MSL = 1.156 m
Both the computation method and MSL datum are displayed in the screenshot of the TAD results page shown below.
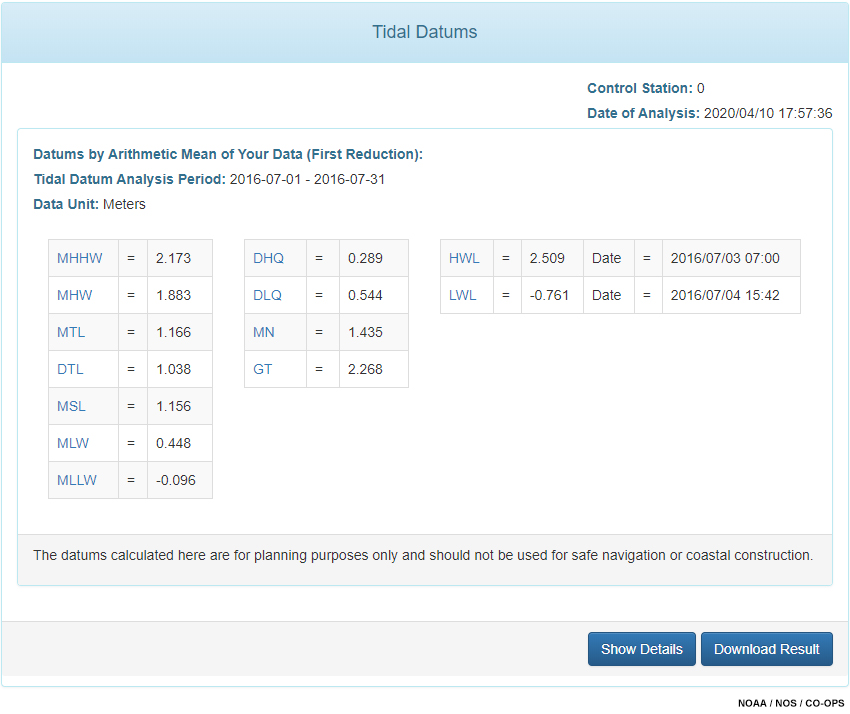
If you did not get the correct result, compare your input screen to this screenshot of the correct one.
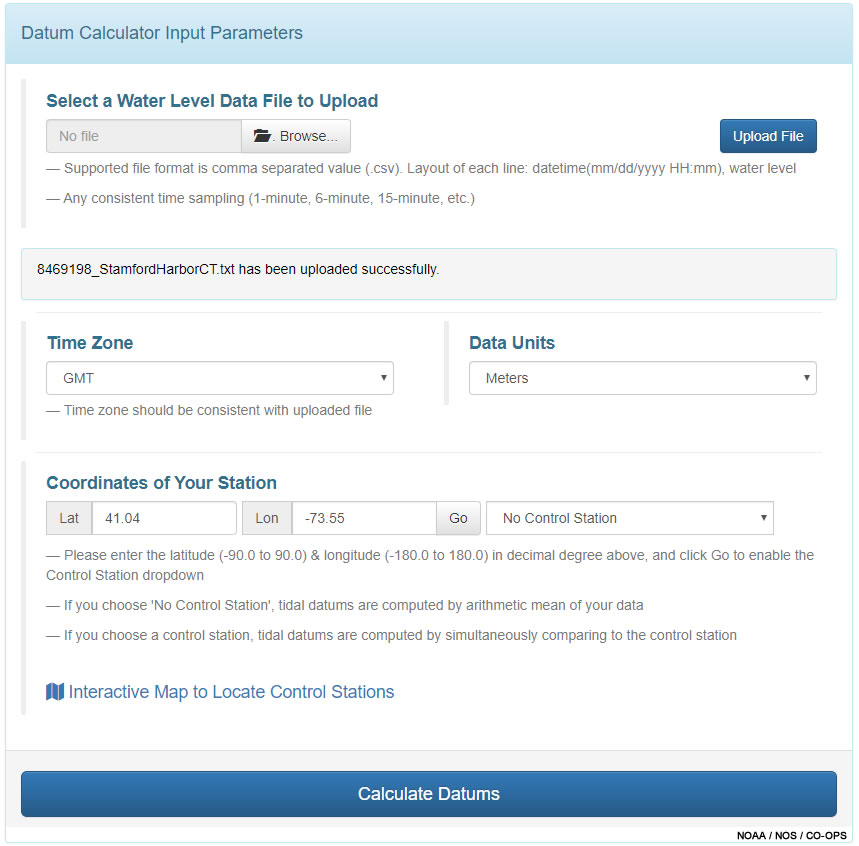
Exercise » Exercise 2: Stamford Harbor, CT
Using the information above, open TAD and compute 2 sets of tidal datums for Stamford Harbor, CT: one using the nearest control station, and another using no control station.
Note that the tidal datums calculator takes Lat/Lon coordinates in decimal degrees (e.g., 41.04). The positions given in the table above are in degrees and decimal minutes (e.g., 41° 2.3'). You will need to convert decimal minutes (e.g., 2.3’) to decimal degrees by dividing by 60 (2.3' / 60 = 0.04°). Then append that to the integer degree value (41). Thus 41° 2.3' = 41.04°. So the value you enter in TAD is 41.04 (no degree symbol).
Also recall that N latitude and E longitude are positive. S latitude and W longitude are negative. Thus, 73° W is -73°.
NOAA Tidal Analysis Datums Calculator (TAD)
|
Location |
Stamford Harbor, CT (8469198) |
|
Data file |
|
|
Time zone |
GMT |
|
Data Units |
meters |
|
Tide Type |
Semidiurnal |
|
Latitude |
41° 2.3' N (0.04) |
|
Longitude |
73° 32.8' W (0.55) |
|
Start |
7/1/2015 0:00 |
|
End |
7/31/2015 23:54 |
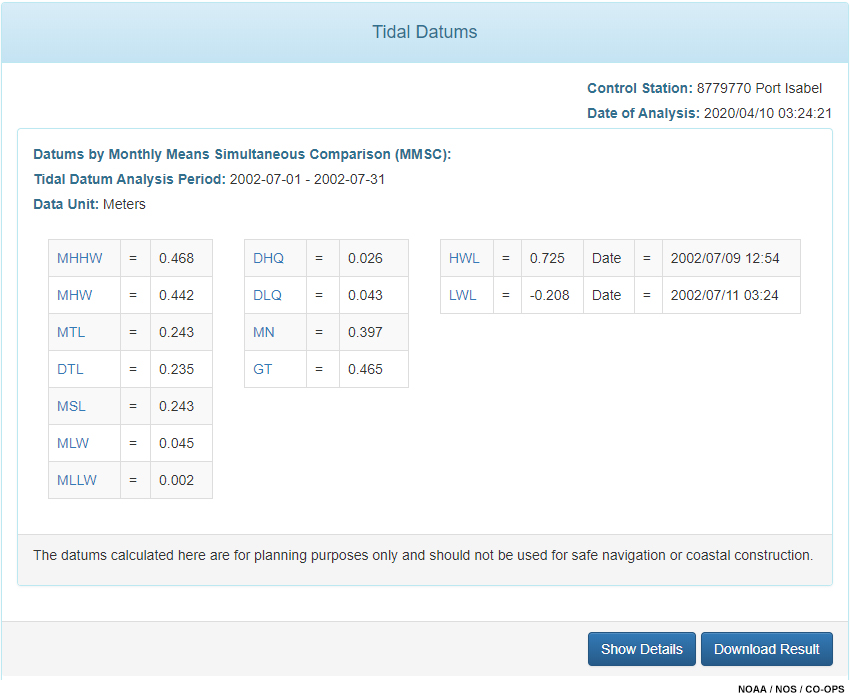
Exercise » Exercise 2: Stamford Harbor, CT » Calculate Datums: With Control Station
Calculate tidal datums with the nearest control station (Kings Point, NY). Then answer the questions below.
Question 1 of 2
Which method was used to calculate the datums?
The correct answer is b.
Question 2 of 2
Looking at your results, when datums were computed with a control station, what is the reported value for MSL?
The correct answer is d.
MSL = 1.153 m
Both the computation method and MSL datum are displayed in the screenshot of the TAD results page shown below.
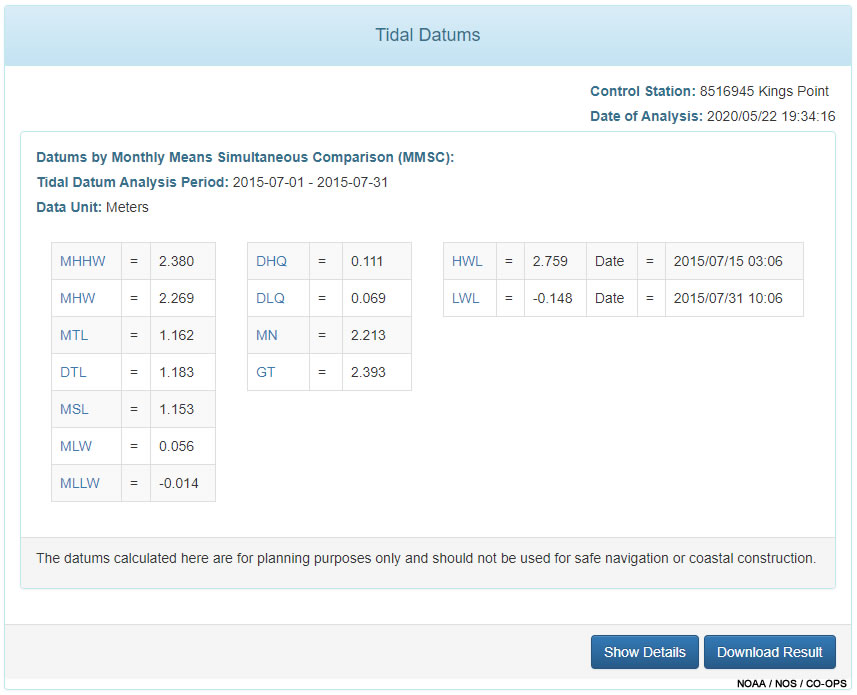
If you did not get this result, compare your input screen to this screenshot of the correct one.
Exercise » Exercise 2: Stamford Harbor, CT » Calculate Datums: No Control Station
Calculate datums with NO control station. Then answer the questions below.
Question 1 of 2
Which method was used to calculate the datums?
The correct answer is a.
Question 2 of 2
When datums were computed with NO control station, what is the reported value for MSL?
The correct answer is b.
MSL = 1.311 m
Both the computation method and MSL datum are displayed in the screenshot of the TAD results page shown below.

If you did not get this result, compare your input screen to this screenshot of the correct one.
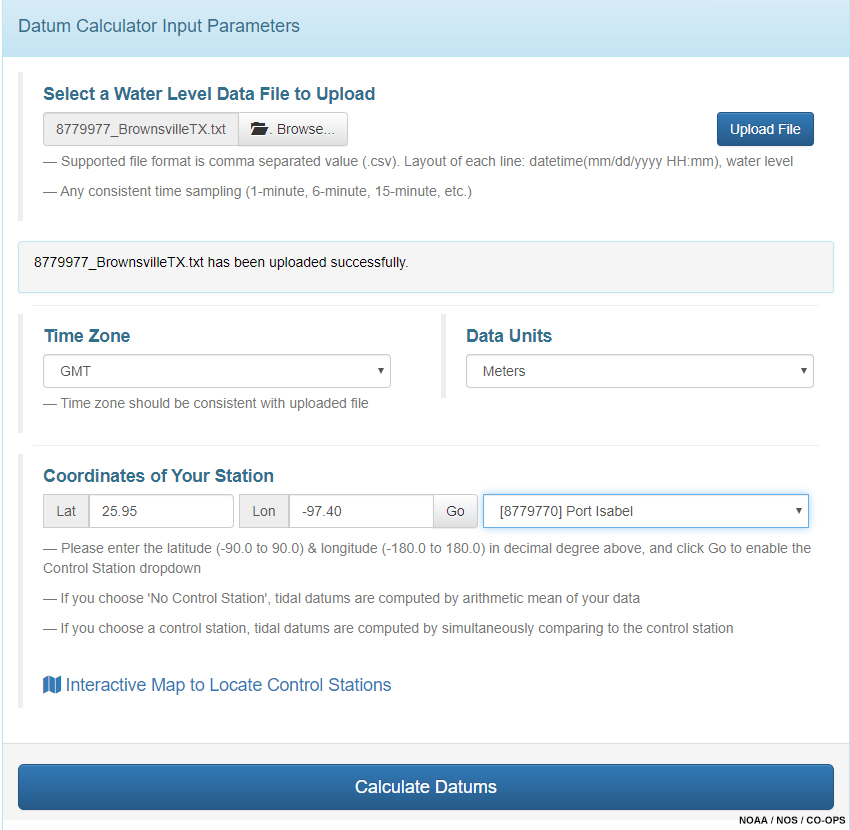
Exercise » Exercise 3: Brownsville, TX
Using the information below, open TAD and compute 2 sets of tidal datums for Brownsville, TX: one using the nearest control station (Port Isabel, TX) and another using no control station.
Note that the tidal datums calculator takes Lat/Lon coordinates in decimal degrees (e.g., 25.95). The positions given in the table above are in degrees and decimal minutes (e.g., 25° 57.1’). You will need to convert decimal minutes (e.g., 57.1’) to decimal degrees by dividing by 60 (57.1' / 60 = 0.95°). Then append that to the integer degree value (25). Thus 25° 57.1’ = 25.95°. So the value you enter in TAD is 25.95 (no degree symbol).
Also recall that N latitude and E longitude are positive. S latitude and W longitude are negative. Thus, 97° W is -97°.
NOAA Tidal Analysis Datums Calculator (TAD)
|
Location |
Brownsville, TX (8779977) |
|
Data File |
|
|
Time zone |
GMT |
|
Data Units |
meters |
|
Tide Type |
Diurnal |
|
Latitude |
25° 57.1’ N |
|
Longitude |
97° 24.1’ W |
|
Start |
7/1/2002 0:00 |
|
End |
7/31/2002 23:54 |
Exercise » Exercise 3: Brownsville, TX » Calculate Datums: With Control Station
Calculate tidal datums using the nearest control station. Then answer the questions below.
Question 1 of 2
Which method was used to calculate the datums?
The correct answer is b.
Question 2 of 2
Looking at your results, when datums were computed with a control station, what is the reported value for MSL?
The correct answer is a.
MSL = 0.243
Both the computation method and MSL datum are displayed in the screenshot of the TAD results page shown below.
If you did not get this result, compare your input screen to this screenshot of the correct one.
Exercise » Exercise 3: Brownsville, TX » Calculate Datums: No Control Station
Calculate tidal datums with NO control station. Then answer the questions below.
Question 1 of 2
Which method was used to calculate the datums?
The correct answer is a.
Question 2 of 2
Looking at your results, when datums were computed with NO control station, what is the reported value for MSL?
The correct answer is c.
MSL = 0.261
Both the computation method and MSL datum are displayed in the screenshot of the TAD results page shown below.
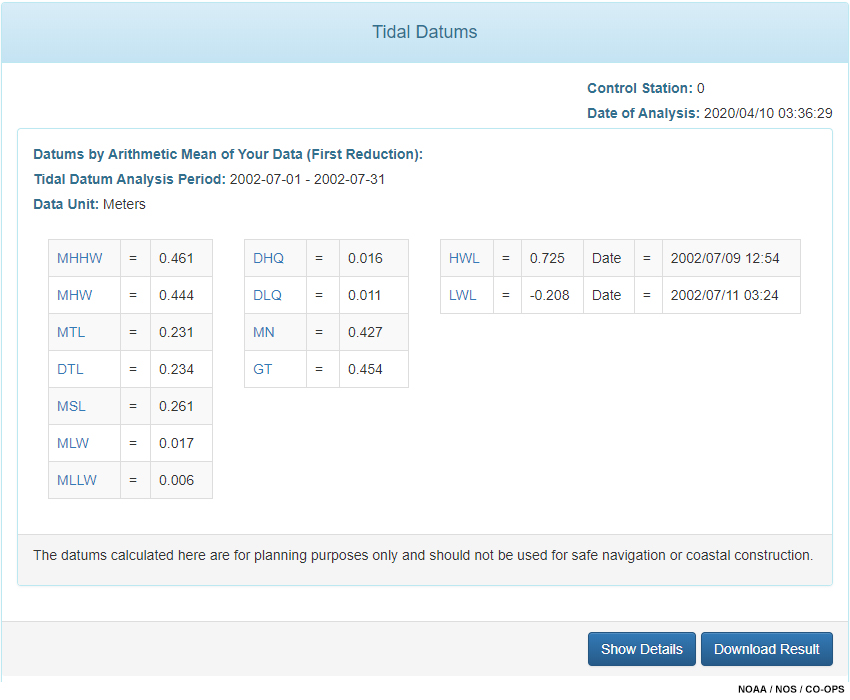
If you did not get this result, compare your input screen to this screenshot of the correct one.
Summary
The NOAA Tidal Analysis Datum Calculator (TAD) reads a time series of water level data and calculates several tidal datums. After reading a data file, TAD applies a low pass filter that smooths the data. Using the filtered data, TAD first picks the time of high and low tides. Using that time, TAD picks the water level from the observed unfiltered data.
TAD uses one of three methods of datum calculation:
- First reduction (FRED),
- Month mean simultaneous comparison (MMSC), or
- Tide by tide simultaneous comparison (TBYT).
If one chooses a control station, the tidal datums are tied to the NTDE, resulting in NTDE equivalent datums. If the record includes at least one full calendar month, then TAD employs MMSC. If the record does not include one full calendar month, then TAD employs TBYT.
If no control station is selected, the TAD-calculated tidal datums are not tied to the NTDE. TAD then determines tidal datums using FRED.
After entering the appropriate data and running TAD, the resulting datums are presented on the webpage. TAD generates several output files available for download, including the following:
- A spreadsheet of raw (observed) and filtered water levels
- A spreadsheet of TAD picks for higher high water (HH), high water (H), low water (L), and lower low water (LL).
- Monthly graphics of raw (observed) water levels with TAD picks, and
- A text file that summarizes the datum determinations, including monthly means (if any).
References
- NOAA CO-OPS Tidal Analysis Datum Calculator (TAD)
- TAD User Guide
- Tidal Datums definitions
- Tide Datums and Their Applications - NOAA Special Publication NOS CO-OPS 1
- Computational Techniques for Tidal Datums Handbook - NOAA Special Publication NOS CO-OPS 2
- A comparison of datums derived from CO-OPS verified data products and tidal analysis datum calculator - NOAA Technical Report NOS CO-OPS 085 (2017)
Appendix
How to format NOAA water level data for TAD
Download Data
- Go to https://tidesandcurrents.noaa.gov/
- In the “Search” box, enter the Station ID or location (e.g., Neah Bay, WA) of your potential control station.
- Click on the “pin” showing the station location on the map. A pop-up window with station information will appear.
- At the top of the pop-up, click “More Data,” then select “Water Levels”. A new page will open that shows the “Tides/Water Levels” tab.
- Below the graph, enter the date range you’re interested in comparing. Note that with this interface, data is limited to 31 days at a 6 minute interval and 365 days at a 1 hour interval.
- Next click the “Data Only” button. The graph will disappear and a table with water level data will appear below the station input values.
- Click the “Export to CSV” button above the upper right corner of the table. The selected data will download in a CSV file (comma separated values) with a filename like this: “CO-OPS_9443090_wl”, where the number (“9443090”) is the station ID.
Edit Water Level Data
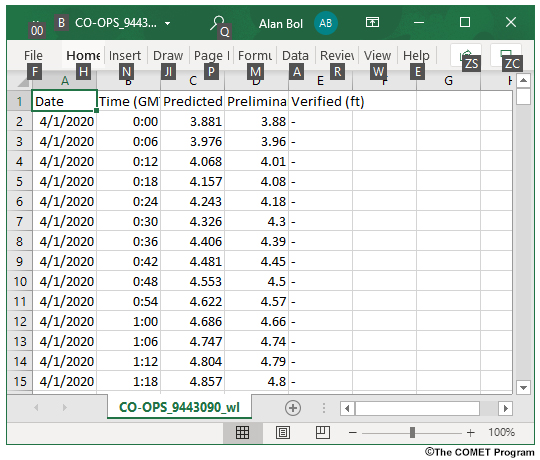
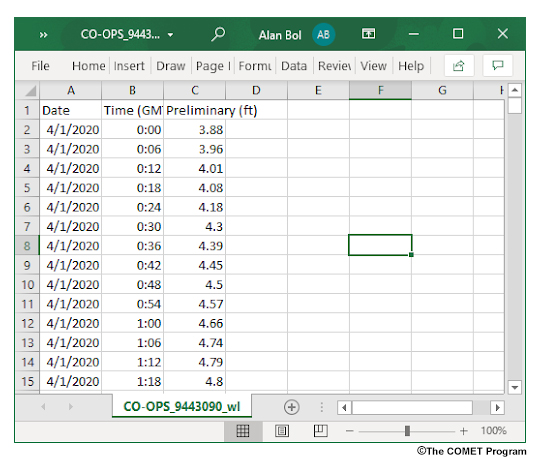
- Open the data file in a spreadsheet (e.g., Excel). The first column is Date, the second is time, then the 3rd, 4th, and 5th columns are water levels: Predicted, Preliminary, and Verified, respectively.
- You want to keep the Date and Time columns, and one column of water levels. In this case that will be Preliminary, but with older data, it will likely be Verified. If Verified is available, keep it and delete Preliminary. Otherwise, delete the Verified column.
- You can keep the first row with the column headings. Save the file.
- Your spreadsheet should now look like this:
- Close the spreadsheet.
Edit the Date/Time
- Open the CSV file in a text editor (e.g., Notepad).
You should see something like this:
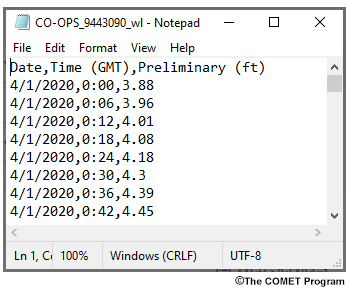
TAD requires a space between the Date and Time, not a comma.
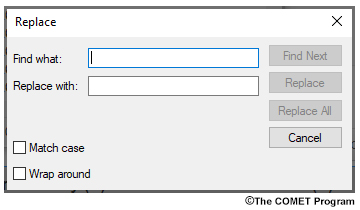
Under the “Edit” heading, select “Replace…”.
The window below appears (or something similar).
- In the “Find what” field, enter the year followed
by a comma.
In the “Replace with” field, enter the year followed by a space.
See example below.
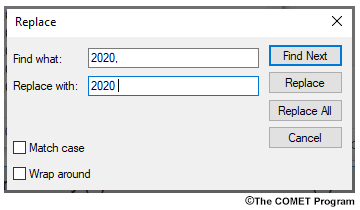
Click “Replace all”.
The file now looks like this: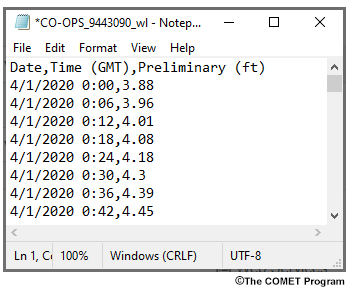
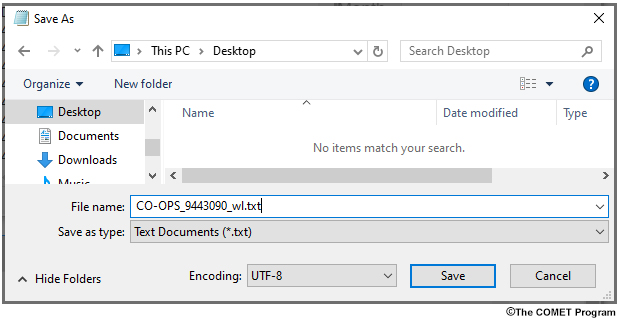
- Now click the heading “File” and select :Save as…”.
File name: Append “.txt” to the file name.
Save as type: Select “Text Documents (*.txt)”
Click “Save”.
- Your data file is now ready for entry into TAD.
Contributors
COMET Sponsors
MetEd and the COMET® Program are a part of the University Corporation for Atmospheric Research's (UCAR's) Community Programs (UCP) and are sponsored by
- NOAA's National Weather Service
(NWS)
with additional funding by: - Bureau of Meteorology of Australia (BoM)
- Bureau of Reclamation, United States Department of the Interior
- European Organisation for the Exploitation of Meteorological Satellites (EUMETSAT)
- Meteorological Service of Canada (MSC)
- NOAA National Environmental Satellite, Data and Information Service (NESDIS)
- NOAA's National Geodetic Survey (NGS)
- National Science Foundation (NSF)
- Naval Meteorology and Oceanography Command (NMOC)
- U.S. Army Corps of Engineers (USACE)
To learn more about us, please visit the COMET website.
Project Contributors
Project Lead and Instructional Design
- Alan Bol
Principal Science Advisors
- Audra Luscher - NOAA Center for Operational Oceanographic Products and Services (CO-OPS)
- Nina Garfield - NOAA Office of Coastal Management (OCM)
- Anna Hilting - NOAA National Centers for Coastal Ocean Science (NCCOS)
- Doug Marcy - NOAA OCM
- Michael Michalski - NOAA CO-OPS
- David Wolcott - NOAA CO-OPS
Program Oversight
- Alan Bol
Graphics/Animations
- Steve Deyo
Multimedia Authoring/Interface Design
- Tyler Winstead
COMET Staff, June 2020
Director's Office
- Dr. Elizabeth Mulvihill Page, Director
- Tim Alberta, Assistant Director Operations and IT
- Dr. Paul Kucera, Assistant Director International Programs
- Dr. Wendy Gram, Implementation Manager
Business Administration
- Lorrie Alberta, Administrator
- Auliya McCauley-Hartner, Administrative Assistant
- Tara Torres, Program Coordinator
IT Services
- Bob Bubon, Systems Administrator
- Joshua Hepp, Student Assistant
- Joey Rener, Software Engineer
- Malte Winkler, Software Engineer
Instructional Services
- Dr. Alan Bol, Instructional Designer/Scientist
- Tony Mancus, Instructional Designer
- Sarah Ross-Lazarov, Instructional Designer
- Tsvetomir Ross-Lazarov, Instructional Designer
International Programs
- David Russi, Translations Coordinator
- Martin Steinson, Project Manager
Production and Media Services
- Steve Deyo, Graphic and 3D Designer
- Dolores Kiessling, Software Engineer
- Gary Pacheco, Web Designer and Developer
- Tyler Winstead, Web Developer
Science Group
- Patrick Dills, Meteorologist
- Bryan Guarente, Instructional Designer/Meteorologist
- Adam Hirsch, Meteorologist
- Matthew Kelsch, Hydrometeorologist
- Andrea Smith, Meteorologist
- Amy Stevermer, Scientist/Instructional Designer
- Vanessa Vincente, Meteorologist