Copyright 2008-2019, University Corporation of Atmospheric
Research. All rights reserved.
Legal Notices
Legal Notices
I am Marianne König, EUMETSAT's scientific coordinator for the meteorological products extracted from the Meteosat Second Generation satellites, known as MSG. My background is in atmospheric physics. I have worked in satellite meteorology for 28 years - first on the European Meteosat programme at the European Space Agency and then, since 1995, on the Meteosat Second Generation series and its products at EUMESAT. My personal scientific interest is in nowcasting applications using meteorological satellite data. As part of my current responsibilities, I support EUMETSAT training activities, which helps me understand the needs and concerns of forecasters and other users.

Today's meteorological satellite data provide vast amounts of information that, when properly extracted, are used to quantify physical properties. We refer to this information as "derived meteorological products" or, more simply, "products."
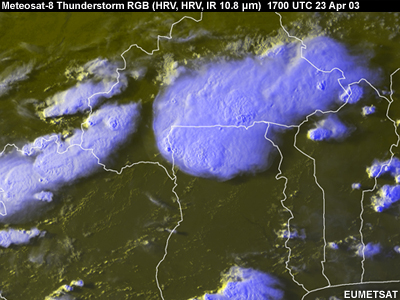
Products provide detailed descriptions of various atmospheric, ocean, and land features. Examples include volcanic ash and trace gases, thunderstorms, land and sea surface temperature, dust, and wildfire and smoke detection.
Products offer many benefits:
Each product focuses on a single parameter of interest to a particular user community, such as fire detection for fire managers.
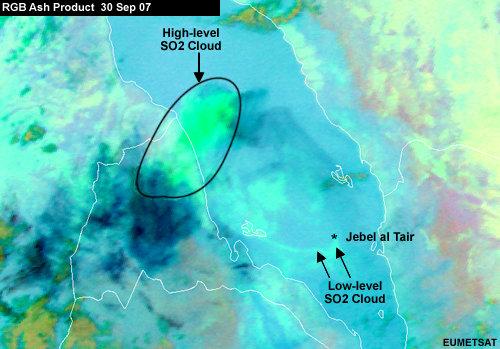
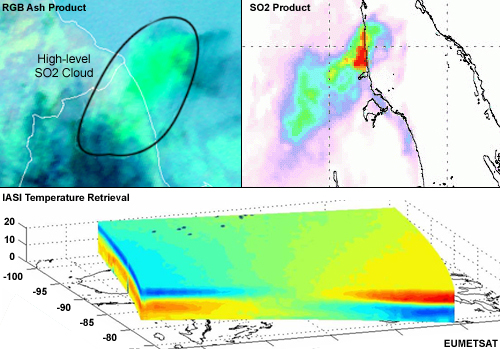
Relatively "simple" products highlight specific properties and are intended for visual interpretation; this RGB Ash Product shows conditions several hours after the eruption of the Jebel al Tair volcano in the Red Sea on 30 September 2007.
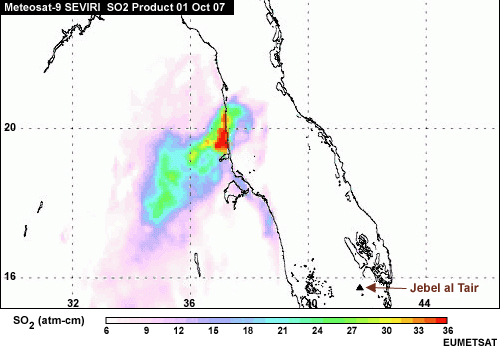
More advanced products quantify physical properties and produce parameters with quantified values. This corresponding SO2 product was derived for the morning after the volcano erupted, when the SO2 cloud had already drifted westward. The SO2 content is displayed in Dobson Units-a unit often used to describe the contents of a minor atmospheric gas.
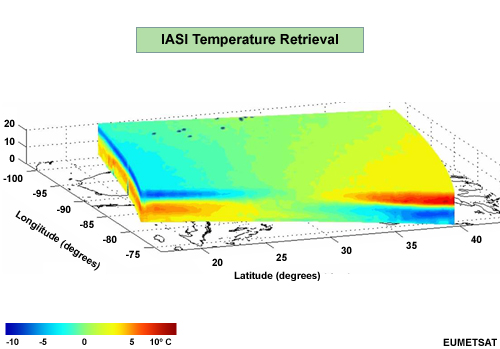
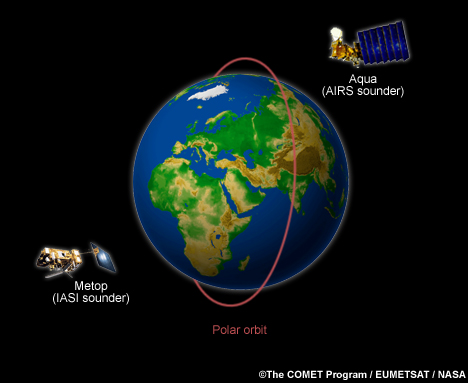
"Cutting edge" products, such as this 3-dimensional depiction of temperature retrievals from the IASI (Infrared Atmospheric Sounding Interferometer) instrument on the Metop polar-orbiting satellite, take advantage of the vast array of data from hyperspectral satellite-based sounding instruments with their thousands of channels. Imagine inspecting and interpreting the imagery from each channel individually!
Product generation can be an automated and objective process that does not depend on the knowledge or skill of a particular user. This flowchart depicts a general process for product generation.
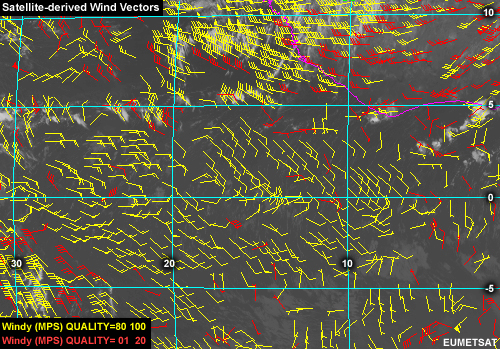
Products often have associated quality indices, error flags, or error estimates, which are helpful for forecasting in complex situations and critical for assimilating data into numerical weather prediction models.
In this satellite-derived wind product, vector quality is indicated by colour, with yellow vectors being of high quality and those in red of low quality. If you compare the red vectors to their neighbours, you'll notice large differences in wind speed and/or direction.
Products have limitations as well. For example, automated product retrievals are based on underlying assumptions, which might not apply to every situation.
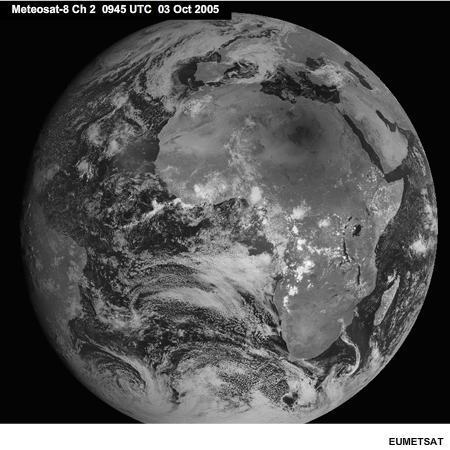
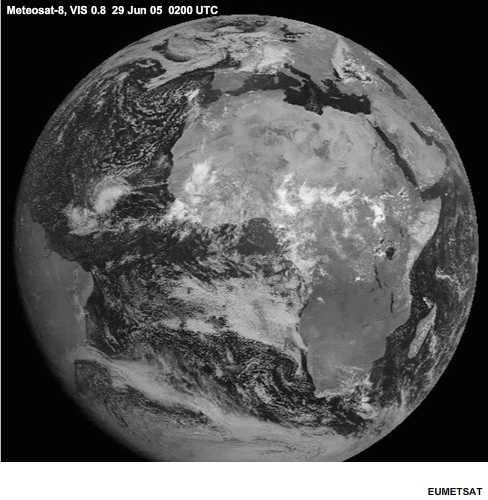
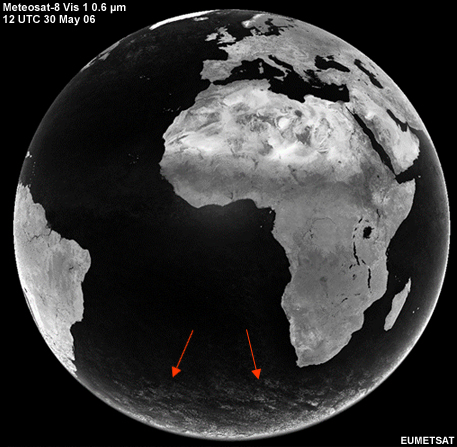
For example, we typically assume that dark spots on visible images, such as the one over the Sahara, are related to surface characteristics, such as vegetation or flooding. But both of these are very unlikely in the Sahara Desert!
View Animation
We're actually seeing the shadow of the moon during the solar eclipse of 03 October 2005. The animation shows how the shadow moved from west to east.
Products are constantly improving as developers incorporate more advanced mathematical techniques and computing methods, and as scientists gain a deeper understanding of the physical processes involved.
This Webcast presents an overview of how satellite data can be turned into products, including:
Simple image products that use channel differencing, RGB compositing, and other techniques to highlight specific properties
Quantitative products that use a variety of inputs and tools to produce single parameters with set values
More advanced products that use the thousands of channels on hyperspectral instruments to derive a variety of parameters
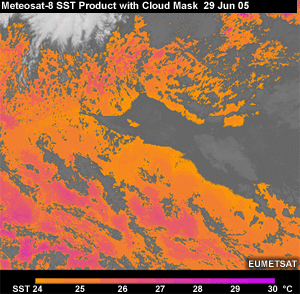
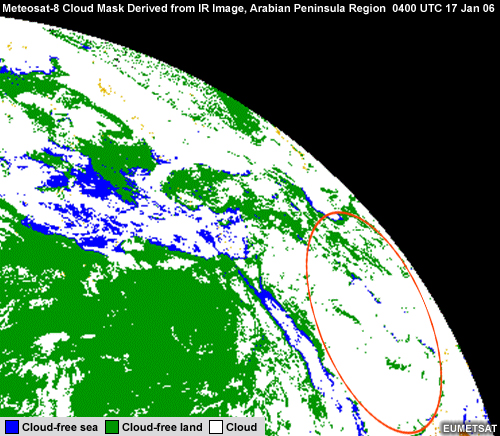
We will discuss how simple products are produced and then focus on the retrieval of derived or quantitative products using the example of the Meteosat cloud mask. Cloud masks indicate whether each pixel in a satellite image is cloud free or cloudy.
This is essential for being able to determine a pixel's properties, for example, its cloud type if it is cloudy or its surface type if it is cloud free.
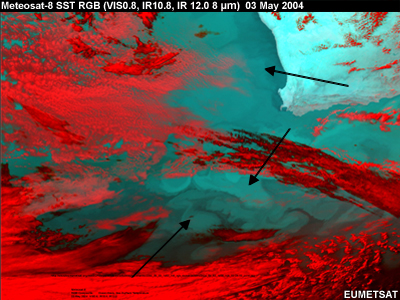
These sea surface temperature (or SST) products show the effects of proper cloud screening. This first product has proper screening, hence the realistic looking values and clouds indicated in shades of grey. The second product was derived without a pre-computed cloud mask. We see SSTs below about 20°C over southern portions of the tropical Atlantic, which probably do not represent actual SSTs, and SSTs below -2°C, which are simply not possible!
We will also examine sources of error in the final product caused by inaccuracies in the satellite data or retrieval process. Some of these errors are specific to a particular product, while others are shared by all product retrieval strategies.
It is assumed that users understand the fundamental interactions between radiation and matter that enable satellites to detect various elements and their properties within the earth-atmosphere system. This background information is essential for understanding the spectral signatures that occur throughout the spectrum, how they influence channel selection, and how channel selection ultimately relates to the retrieval of specific meteorological products.

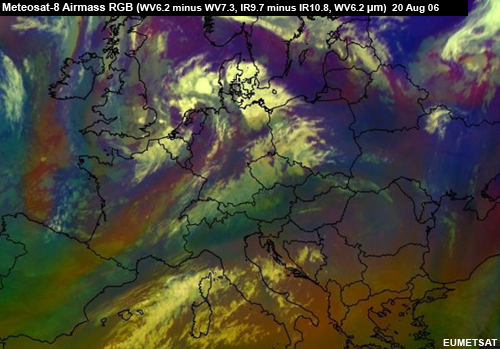
Many of the “simple” products that forecasters work with, such as this airmass product, are straightforward and relatively easy to produce. They are derived directly from the original image data using basic image manipulation techniques, such as channel differencing and RGB colour compositing. These can be accomplished with popular image or photography processing software. “Simple” products highlight specific properties and are intended for visual interpretation.
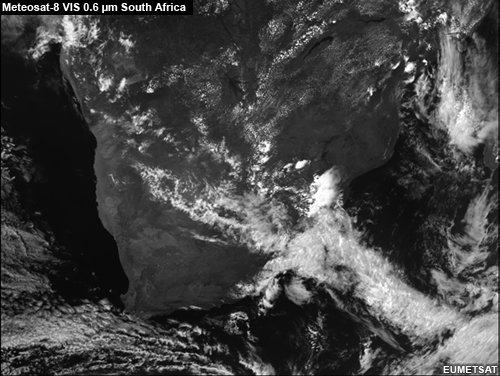
Let's look at one such example. In this visible 0.8 micrometre image over South Africa, it is easy to visually distinguish between land, sea, and clouds.
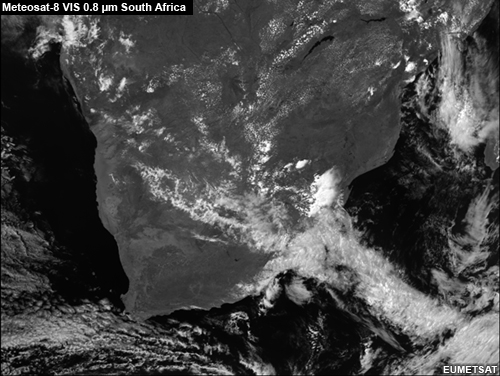
If we want to investigate the land surface in more detail, though, this single picture provides only limited information. It is better to combine it with another visible image taken at a different wavelength, such as 0.6 micrometres.
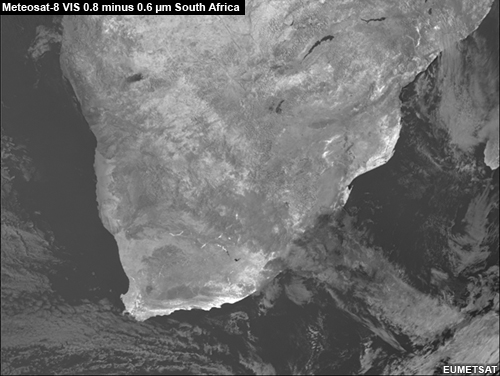
If we subtract the grey values representing the amounts of reflected sunlight in the two images, we get a simple vegetation product.
Land areas with green vegetation stand out as white or light grey.+
Although the difference image shows many land surface features, it does not provide much more information about clouds than we get by looking at the individual images. That's because of the small differences in cloud reflectances between the two visible channels.
Clouds are relatively bright reflective features in the visible images (first image) and darker greyish objects in the difference image (second image).
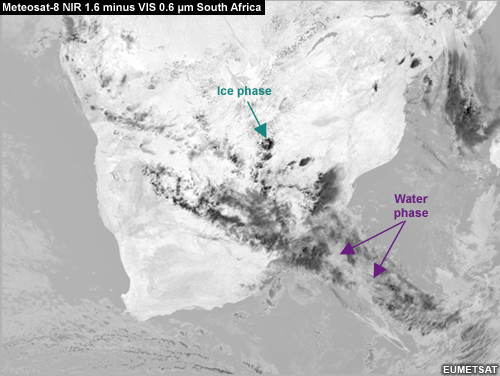
For a better qualitative cloud analysis, we'll introduce the near-infrared channel at 1.6 micrometres and take the difference between it and the 0.6 micrometre visible image.
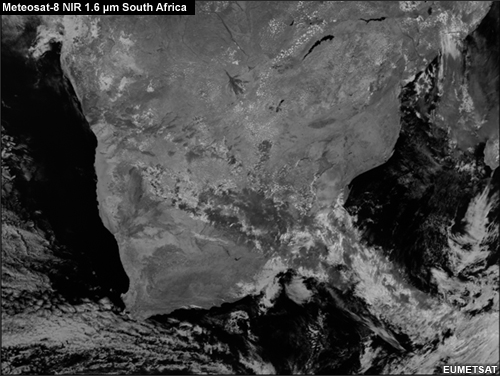
The resulting simple cloud phase product shows differences in cloud top reflectance related to cloud phase. We can distinguish between cloud tops in the ice phase (dark grey to black) and in the water phase (light grey).
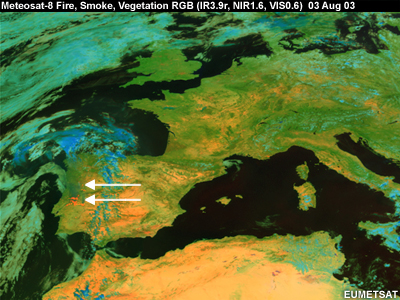
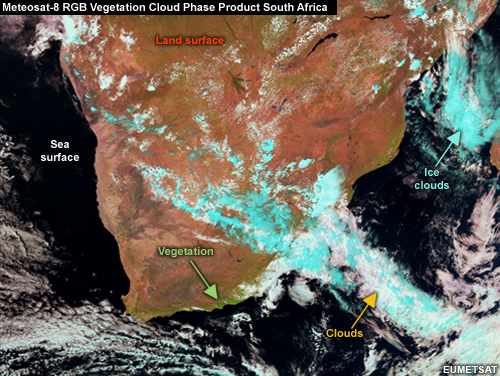
If we composite all three channels (two visible and one near-infrared) into an RGB image, we produce a simple combined “vegetation cloud phase” product. By assigning each channel to a respective red, green, and blue colour, we achieve an almost realistic looking product, where green indicates vegetation, brown/reds indicate other types of land surface, the sea surface is dark, and clouds are white. Only the ice clouds stand out (unrealistically) in cyan.
If we expand the channels used for making basic products to include the longwave infrared, which is sensitive to different thermal properties, we are able to detect features such as:
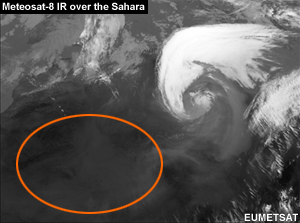
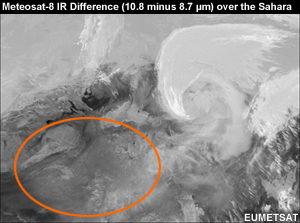
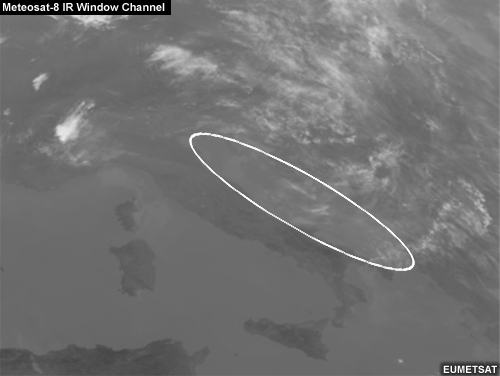
The surface structures of deserts; this single infrared window channel image shows the northern Sahara as a homogenous hot surface whereas the difference image of two IR channels (10.8 minus 8.7 micrometres) shows more detailed surface structures because of the sensitivity of the 8.7 micrometre channel to different soil types
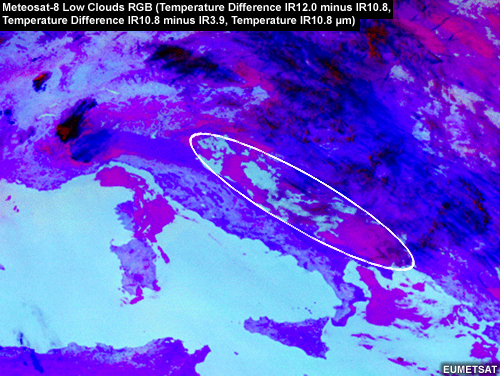
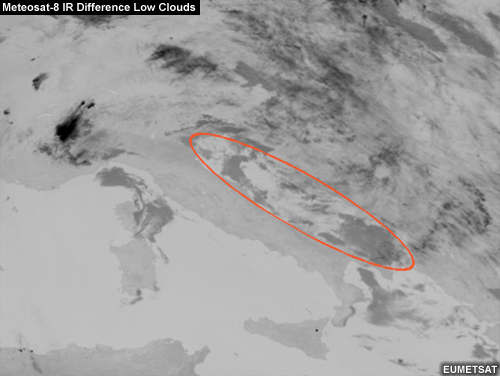
Low clouds at night; while they are not apparent in this single longwave infrared window channel, they appear as purple in the RGB composite of three infrared channels (second image), and as darker grey structures in the infrared difference product (third image).
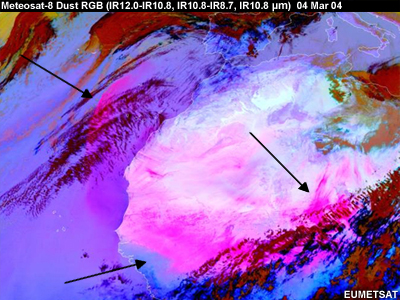
Dust storms; a large dust storm over Algeria appears magenta in this RGB combination
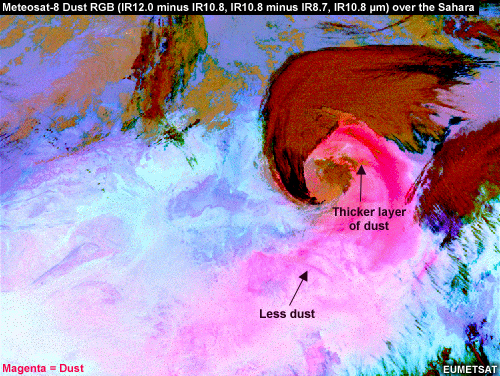
In the dust RGB product on the previous page, we can visually distinguish between areas of thicker and thinner dust layers. But it is impossible to infer the exact dust load in terms of kg/m3. For that, we need a derived product, which quantifies a physical property and produces a parameter with set values.
Derived products require more advanced retrieval methods and techniques to handle a variety of data inputs. These often come from sources other than just meteorological satellites, such as numerical weather prediction models, physical models such as radiative transfer models, in situ observations, and climatological data sets.
The inputs require more advanced retrieval methods and tools to handle them, such as thresholding techniques, decision trees, statistical algorithms, and physical models.
In the next section, we will examine an example of a quantitative product, namely the operational implementation of the Meteosat cloud mask product, which is similar to cloud masks for other imaging instruments.
By stepping through the retrieval process, you will learn about some of the general strategies that can be used for product extraction. You will also learn about the importance of the underlying image data and other ancillary inputs. Note, though, that every product has its own derivation process complete with its own set of inputs, tools, and underlying assumptions. The detailed description of the cloud mask product merely serves as a guide to illustrate general principles and considerations used in the generation of derived products from satellite observations.
One of the first steps in retrieving many satellite products is to apply a cloud mask product, which indicates whether each pixel contains clouds or is cloud free. Good cloud detection is extremely important since clouds obscure the surface view in all solar and thermal spectral channels.
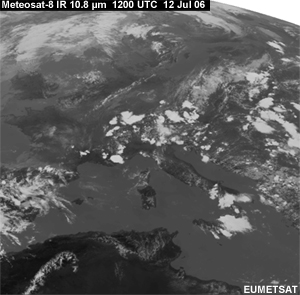
We see that in this first example. Clouds largely obscure the Alps, making it difficult to distinguish between snow cover and cloud cover.
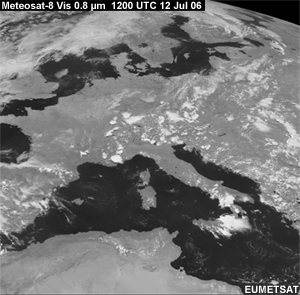
The same mountains appear relatively cloud free in the second image, although it is still hard to determine whether the nearby bright white areas are cloud or snow cover. These examples highlight the need for a cloud mask in order to estimate alpine snow coverage. Although the cloud mask product itself is not used much in operational forecasting, it is the basis for many other products.
Surface-related products, such as sea and land surface temperature, vegetation cover, snow cover, and wildfire detection, can only be inferred for pixels where the surface is not obscured by clouds.
View Animation
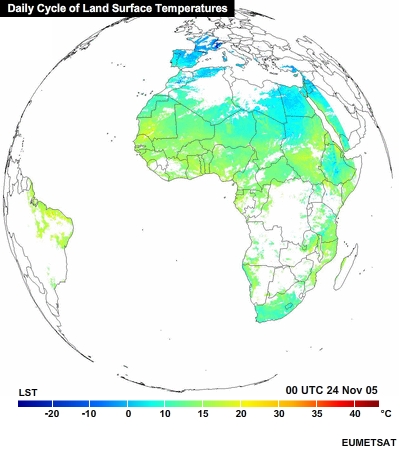
You can see the benefits of applying a cloud mask in this product, which shows land surface temperatures for cloud-free surfaces over the course of a day.
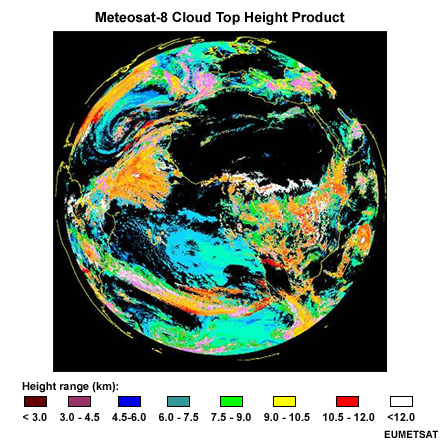
Conversely, cloud products can only be inferred for pixels identified as cloudy. In this example, a cloud mask identified cloudy pixels, and subsequent processing generated a cloud top height product.
Some cloud masks, such as the Meteosat product, are derived from conventional visible and infrared imagery and use a so-called thresholding technique that identifies pixels as cloudy or cloud-free.
This technique is similar to the one that meteorologists use when visually inspecting single channel images for cloud cover. They look for relatively cold features (groups of pixels) in infrared images and bright features in visible images.
Likewise, the thresholding technique tries to detect features that are colder than expected for clear sky conditions in infrared imagery and then detects features that are brighter than expected for a given region and clear sky conditions using visible imagery.
The actual choice of threshold (cut-off value for a cloudy vs. cloud-free scene) comes from years of experience, testing, and comparisons with image data. Thresholding techniques are usually highly tuned algorithms where a certain set of thresholds may only be applicable to a particular instrument, region, or set of conditions.
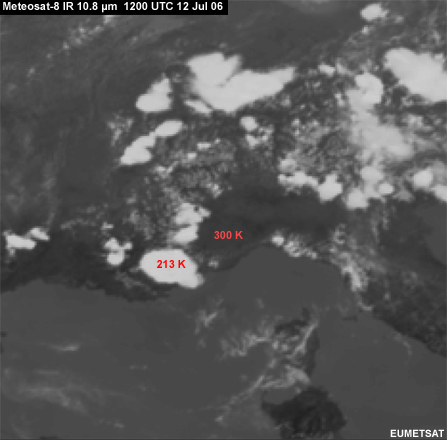
In this close-up infrared image, we have a clear sky IR brightness temperature of 300 K and a cloud top temperature of 213 K (an 87 K difference). Since this difference exceeds the threshold (for example, 5 K), the pixel is identified as cloud.
About brightness temperature (BT):
Satellites observe energy emitted by the earth-atmosphere system as digital counts. They are typically used for generating imagery for qualitative analyses, such as infrared and visible imagery. To generate quantitative products or compare satellite observations to other observations and model output, etc., we need a calibration process that converts the counts to a physical quantity, such as a radiance or brightness temperature.
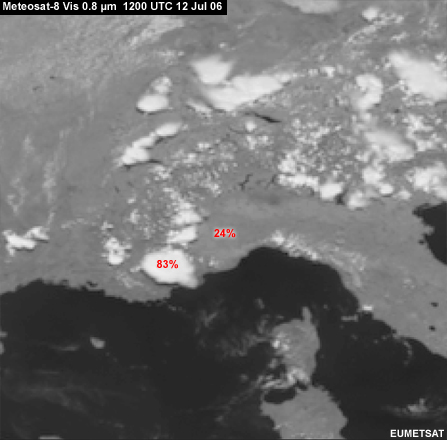
In this visible example, the clear sky visible reflectance was determined to be 24%, the cloud top reflectance 83%. Given such a large difference, the thresholding technique determined that the 83% reflectance was cloud and labelled those pixels as cloudy.
Infrared clear sky brightness temperatures are generated by a radiative transfer model (or RTM), which simulates the brightness temperature that the satellite would observe for cloud-free conditions. The automated thresholding technique compares satellite measurements to RTM values. If the measurement is much colder than expected, it is identified as cloud.
Note that for the infrared thresholding technique, an infrared window channel is used, such as the 10.8 micrometre channel onboard Meteosat. An infrared window is a region of the spectrum where absorption by atmospheric gases is minimal, meaning that views of the cloud-free surface and clouds at various levels are not significantly affected by atmospheric gases such as water vapour.
Radiative transfer models are an important tool for many product retrieval strategies. Such models simulate the radiative transfer processes of the atmosphere at a given wavelength or spectral region for a given set of surface and atmospheric conditions. The radiative transfer model is thus used as a tool to compute an expected brightness temperature for cloud-free conditions.
To get a close match between the RTM result and measured infrared brightness temperatures, we need as realistic an estimate of the surface temperature as possible. For the Meteosat cloud masking process, this estimate is derived from numerical model output.
Land surfaces undergo large diurnal cycles in their skin temperature, which numerical weather prediction models often do not accurately resolve. This can create a fairly large mismatch between the observed and modelled brightness temperatures, which can, in turn, lead to either a missed detection (if the modelled brightness temperature is too cold) or false cloud detection (if the modelled brightness temperature is too warm).
Since SSTs are far less variable, we can expect a better performance of the infrared thresholding technique over open water.
The animations show IR 10.8 micrometre brightness temperatures over specific (cloud-free) locations. Notice the large diurnal cycle over land but not sea. We will look at additional examples on the following pages.
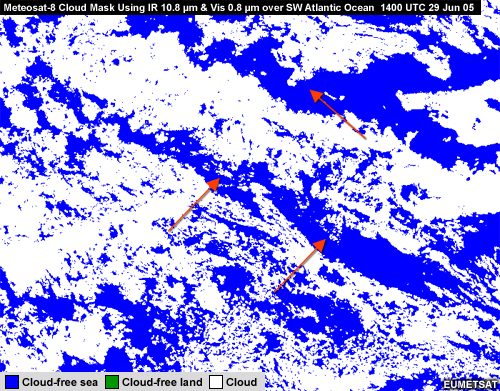
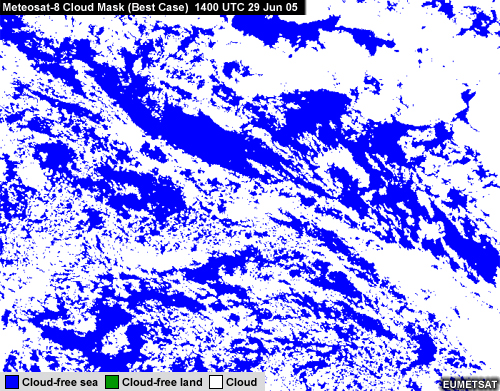
Here is an infrared window image over part of the South Atlantic Ocean. Through visual inspection, we see high cold clouds in the south and broken stratocumulus in the rest of the image.
The cloud mask appears to reproduce the cloud patterns fairly well. It was produced by applying a carefully crafted threshold temperature of 2 K.
This overlay shows the RTM simulated infrared brightness temperatures for this case, which are used in the infrared thresholding. Certain sections of the image are much colder (brighter) due to the presence of clouds.
The principle of infrared-based cloud detection over land is very similar to that over ocean. Only the threshold value needs to be adjusted since land surface skin temperatures vary more spatially and temporally, and may not be as accurately depicted or forecasted by NWP models. This additional complexity means that thresholds over land may be set larger than those over ocean, resulting in a missed detection of some cloud cover.
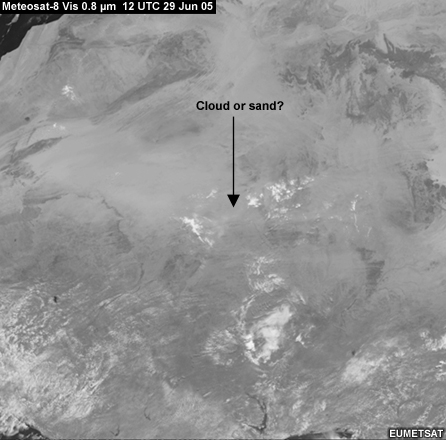
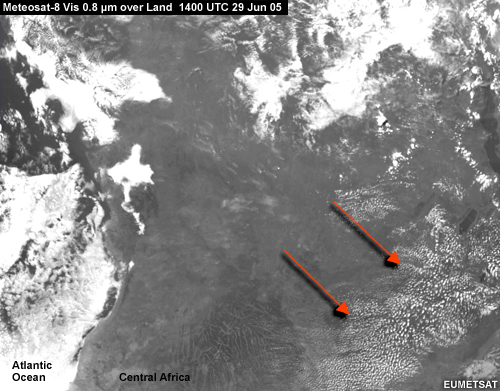
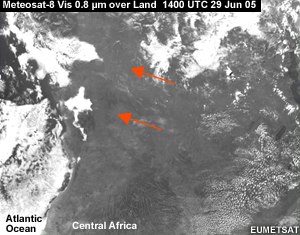
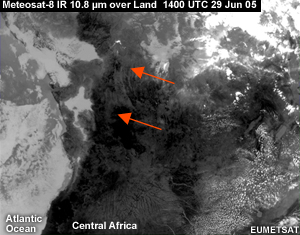
In this scene over central Africa taken near midday, very moist tropical air in the south contrasts with the dryer Sahara region in the northern part of the image. Visually, it is very difficult to differentiate the low clouds and thin cirrus from the cloud-free surroundings because of the infrared channel's sensitivity to abundant low-level moisture.
The low-level moisture absorbs some of the surface radiation at 10.8 micrometres and reemits the radiation at a cooler temperature, giving the appearance of a cooler surface than what we would expect. Accurate representations of the moist air mass by forecast models are especially invaluable in this type of situation since they provide the radiative transfer model with the atmospheric conditions needed for an accurate simulation of the brightness temperatures that the satellite would observe.
We have seen that cloud identification is a fairly straightforward matter in the infrared as long as the cloud features appear colder than the expected temperature of a cloud-free land or sea surface.
With the addition of visible data, we can identify clouds as features that are brighter than they would appear in a cloud-free image, which provides us with a technique for complementing the infrared method in problem areas.
The challenge for discriminating cloud from ground in visible data is to quantify the appropriate visible brightness for a cloud-free scene. Actual surface brightness or reflectance depends upon the surface type and actual solar illumination, which changes by time of day and season.
The expected reflectance can be easily inferred for water surfaces, where the reflectance is generally very low except under sun glint conditions and is easily predictable for any sun-satellite viewing geometry.
View Animation
The situation is more complicated over land due to variable reflectances, including sun glint over rivers and lakes, and land surfaces, such as desert sand, salt, and certain types of rock that can appear almost as bright as cloud cover.
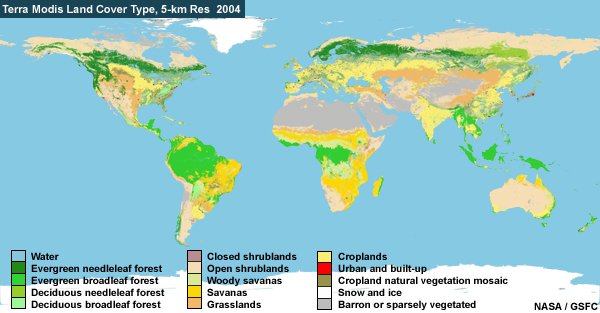
Using background data from climatological datasets, such as land surface type maps, makes it possible to compensate for these problems. Average visible reflectances can be assigned according to land surface type.
Another option for generating a cloud-free visible background is to use satellite data as a starting point. Careful filtering of the data collected over a specific location over a period of time will result in a cloud-free visible image, which can then be used as the background surface information.
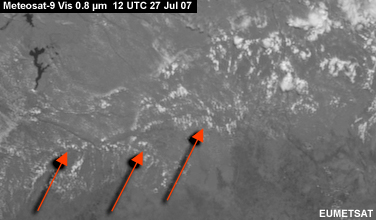
Shown here is the Meteosat Visible 0.8 micrometre channel surface reflectance for 1200 UTC as a filtered value over the month of May in 2006. Each pixel represents an average of all cloud-free observations identified during the period.
Quite noticeable are the non-homogeneous features in the southern portion of the image. The patchy white cloud-like patterns are the result of areas that were pretty much cloud covered throughout the entire month and, even more importantly, experienced very little solar illumination typical during that time of year.
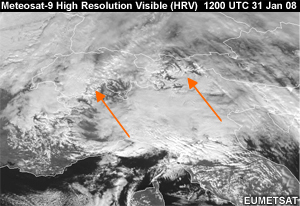
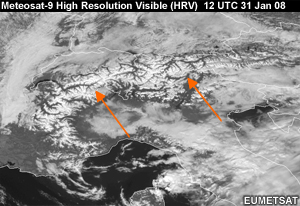
With its higher spatial resolution, the Meteosat Second Generation (MSG) visible channel also helps to improve the detection of clouds, particularly smaller cumuliform clouds.
Notice how many more clouds are detected in the infrared and visible-based cloud mask (first image) than in the infrared-only mask (second image).
![]()
![]()
Now let's look at an example over the ocean. The low clouds in this infrared image appear similar in temperature to the underlying sea surface, meaning that the thresholding technique may not detect all of the cloud cover.
Looking at the corresponding visible image, notice how the clouds stand out from the darker ocean background.
When we compare the infrared- and infrared/visible-based cloud masks, we see how the addition of visible information has led to significant improvement in the detection of cloud cover.
Based on the two previous examples, we know that the impact of using visible information is greater over ocean than land. During daytime over land, the warm surface normally contrasts better with the cooler cloud top temperatures, which enables the infrared cloud mask to capture most cloud features.
In addition to thresholding, other information and techniques can be used to help with cloud detection, such as spatial analyses. Visible reflectances or infrared brightness temperatures that show large differences over small scales may indicate scenes with scattered cloud cover.
A temporal analysis can also aid in cloud detection for geostationary satellites given their high repeat cycles. Bright or cold pixels that are relatively stationary over time are more likely to be snow-covered surfaces than clouds.

In looking at this single image of the Alps, can you determine if the highlighted area is small cumuli or stationary snow fields?
The time series makes it obvious that we are looking at snow fields.
The cloud mask product is based on the combination of satellite observations, simulated infrared brightness temperatures for a cloud-free surface, and visible reflectance of a cloud-free background.
While this strategy generally yields good results, there are some areas of concern that can lead to error. In this section, we will examine various sources of error. Some are specific to the retrieval of the cloud mask product while others impact all products.
Product errors can result from inaccuracies in the satellite data caused by, for example:
Calibration errors, which impact the accuracy of infrared brightness temperature values. The top image is a cloud mask based on correctly calibrated infrared brightness temperatures, the second based on brightness temperatures that are 1 K too cold. Although the effect is not very large, the apparent cloud coverage in the cloud mask product does increase for cases where brightness temperatures are too cold. When brightness temperatures are too warm, we capture less than expected cloud coverage, since we expect most clouds to appear colder than the underlying surface. If the error is not corrected during the calibration process, the product can still be optimised by tuning the infrared cloud threshold itself.
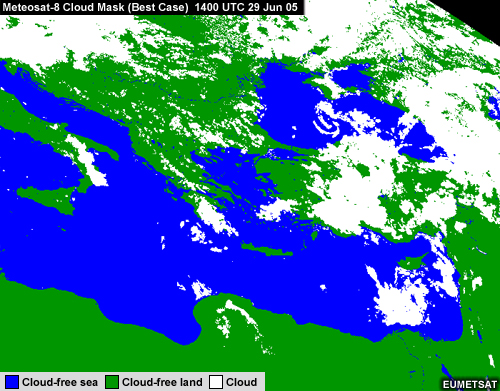
Problems with image navigation. Correct navigation means that the geographic location of a given pixel (its geolocation) is correctly assigned. All product retrieval processes that depend on surface characterisation (surface type or land vs. ocean, etc.) can suffer from even small errors in pixel navigation. This example shows a correct cloud mask over the eastern Mediterranean.
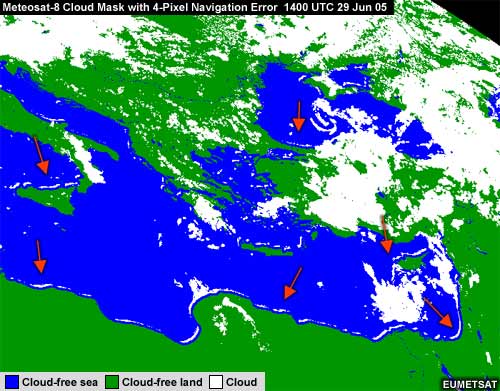
This example has a navigation error of about 12 km. Notice the unrealistic thin line of cloud cover that follows many of the coastlines.
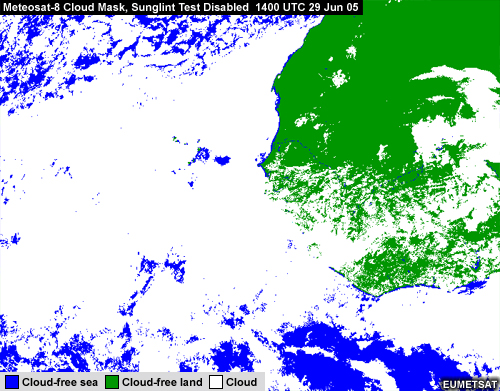
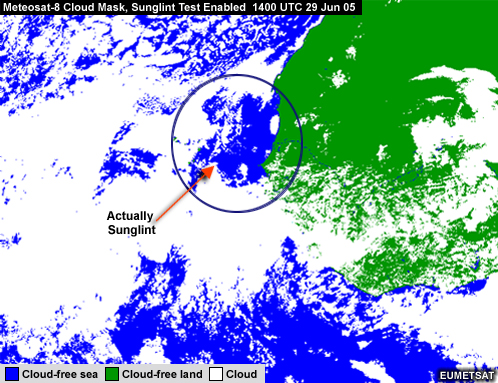
Sun glint in the visible spectral range. Sun glint occurs when the satellite instrument observes the direct reflection of sunlight from bodies of water. If not accounted for, the brighter than expected sea surface is often classified as cloud cover.
View Animation
This example shows the ocean off the African coast as almost completely cloud covered in the product when, in fact, the highlighted area was affected by afternoon sunglint.
Product errors can also result from problems and inherent deficiencies in the retrieval process, such as inaccuracies and uncertainties in meteorological analyses, forecast data, and other ancillary data sets.
As we've seen, land and sea surface temperatures from NWP models are vital inputs to the derivation of a cloud mask. A misrepresentation of the diurnal cycle has direct impacts on product quality. This example shows desert regions just before sunrise when the land surface is coldest.
Cloud masks obtained from geostationary satellites often show a false cloud pattern during night-time and early morning because of a warm bias in the model surface temperature. The product could be improved by using a more realistic daily cycle of land surface temperatures in the radiative transfer calculations.
Another source of error involves low clouds that can appear warmer than the underlying surface. This can occur with low-level temperature inversions, during night-time, and during winter in middle- and high-latitude regions.
The channel thresholding technique shown for the cloud mask product is also used for other types of scene identification.
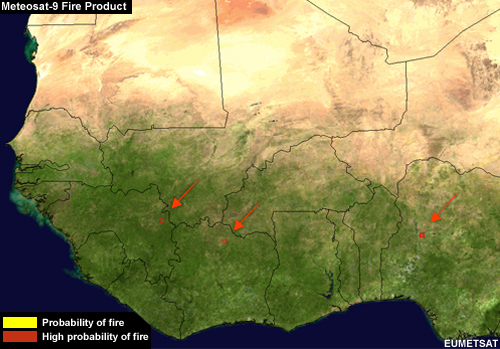
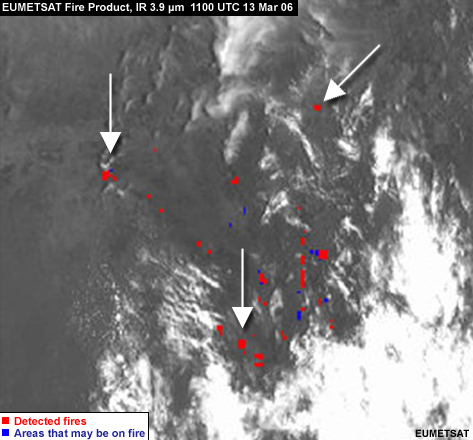
The detection of active wildfires works by using a combination of observed brightness temperatures in the infrared window region around 11 micrometres and in the shortwave infrared window region around 3.8 micrometres, which is very sensitive to hot spots within a pixel.
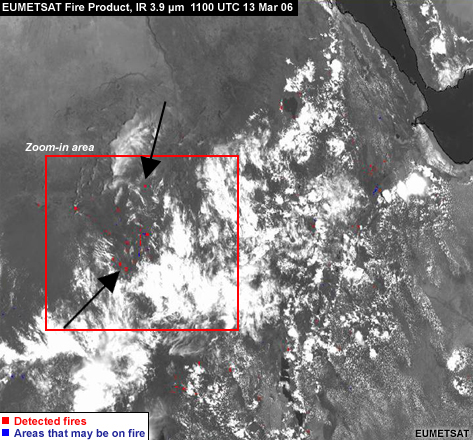
Hot spots and fires are isolated first by differencing the two channels and then highlighting pixels with difference values beyond a prescribed threshold where the likelihood of fire is high.
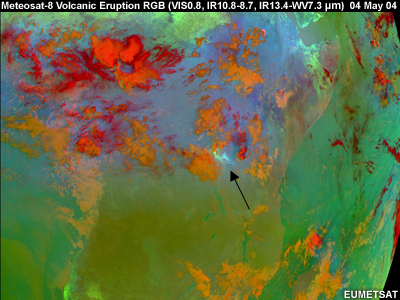
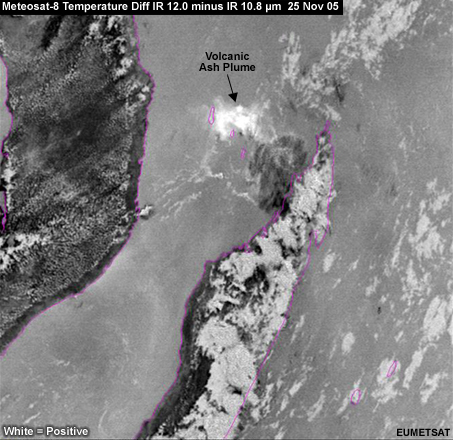
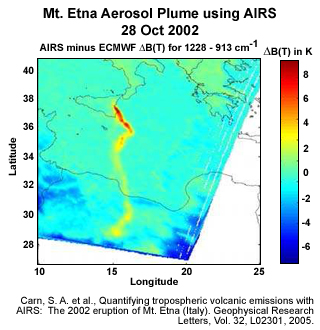
The detection of volcanic ash plumes also uses a channel thresholding approach.
The spectral signature of volcanic ash within the infrared window region at 10 to 12 micrometres is different from the spectral signature of both water and ice clouds, so the volcanic ash plume can be readily detected.
Thresholding can be used to help highlight and separate the brightness temperature differences typically seen with volcanic ash plumes from the differences normally seen with water and ice clouds and features on the ground.
This example shows the result of the channel differencing in terms of a visual product.
A number of modern satellite instruments have moved away from traditional imagers and sounders to so-called hyperspectral instruments that have thousands of channels. A more traditional imaging instrument may average the incoming radiance over a fairly wide spectral range or band, while hyperspectral data have much finer spectral resolution.
The most prominent hyperspectral instruments are the AIRS sounder on board the EOS Aqua satellite, which samples the infrared spectrum in a total of 2378 channels, and the IASI sounder onboard Metop, which samples a total of 8461 channels.
Compare a typical atmospheric spectrum as measured by IASI with that of a much broader filter on an imaging instrument, such as MSG SEVIRI (Spinning Enhanced Visible and Infrared Imager). The graphic shows how much detailed spectral information is averaged into one measurement on SEVIRI. (Compare the broad shaded bands to the detailed information in the red lines).
The profiling of atmospheric temperature and gases, such as water vapour, represents the most common operational implementation of hyperspectral data collection from meteorological satellites today.
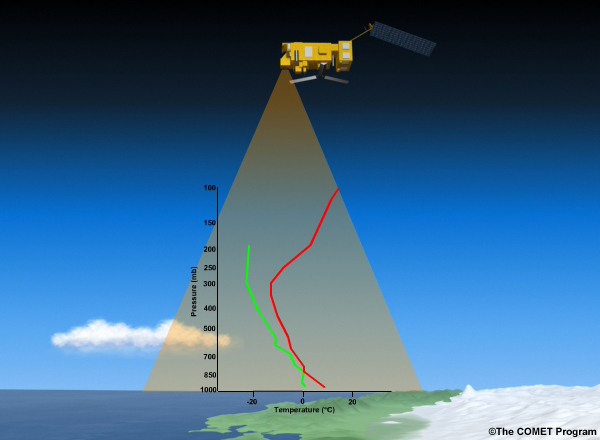
Compared to traditional sounders, hyperspectral sounders can better resolve the vertical structure of temperature and humidity by providing a greater number of channels at higher spectral resolution. This enables them to sense more atmospheric layers at discrete levels, that is, layers with less overlap.
Here we see the weighting functions of the AMSU microwave sounding instrument, which are relatively broad and overlap with one another. Recall that a weighting function defines the relative contributions to the outgoing radiance from various levels of the atmosphere and therefore determines the layer of the atmosphere sensed for a given spectral channel.
With the thousands of channels on hyperspectral sounders, we now get a multitude of weighting functions. This means that the atmosphere is probed over a larger number of thinner layers, which, in turn, allows for greater vertical resolution.
Even more sophisticated data processing strategies and more detailed radiative transfer models are needed to convert the additional spectral information into useful products. Examples include trace gases, the characterisation of aerosols,
cloud detection and characterisation (phase and particle size distribution),
and higher resolution temperature and moisture profiles.
Note that the more detailed information from hyperspectral instruments enables us to derive more information based on direct satellite observation. It also limits our dependence on ancillary data, such as model approximations, whose errors contribute to uncertainty in the derived product.
Satellite products provide detailed descriptions of various atmospheric, ocean, and land features.
Benefits of satellite products:
Focus on a single parameter of interest to a particular user community
Relatively “simple” products highlight specific properties and are intended for visual interpretation
More advanced products quantify physical properties and produce parameters with quantified values
“Cutting edge” products take advantage of the vast array of data from hyperspectral satellite-based sounding instruments with their thousands of channels
Product generation can be an automated and objective process that does not depend on the knowledge or skill of a particular user
Products often have associated quality indices, error flags, or error estimates, which are helpful for forecasting in complex situations and critical for assimilating data into numerical weather prediction models
Relatively “simple” products:
Straightforward and relatively easy to produce
Derived directly from the original image data using basic image manipulation techniques, such as channel differencing and RGB colour compositing, which can be accomplished with popular image or photography processing software
Highlight specific properties
Intended for visual interpretation
More advanced and ‘cutting edge’ products:
Require more advanced retrieval methods and techniques to handle a variety of data inputs, which often come from sources other than just meteorological satellites, such as NWP models, physical models such as radiative transfer models, in situ observations, and climatological data sets, etc.
Inputs require more advanced retrieval methods and tools, such as thresholding techniques, decision trees, statistical algorithms, and physical models
Meteosat cloud mask product:
Indicates whether each pixel contains clouds or is cloud-free
Is the basis for many other products
Thresholding technique:
Detects features (groups of pixels) that are colder than expected for clear sky conditions in IR imagery and brighter than expected for a given region and clear sky conditions in VIS imagery
Choice of threshold (cut-off value for cloudy vs. cloud-free scene) comes from experience, testing, and comparisons with image data
May only apply to a particular instrument, region, or set of conditions
Used for generating cloud masks and detecting active wildfires and volcanic ash plumes, etc.
Radiative transfer models:
Are an important tool for many product retrieval strategies
Simulate the radiative transfer processes of the atmosphere at a given wavelength or spectral region for a given set of surface and atmospheric conditions
Used to compute an expected brightness temperature for cloud-free conditions
The RT model result depends on the surface temperature computed by NWP models, which often do not correctly resolve the large diurnal cycles of land surface temperature
Can be augmented by using background data from climatological datasets or the satellite data itself
Sources of product error:
Inaccuracies in the satellite data caused by:
Calibration errors, which impact the accuracy of the calculated brightness temperatures
Problems with image navigation whereby a pixel’s geographic location (its “geolocation”) is incorrectly assigned
Sun glint in the visible spectral range, which can lead to a brighter than expected sea surface that may be classified as cloud cover
Problems in the retrieval process caused by:
Problems and inherent deficiencies in the retrieval process, such as inaccuracies and uncertainties in meteorological analyses, forecast data, and other ancillary data sets
Hyperspectral instruments:
Have thousands of channels at higher spectral resolution
Can sense more atmospheric layers in increasingly discrete levels (layers with less overlap)
Are used operationally to profile atmospheric temperature and gases, such as water vapour
Require more sophisticated data processing strategies and more detailed radiative transfer models
Enable us to derive more information based on direct satellite observation and limit our dependence on ancillary data whose errors contribute to uncertainty in the derived product
General process for generating meteorological products
Process for generating a cloud mask product
The COMET® Program is sponsored by NOAA National Weather Service (NWS), with additional funding by:
Project Sponsors
European Organisation for the Exploitation of Meteorological Satellites (EUMETSAT)
COMET Sponsors
Air Force Weather Agency (AFWA)
Australian Bureau of Meteorology (BoM)
Meteorological Service of Canada (MSC)
National Environmental Education Foundation (NEEF)
National Polar-orbiting Operational Environmental Satellite System (NPOESS)
NOAA National Environmental Satellite, Data and Information Service (NESDIS)
Naval Meteorology and Oceanography Command (NMOC)
Principal Science Advisor
Dr. Marianne König — EUMETSAT
Associate Science Advisors
Patrick Dills — UCAR/COMET
Dr. Volker Gärtner — EUMETSAT
Dr. Jochen Kerkmann — EUMETSAT
Dr. Hans-Joachim Lutz — EUMETSAT
Philip Watts — EUMETSAT
Dr. Dieter Klaes — EUMETSAT
Project Lead
Marianne Weingroff — UCAR/COMET
Instructional Design
Marianne Weingroff — UCAR/COMET
Computer Graphics/Interface Design
Steve Deyo — UCAR/COMET
Brannan McGill — UCAR/COMET
Marianne Weingroff — UCAR/COMET
Multimedia Authoring
Carl Whitehurst — UCAR/COMET
Audio Editing/Production
Seth Lamos — UCAR/COMET
Audio Narration
Dr. Marianne König — EUMETSAT
COMET Staff
Director
Dr. Timothy Spangler
Deputy Director
Dr. Joe Lamos
Business Manager/Supervisor of Administration
Elizabeth Lessard
Administration
Lorrie Alberta
Michelle Harrison
Hildy Kane
Graphics/Media Production
Steve Deyo
Seth Lamos
Brennan McGill
Hardware/Software Support and Programming
Tim Alberta (Supervisor)
James Hamm
Ken Kim
Mark Mulholland
Wade Pentz (Student)
Dan Riter
Carl Whitehurst
Malte Winkler
Instructional Design
Dr. Patrick Parrish (Supervisor)
Dr. Alan Bol
Lon Goldstein
Bryan Guarente
Dr. Vickie Johnson
Bruce Muller
Dwight Owens (Alphapure Design Studio)
Marianne Weingroff
Meteorologists
Dr. Greg Byrd (Project Cluster Manager)
Wendy Schreiber-Abshire (Project Cluster Manager)
Dr. William Bua
Patrick Dills
Dr. Stephen Jascourt
Matthew Kelsch
Dolores Kiessling
Dr. Arlene Laing
Dr. Elizabeth Mulvihill Page
Amy Stevermer
Warren Rodie
Dr. Doug Wesley
Science Writer
Jennifer Frazer
Spanish Translations
David Russi
NOAA/National Weather Service - Forecast Decision Training Branch
Anthony Mostek (Branch Chief)
Dr. Richard Koehler (Hydrology Training Lead)
Brian Motta (IFPS Training)
Dr. Robert Rozumalski (SOO Science and Training Resource [SOO/STRC] Coordinator)
Ross Van Til (Meteorologist)
Shannon White (AWIPS Training)
Meteorological Service of Canada Visiting Meteorologists
Phil Chadwick
James Cummine