EFS Tools Used to Assess Uncertainty and Probability » Plume Diagrams
Now, let’s look at a plume diagram, which is a spaghetti plot of a forecast variable (such as accumulated precipitation) at a point, over a period of time.
Below we see an example of a precipitation plume diagram. The point represented is Scottsbluff, NE, and the forecast starts with the 3-hour accumulated precipitation forecast initialized at 09 UTC 22 October, and runs to 21 UTC 25 October 2008. The EFS used for the plot is again the NCEP SREF. Cumulative forecast precipitation at three-hour intervals is shown, color coded by precipitation type – rain in green, snow in blue, freezing rain in red, and ice pellets in teal - as indicated by the legend to the left of the graphic. The light gray lines in the plume diagram are 3-hourly accumulated precipitation for each ensemble member.
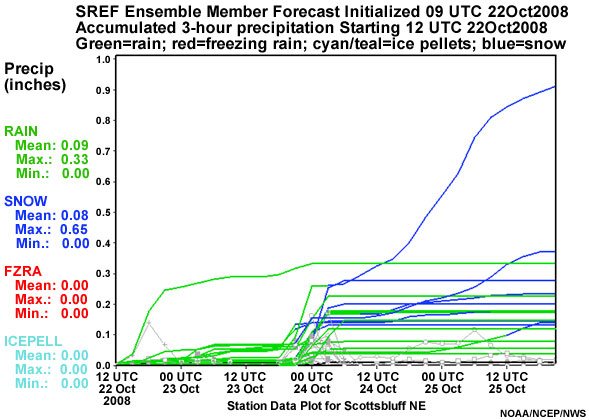
The plume diagram suggests the potential for a mixed snow and rain event late on 23 October into 24 October 2008. The uncertainty here is with regard to both the precipitation type and precipitation amount, with one member showing about 0.9" of total liquid equivalent precipitation, of which 0.65" is in the form of snow over a 36 hour period.
Generally speaking, in both spaghetti and plume diagrams, the distance between the lines tells us the degree of uncertainty.