EFS Tools Used to Assess Uncertainty and Probability » Spaghetti Plots
This image shows a spaghetti plot with the 5220, 5460, and 5760-m contours from each EFS member of the NCEP Short Range Ensemble Forecast (SREF) assigned a different color. The grey shading shows the spread about the ensemble mean and the thick black contour shows the ensemble mean position of each of the 3 contours. The darker shading depicts larger spread in the figure.
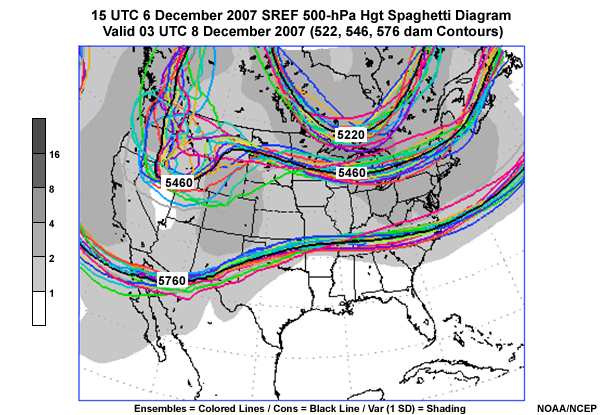
The 500 hPa data clearly show areas of both high and low uncertainty based on the spread of the contours. Adding the spread helps with this activity. Clearly, there is good agreement at 500 hPa over Florida where there is no shading and large disagreement over the Great Lakes where the contours diverge. Also, note the darker shading in the confluent flow along the East Coast.